Category: Statistics

  • AI Citation Share: How to Benchmark Your Visibility Against Competing Sources

    AI Citation Share: How to Benchmark Your Visibility Against Competing Sources

    A brand can double its AI citations and still lose ground. That happens when the total source pool grows faster, new publishers enter the answer set, or the brand’s citations accumulate around low-value informational requests while competitors dominate commercial decisions. Raw citation counts make the first trend look positive. They hide the second.

    AI citation share adds a denominator. It asks what portion of the available citation space your site receives for a defined retrieval context. The metric is useful because it makes relative visibility visible, but it is easy to overstate. A higher share does not automatically mean better content, more traffic, or stronger buyer preference. A defensible benchmark combines citation share with intent, topic, page, answer, and business evidence.

    AI Citation Share Measures Relative Source Presence

    Microsoft introduced Citation Share as part of the expanded Bing Webmaster Tools AI Performance preview. For a specific grounding query, it calculates the percentage of displayed citations attributed to your site out of all citations shown across sites for that same query.

    The basic relationship is:

    Citation Share = citations attributed to your site ÷ all displayed citations for the grounding query × 100

    Suppose your site receives 18 citations and all sites collectively receive 120 citations for a grounding query during the selected period. Your citation share is 15 percent. If your count rises to 24 while the total expands to 240, your share falls to 10 percent despite the higher raw count.

    This denominator makes Citation Share more informative than citation volume alone. It reveals whether your source presence is gaining or losing relative representation within the observed citation set.

    It remains an observational metric. Microsoft explicitly states that Citation Share is not a ranking system, traffic share, quality score, or competitor-domain report.

    Citation Share Is Not the Same as Share of Voice

    Teams often use citation share, share of voice, mention rate, recommendation rate, and source coverage interchangeably. They answer different questions and use different denominators.

    Citation share concerns source links. Brand share of voice concerns how often or how prominently a brand appears in answers. A page can be cited even when the brand is not named, and a brand can be recommended using third-party sources without citing its own domain.

    MetricNumeratorDenominatorBest decision useMain limitation
    Citation ShareCitations attributed to your siteAll displayed citations for the same grounding queryRelative source presenceDoes not show brand framing or traffic
    Total CitationsCitations attributed to your siteNoneVolume trendNo competitive or market context
    Brand Mention RateAnswers mentioning your brandAll tested answersInclusion in the consideration setDepends on the tested prompt sample
    Recommendation RateAnswers actively recommending your brandEligible commercial answersPurchase-intent visibilityRequires answer interpretation
    Source CoverageUnique prompts or topics citing your pagesDefined prompt or topic universeBreadth of authoritySensitive to taxonomy and sample design

    Do not combine them into a single score unless the weighting, denominator, and loss of detail are explicit. A composite can simplify executive reporting, but diagnosis still requires the original metrics.
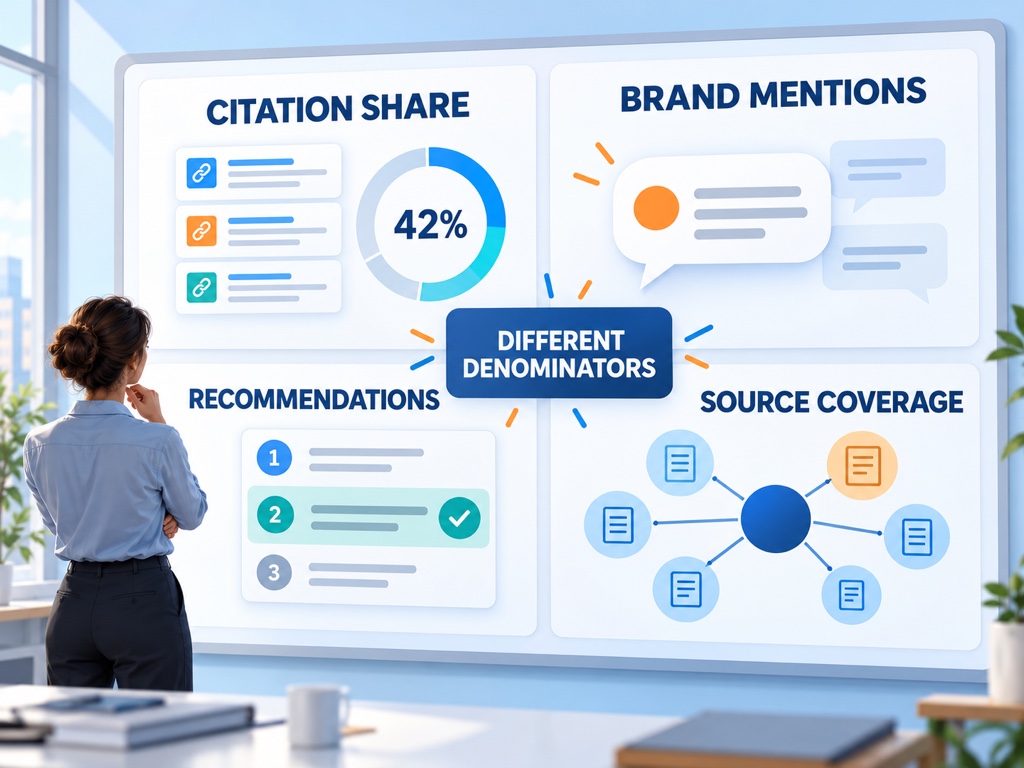
    Diagram separating citation share, brand mentions, recommendations, and source coverage

    Define the Benchmark Universe Before Calculating Anything

    A benchmark is only comparable when its universe is stable. Before collecting data, document the platform, reporting surface, date range, geography, language, topic, intent, and page scope.

    For Bing Citation Share, start with complete equivalent periods. Use the same filter set and compare the same grounding queries or topic clusters. Microsoft’s Compare feature can overlay prior periods, but it cannot prevent you from comparing a seasonal promotion with a quiet month or a complete period with partial data.

    For answer-level tools, freeze the prompt set and execution conditions. Record wording, language, location, model or experience, account state when relevant, and the number of repeated observations. AI answers vary, so one run per prompt should not be presented as a stable market share estimate.

    Use three benchmark levels:

    1. Query level: one defined grounding query or prompt intent.
    2. Topic level: a controlled group of related queries representing one subject.
    3. Portfolio level: weighted topic groups representing the decisions that matter to the business.

    The portfolio level requires declared weights. Giving every query equal weight is simple, but it can let high-volume informational topics overwhelm a smaller group of commercial decisions. Weighting by business priority can be more useful, provided the report clearly labels it as a strategic index rather than observed market share.

    Segment by Intent Before Comparing Sources

    The same overall citation share can hide opposite outcomes. A software brand may hold 30 percent share for educational definitions and 3 percent for vendor comparisons. Averaging the two can make the program look acceptable while the purchase-intent gap persists.

    Microsoft’s Intents feature classifies grounding activity into categories such as Informational, Commercial, Navigational, Learn and Solve, Research, Creation, and Local. Its Topics feature groups related phrases into larger themes. These classifications help teams move beyond isolated queries, but they are generated by evolving models and may be broad in specialized categories.

    Create your own decision-oriented layer beside the platform labels. A useful commercial taxonomy might include problem recognition, requirements definition, option discovery, comparison, risk validation, and vendor selection. Map each query once, document ambiguous cases, and keep the rules stable across periods.

    Then report citation share by intent. The result shows whether your site is used to educate, define requirements, validate claims, or support a shortlist.

    Use Page Role and Source Type to Explain the Share

    Citation share tells you how much source space your site receives. Page-role analysis helps explain what kind of evidence earned that space.

    Classify cited pages into product pages, documentation, research, comparison pages, help content, case studies, tools, and editorial articles. Then inspect whether the page role matches the grounding intent. Documentation may perform well for implementation questions but poorly for neutral comparisons. A proprietary research page may earn citations across several topics because it supplies an original statistic other pages repeat.

    Next, classify competing source types without assuming every domain is a direct business competitor. AI answers may cite regulators, standards bodies, news publishers, review sites, forums, documentation, academic research, and vendor pages in the same response. Each source plays a different evidence role.

    A falling share against standards bodies is not necessarily a content failure. A falling share against a direct competitor’s unsupported marketing page may be more actionable, especially when your site has stronger primary evidence that is difficult to locate or extract.

    Diagnose Change With Counts, Denominators, and Concentration

    Never investigate a citation-share movement without the numerator and denominator. Share can fall because your citations decreased, because total citations expanded, or because both moved at different rates.

    Add concentration. Calculate how much of your citation count comes from the top page, top query, and top topic. A 20 percent share built on one evergreen page is less resilient than the same share distributed across a coherent content cluster.

    Use the following diagnostic sequence:

    • Your citations up, total citations up faster: the source pool expanded and competitors captured more of the growth.
    • Your citations flat, total citations up: demand or source diversity may be increasing while your footprint remains static.
    • Your citations down, total citations flat: investigate eligibility, freshness, content fit, and competing sources.
    • Your citations up, total citations down: share may rise sharply because the observed pool contracted.
    • Share stable, page concentration rising: the headline is steady but dependency risk is increasing.

    Microsoft notes that citation patterns can move with user behavior, models, freshness signals, partner refresh cycles, and broader web changes. Treat a time-aligned content update as one plausible explanation, not proof.
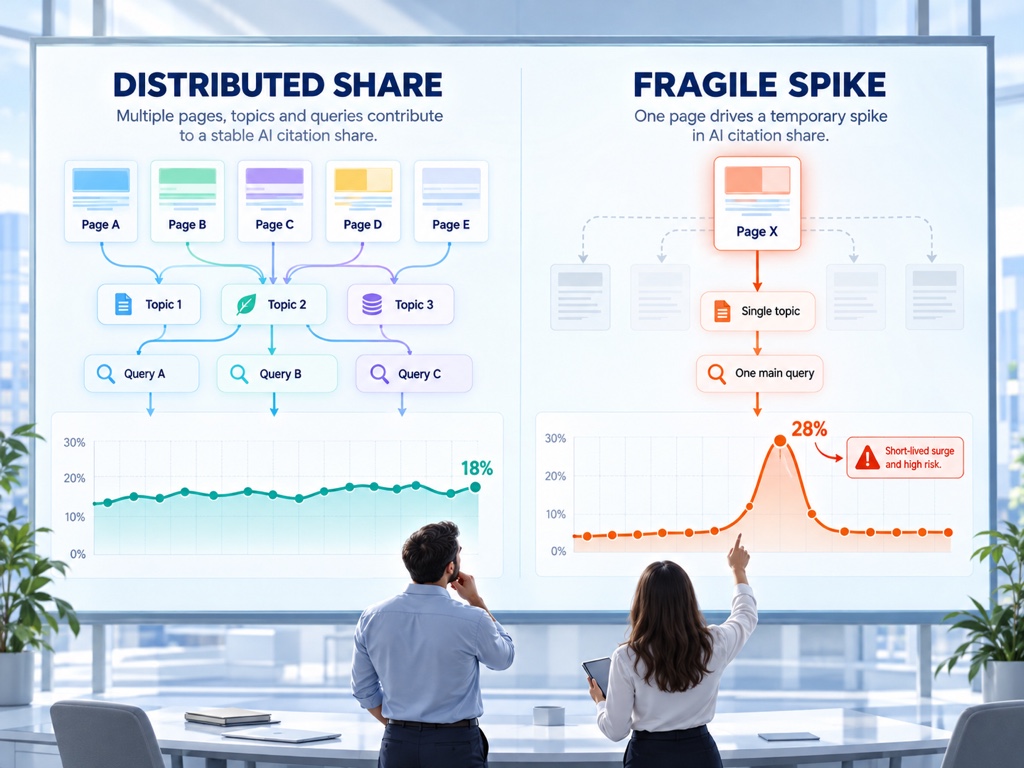
    Two analysts comparing a broad healthy citation portfolio with a fragile one-page share spike

    Convert Citation Gaps Into Evidence Work, Not Keyword Volume

    A low citation share does not always require a new article. First identify the evidence role that competing sources fulfill.

    The missing asset may be an original dataset, a clearer specification, a current policy page, a transparent comparison, a worked example, a definition with boundaries, or an independently corroborated claim. Publishing several near-duplicate keyword pages can make the site’s intent less clear without supplying the evidence the answer system needs.

    For each gap, record:

    • the target intent and topic;
    • the sources currently receiving citations;
    • the evidence type they contribute;
    • whether your site already contains equivalent evidence;
    • the smallest content or technical change that would make it discoverable;
    • the metric and period used to evaluate the change.

    If the evidence already exists, improve headings, internal links, canonical signals, freshness, and explicit sourcing before creating another page. Microsoft recommends clear structure, supporting claims with evidence, keeping content current, and reducing ambiguity across text, images, and video in its AI Performance guidance.

    Combine First-Party Citation Share With Prompt-Level Competitor Evidence

    Bing Citation Share does not expose competitor domains. That protects the metric from becoming a simplistic leaderboard, but it also means you need another evidence layer to understand who appears in the answers and how.

    Topify can support that second layer by monitoring a controlled prompt set, comparing brand inclusion, recommendations, answer position, and cited sources. Use it to inspect specific decisions rather than to recreate Bing’s denominator. The platform samples prompts you define, while Bing aggregates supported Microsoft citation activity.

    A practical joined report contains four panels:

    1. Bing Citation Share by grounding query, topic, and intent.
    2. Your citation count, total citation pool, and page concentration.
    3. Prompt-level brand mentions, recommendations, positions, and cited domains.
    4. Qualified visits, assisted conversions, pipeline events, or another business outcome.

    Do not expect the panels to move together. A source can gain share before brand recommendations change. Third-party pages can strengthen a brand’s answer visibility while the brand’s own-domain citation share remains flat. Those differences show where influence is occurring.

    Report Confidence and Method Changes Beside the Result

    An executive chart should never hide the conditions that produced it. State whether the data comes from a preview feature, whether query or topic coverage changed, and whether the period contains incomplete days.

    Assign confidence based on stability and corroboration. High confidence requires comparable periods, adequate activity, stable classification, distributed page evidence, and supporting answer observations. Medium confidence may show a consistent direction with some missing context. Low confidence applies to small samples, volatile queries, classification changes, or a movement driven by one page.

    Version the benchmark whenever you add queries, change topic rules, adjust weights, or alter the monitored platforms. Keep the old version available so stakeholders can distinguish performance change from methodology change.

    Conclusion

    AI citation share improves visibility reporting because it restores the denominator that raw citation counts omit. It can show whether your site is gaining relative source presence for a defined grounding query, topic, or intent. It cannot tell you that the brand ranked first, won the recommendation, earned traffic, or caused a conversion.

    Build the benchmark from a stable universe, segment it by decision intent, and keep counts and concentration beside the percentage. Then inspect the pages and source roles behind the movement. The strongest next step is rarely “publish more.” It is to supply the missing evidence, make existing evidence easier to retrieve, and test whether source visibility improves in the decision contexts that matter.

    FAQ

    What is AI citation share?

    AI citation share is the percentage of displayed citations attributed to a site within a defined citation pool, such as citations shown for the same grounding query.

    Is citation share the same as AI share of voice?

    No. Citation share measures source links, while AI share of voice usually measures brand presence or prominence in a controlled set of answers.

    Can citation share identify competitors?

    Bing’s Citation Share does not expose competitor domains. Answer-level monitoring and manual source review can provide competitor context for a defined prompt sample.

    What is a good AI citation share?

    There is no universal target. A useful target depends on topic, intent, source diversity, market structure, page role, and the stability of the underlying citation pool.
    Read More

  • How to Run a 100-Prompt AI Shopping Visibility Benchmark

    How to Run a 100-Prompt AI Shopping Visibility Benchmark

    A shopping benchmark can look rigorous while measuring almost nothing. One hundred prompts copied from a keyword tool may represent the same broad question. One run per prompt can turn normal answer variation into a leaderboard. Mixing countries, logged-in personalization, changing product availability, and different scoring rules creates percentages that cannot be reproduced.

    A credible AI shopping visibility benchmark begins with a written method and ends with uncertainty, not a dramatic chart. This framework shows how to design 100 prompts, capture recommendation evidence, calculate transparent metrics, and publish a result that another analyst could audit. It provides the scorecard, not invented findings.

    Define the Decision the Benchmark Will Support

    Choose one decision before selecting prompts. A benchmark might compare brands within a category, establish one brand’s baseline, compare platforms, or measure change after product-data improvements. Those purposes require different samples.

    Write the population statement in plain language. For example: “High-intent U.S. prompts for selecting noise-canceling headphones across three buyer stages.” That statement sets boundaries for language, region, product category, availability, and interpretation.

    Do not call a convenience sample “all AI shopping.” A benchmark of one category and market can be useful without pretending to represent every product or shopper.

    Build 100 Prompts With a Quota Matrix

    Use a quota matrix so the sample covers distinct buyer decisions rather than 100 paraphrases. A balanced single-category design could allocate prompts across five intent families and five constraint families.

    Prompt quotaCountExample purpose
    Category discovery20Find credible options without naming a brand
    Use-case fit20Select for travel, work, home, sport, or another context
    Constraint fit20Apply budget, size, compatibility, risk, or policy limits
    Comparison20Compare named or discovered alternatives
    Purchase-ready20Ask where to buy, availability, shipping, or current value

    Within each family, distribute role, budget, compatibility, geography, and exclusion signals. Keep a unique prompt ID, exact text, intent, constraint tags, expected answer type, and inclusion reason.

    Pilot ten prompts before freezing the full set. Remove ambiguous wording, duplicate decisions, prompts that require unavailable private information, and questions no credible answer could resolve.

    Freeze the Test Conditions Before Collection

    Document platform, product experience, account state, memory or personalization settings where controllable, region, language, device, date, and time window. Record whether the system asks follow-up questions and how researchers respond.

    OpenAI says Shopping Research can use constraints, merchant ACP data, public product information, and other retail sources in a multi-step discovery process. Google AI shopping experiences can use conversational refinement and its Shopping Graph. The benchmark must therefore define whether follow-ups are answered, skipped, or scripted.

    Check product availability and major price changes before each collection window. A recommendation can change because inventory changed, not because brand visibility improved.

    Do not change prompts halfway through a baseline. Version any revision and report it as a new wave.

    Repeat Observations Instead of Trusting One Answer

    Generated responses can vary. Run each prompt more than once when budget and platform rules allow, spacing observations according to the study purpose. A cross-sectional snapshot may use several repetitions in a short window; a trend benchmark may repeat the frozen set weekly.

    Define the observation count before seeing results. Do not rerun only the prompts where a preferred brand lost.

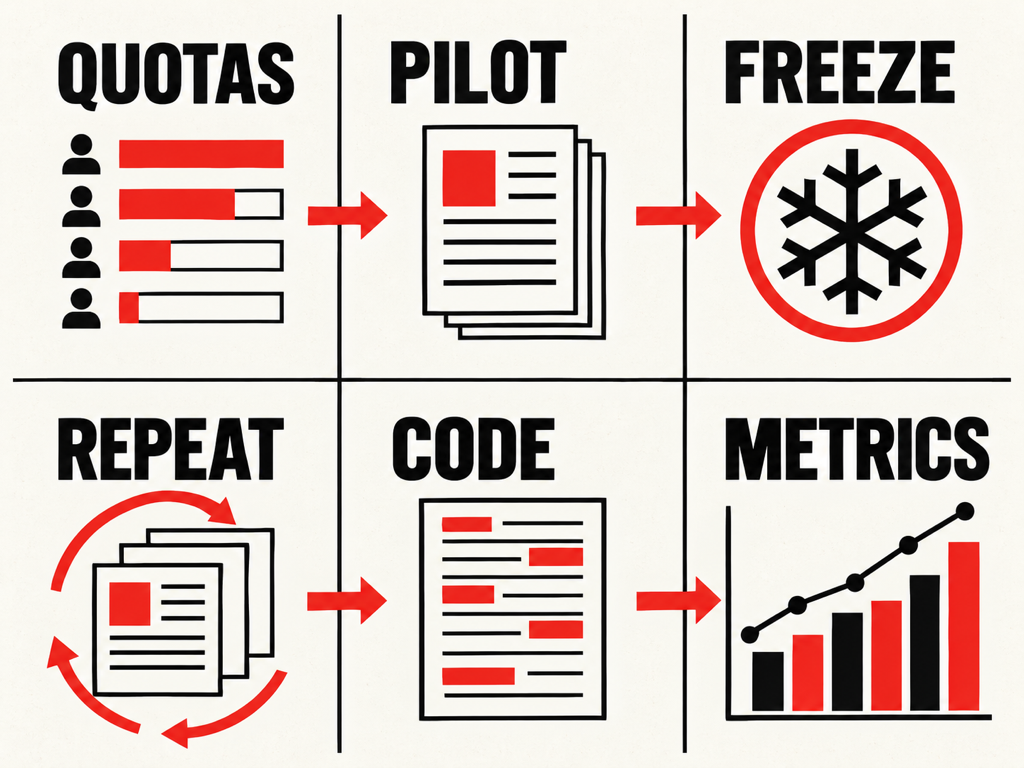
    Benchmark workflow from quota design and pilot prompts to frozen conditions, repeated observations, coding, and audited metrics.

    Store the raw response or permitted evidence, collection timestamp, links, follow-up path, and any error. Record refusals, unavailable experiences, and timeouts rather than silently replacing them.

    If platform terms or interface constraints prevent automated collection, use a documented manual method or reduce scope. Method consistency is more important than an impressive sample claim.

    Create a Coding Guide Before Analysts Score Answers

    Define every outcome with examples. At minimum, distinguish mentioned, recommended, top pick, cited, and merchant-linked.

    A brand mention in background context is not the same as a recommendation. A product carousel placement may differ from a written top pick. A merchant link may point to the brand, a marketplace, or an unrelated seller.

    Use a structured record for each prompt-observation-brand combination:

    • brand and product name as shown;
    • mention present;
    • explicit recommendation present;
    • ordered position when meaningful;
    • top-pick status;
    • cited owned domain;
    • cited third-party domain;
    • merchant link and destination type;
    • rationale and trade-offs;
    • incorrect or stale claim;
    • coding confidence and reviewer note.

    Have a second reviewer code a sample before full production. Resolve disagreements and update the guide without changing earlier rows silently.

    Calculate Metrics With Transparent Denominators

    Every percentage needs an eligible denominator. Exclude or separately report failed observations; do not turn them into zeros without explanation.

    MetricFormulaInterpretationLimitation
    Recommendation rateobservations explicitly recommending brand / eligible observationsHow often the brand is selectedDepends on prompt sample and repetitions
    Top-pick rateobservations naming brand first or best / eligible ordered observationsFrequency of leading recommendationNot all answers are ordered
    Prompt coverageunique prompts recommending brand / eligible unique promptsBreadth across buyer decisionsIgnores repeated-result stability
    Owned citation rateobservations citing owned domain / eligible observationsUse of brand-controlled evidenceCitation does not equal recommendation
    Merchant-link rateobservations with usable merchant link / eligible observationsPurchase-path availabilityDestination quality still needs review
    Competitor overlapprompts where brand and competitor co-occur / eligible promptsShared consideration setDoes not show which brand is preferred
    Attribute error rateobservations with material wrong fact / audited observationsReliability of product representationRequires current source-of-truth review

    Report counts beside rates. “18 of 60 eligible observations” is more interpretable than “30 percent” alone.

    Separate Brand, Product, Platform, and Prompt Effects

    A result can move because of the product assortment, platform, prompt mix, or observation timing. Break out metrics by intent family, constraint family, platform, and product where sample size permits.

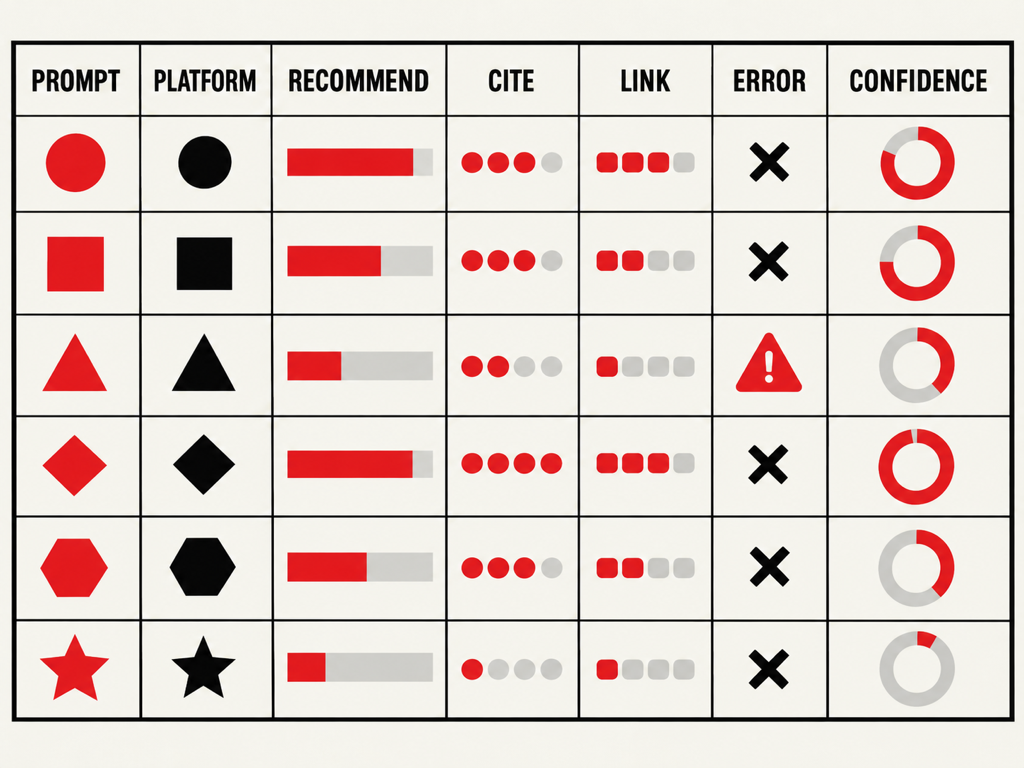
    Benchmark scorecard separating prompt family, platform, recommendation rate, citations, merchant links, errors, and confidence.

    Avoid ranking brands from tiny subgroups. If only four prompts represent regulated use cases, treat the result as directional. Publish the count and uncertainty rather than a false decimal precision.

    When comparing platforms, keep the prompt meaning aligned while respecting different interactions. A system that asks follow-up questions and a system that returns an immediate grid are not identical test environments. Report that behavioral difference as part of the result.

    Add Quality Control and an Audit Trail

    Before analysis, check for duplicate prompt IDs, missing responses, inconsistent brand normalization, broken merchant links, impossible positions, and denominator drift. Keep raw evidence separate from the analysis table.

    Maintain a change log for the prompt set, coding guide, product truth source, and collection scripts or procedures. Hashes or version numbers can help demonstrate that the baseline was not edited after results appeared.

    Review a random sample of coded observations and every surprising outlier. A 100 percent recommendation rate for one small brand may reflect a branded prompt, entity-name collision, or coding mistake.

    Protect user and customer data. Use synthetic or generalized buyer constraints unless participants explicitly consent to research use.

    Publish the Method Beside the Findings

    A benchmark report should disclose purpose, category, market, dates, platforms, prompt-selection method, quotas, exact or representative prompts, repetition count, account conditions, follow-up protocol, coding definitions, exclusions, and limitations.

    Clearly label observations and interpretations. Do not claim causality from a cross-sectional comparison. Do not generalize one category to all AI shopping.

    The report should also state what was not measured: total platform demand, private model signals, every shopper conversation, or guaranteed future recommendations.

    Topify can support recurring prompt observation, competitor comparison, position, and source analysis after the exact 100-prompt set is approved. Keep any paid activation separate from the research design and confirm the platforms, regions, cadence, and credit impact before collection.

    Until real observations exist, publish the method and blank scorecard only. A methodology article is more credible than percentages invented to complete a headline.

    Conclusion

    A 100-prompt AI shopping visibility benchmark is credible only when the sample, conditions, repetitions, coding, and denominators are fixed before results are known. The number 100 creates no rigor by itself.

    Define one decision, build a quota matrix, pilot and freeze the prompts, repeat observations consistently, and code mentions, recommendations, citations, merchant links, and errors with a written guide. Publish counts, limitations, and version history beside every rate. That method produces a baseline teams can rerun and challenge without pretending to measure all AI shopping behavior.

    FAQ

    Why use 100 prompts for an AI shopping benchmark?

    One hundred prompts can support a practical quota design across intent and constraint families. It is a planning size, not proof of statistical representativeness.

    Should each prompt be run more than once?

    Yes when resources and platform rules allow. Repeated observations help separate a stable recommendation pattern from normal answer variation.

    What is the difference between a mention and a recommendation?

    A mention names the brand or product. A recommendation explicitly selects it as suitable for the user’s decision or constraints.

    Can a 100-prompt benchmark estimate total AI shopping market share?

    No. It estimates outcomes within the defined prompt sample, platforms, region, and observation window. It is not total platform demand or market share.

    Read More

  • How To Compare AI Search Optimization Tools

    Look for Tools That Help You Understand AI Citations

    Traditional SEO = keywords.
    AI Search Optimization = citations, prompts, answer positioning.

    When comparing tools, ask:

  • Does it tell me where my brand appears inside AI-generated answers?

  • Can it track competitor visibility across AI engines?

  • Does it measure which prompts generate mentions or traffic potential?

  • Can it help me optimize content to appear in AI answers?

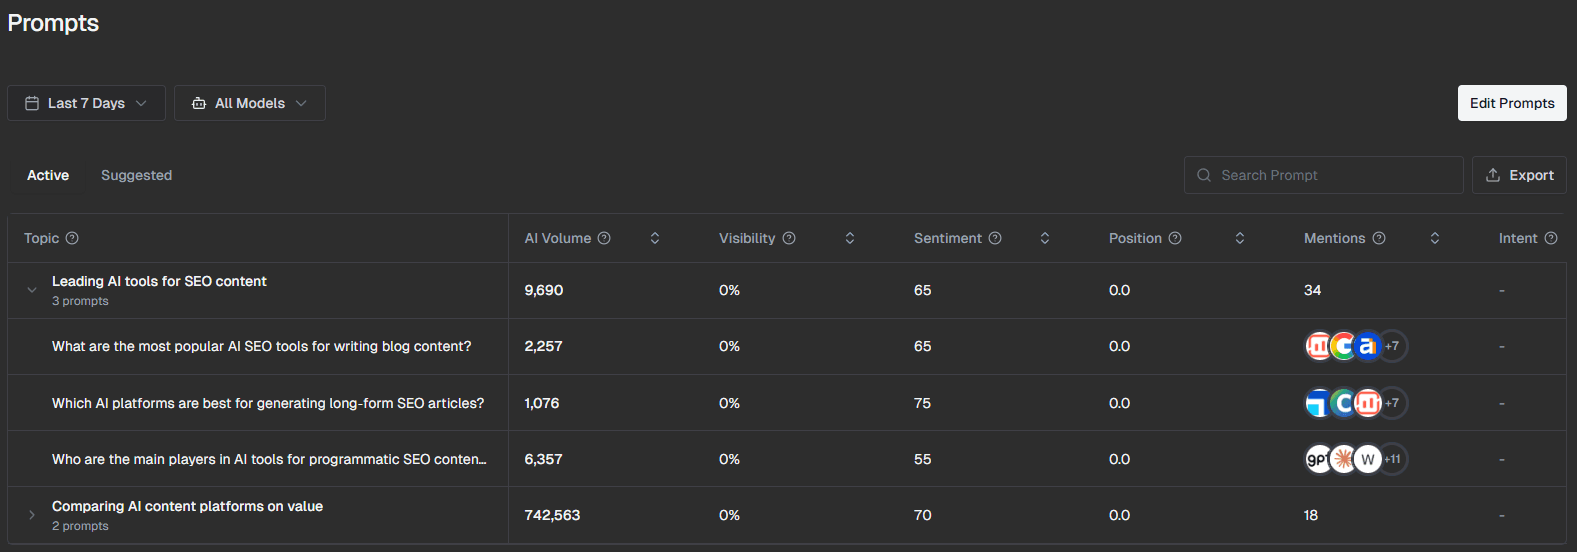
    Topify.ai screen that show prompts and how your brand is ranking in the ai platforms

  • Topify.ai is designed around this.

    It maps:

  • which AI engines mention your brand

  • which prompts you appear in

  • what answers include you

  • how often you win against competitors

  • which content pieces are improving your AI visibility

  • This is the biggest gap missing in traditional SEO platforms — and one of the key reasons they struggle to serve brands in an AI-search world.

    Compare Automation Depth: Is It Truly AI-Driven or Just a “Wrapper”?

    A lot of SEO tools have “AI features” that are basically:

  • text rewrites

  • surface-level optimization scores

  • basic suggestions

  • A real AI search optimization platform should automate complex, multi-step workflows, including:

  • AI search monitoring

  • Answer extraction

  • Visibility scoring

  • Competitor citation mapping

  • Content opportunity identification

  • Prompt-level ranking performance

  • Topify.ai automates the entire AI visibility pipeline, not just content generation, meaning that you spend less time guessing and more time executing strategies that actually influence AI engines.

    Look for Tools That Help You Build AI-Ready Content

    Ranking in AI search is not about keyword stuffing — AI engines prioritize:

  • trust

  • clarity

  • structure

  • entity relationships

  • factual signals

  • brand authority

  • A strong AI-search optimization tool should help create content that is:

     ✔ structurally readable by LLMs
    ✔ fact-reinforced
    ✔ entity-linked
    ✔ optimized for AI answer extraction
    ✔ aligned with the “how LLMs think” model

    Topify.ai helps uncover what content formats AI engines prefer, which pages drive citations, and how to structure content to increase answer inclusion — a key differentiator from “AI writing tools.”

    Compare Their Ability to Track Competitors in AI Search

    In traditional SEO, you track:

  • domain rank

  • backlinks

  • keyword position

  • In AI search, you track:

  • competitor mention frequency

  • competitors share inside AI answers

  • prompt-specific win/loss

  • overlapping answer coverage

  • Topify.ai brings this visibility through AI Competitor Tracking, showing:

  • who dominates prompts

  • where they’re mentioned

  • how often they win

  • what content earned those citations

  • When comparing tools, ensure they provide a clear competitive lens inside AI engines — not just SERPs.

    Evaluate if the Tool Helps You Build a Future-Proof Strategy

    Most SEO tools were not designed for:

  • LLM-driven discovery

  • answer-based engines

  • citation scoring

  • AI answer monitoring

  • entity-focused optimization

  • A modern tool should help you:

     ✔ adapt to generative search
    ✔ scale content based on AI-driven patterns
    ✔ future-proof your visibility
    ✔ reduce dependency on Google-only rankings

    Topify.ai is built specifically for the shift happening now, not the SEO world of 2015–2023.

    Final Checklist: What to Look For in an AI Search Optimization Tool

    When comparing tools, ensure they offer:

  • AI Search Visibility Tracking – not just Google rankings

  • Citation & Prompt Monitoring – you know where your brand wins in LLM answers

  • Competitor AI Visibility Analysis – to understand who’s winning in AI search

  • Content Recommendations Built for AI Engines – not keyword stuffing or generic scoring

  • Automation Across AI Search Workflows – real AI, not plug-ins

  • Future-Proof Strategy Support – built for the next era of search

  • Topify.ai checks all of these boxes — because it’s built from the ground up for the AI-search era, not retrofitted from older SEO practices.

    Conclusion: Picking the Right Tool Determines Your Visibility in the AI-Search Era

    Traditional SEO tools are still focusing to help brands only to win in tradicional Google-dominant era, but search is changing, and also the tools need to change.

    When comparing AI search optimization platforms, look for:

  • AI citation understanding

  • prompt and answer visibility

  • deep automation

  • competitor analysis

  • content structured for LLM discovery

  • future-proof capabilities

  • This is exactly where Topify.ai outperforms, enabling brands to grow AI search visibility, appear in AI answers, and win against competitors in the new search economy.

    Book a quick demo with us, and we’ll show you exactly how we can supercharge your site’s visibility in the world of AI.