Author: Elsa Ji

  • The GEO Rank Tracker Report Your CMO Will Actually Read

    The GEO Rank Tracker Report Your CMO Will Actually Read

    You open the quarterly review with a visibility chart that’s up 12 points. The room nods. Then your CMO asks what that number means for pipeline, and the honest answer is that you don’t have one. Three slides later she’s checking her phone. The tracking wasn’t the failure. The report was, because nothing on it answered a question anyone in that room was accountable for.

    Your GEO Rank Tracker Isn’t the Problem. The Translation Layer Is.

    Budget has already moved. Marketers now route roughly 24% of search and content budgets toward AI visibility work, and among 300 enterprise marketing executives surveyed by Search Engine Journal, 65% are allocating at least a quarterof their entire marketing budget to AI.

    Measurement didn’t move with it. In the same survey, two-thirds said they were very confident in measuring outcomes, then 66% reported challenges with the basics of measurement when asked in more detail. Confidence and capability are running on separate tracks.

    The gap shows up at the reporting layer, not the collection layer. Only 14% of marketers track AI visibility at all, and among those who do, Semrush found just 22% describe their SEO and AI search work as fully integrated across strategy, execution, and reporting. Reporting is the word that keeps falling off the end of that list.

    So the constraint isn’t your GEO rank tracker. It’s that raw tracker output is written for the person who set up the prompts, and your CMO is not that person.

    The First Page: Five Numbers, and Nothing Else

    An executive report has one page that matters. Everything else is defense material for questions that may never come.

    Put five rows on it:

    RowWhat it showsThe question it answers
    AI Visibility Score, 90-day trendOne weighted number across your priority prompt setAre we gaining or losing ground?
    Share of voice vs top 3 competitorsYour mention share against named rivals, by categoryIs the gap widening or closing?
    Platform splitChatGPT, Gemini, Perplexity, AI Overviews as four barsWhere do we win, and where are we absent?
    Sentiment mixPositive, neutral, negative, qualifiedIs AI describing us the way we position ourselves?
    Attributable outcomesAI referral sessions, AI-attributed conversions, branded search liftWhat did this produce?

    Two of those rows carry most of the weight.

    Share of voice is the one that survives scrutiny, because a number with a competitor next to it can’t be dismissed as noise. Semrush’s study of 481 marketers found 37% say competitors are mentioned more often than they are in AI answers. That’s a comparison your CMO already suspects is true and has no data on.

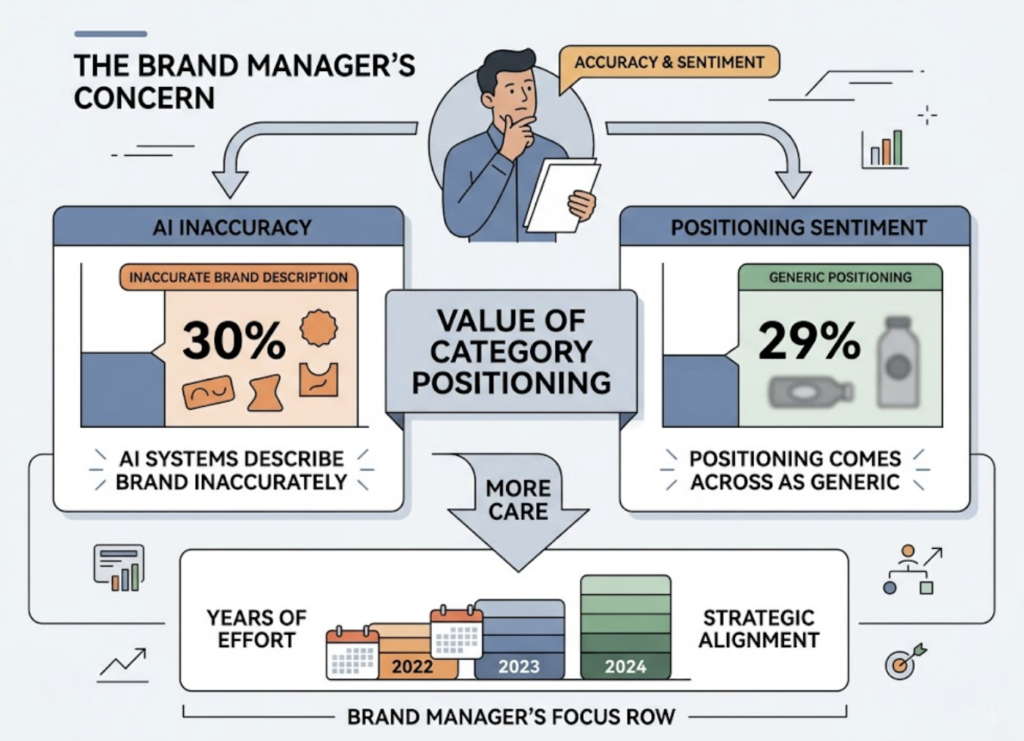
    Sentiment is the second, and it’s usually underplayed. In the same study, 30% reported their brand is described inaccurately by AI systems and 29% said their positioning comes across as generic. A brand manager who has spent two years on category positioning will care more about that row than about any score.
    Flag any category where negative or qualified mentions exceed 10% of total mentions. That’s the threshold worth escalating.

    What Belongs in the Appendix, Not the Headline Row

    Here’s the filter that keeps executive trust intact: if finance can’t tie a metric to a dollar, it doesn’t belong in the headline row. Raw mention counts, per-prompt screenshots, single-day scores, and unweighted prompt coverage all fail that test. They belong in the appendix, where they’ll do their real job of answering follow-up questions.

    The cost of getting this wrong isn’t a boring meeting. It’s cumulative. Only 32% of CEOs currently trust their CMOs, and 34% of Fortune 500 companies have removed the CMO role from the C-suite entirely. Your report is one input into that dynamic, and a page of impressive-looking activity metrics pushes in the wrong direction.

    The Spring 2026 CMO Survey puts a number on the pressure your CMO is passing down. Marketing leaders rate their partnership with the CFO at 4.8 on a 7-point scale for growth planning, and the case-building score has crept from 4.3 to 4.5 over four years. Your CMO isn’t asking about revenue to be difficult. She’s asking because someone is asking her.

    Translating AI Visibility Into Revenue Language

    The conversion data is the strongest card you have, and most reports leave it in the deck.

    AI referral traffic is small. Conductor’s study across 13,770 domains put it at roughly 1.08% of total sessions. If you lead with volume, you lose.

    Lead with quality instead. Semrush’s research across 500-plus high-value topics found AI search visitors converting at 4.4x the rate of traditional organic visitors. Ahrefs published its own numbers showing 0.5% of sessions from AI platforms driving 12.1% of all signups. In Seer Interactive’s multi-vertical data, ChatGPT referrals converted at 15.9%against 1.76% for Google organic.

    The mechanism is worth saying out loud in the meeting, because it’s what makes the multiple believable: the AI answer does the shortlisting before the click. By the time someone arrives, they’ve already been pre-qualified by the model.

    One more line for context. Conductor pegs ChatGPT at roughly 87.4% of average AI referral traffic across industries. If your platform split shows you strong on Perplexity and weak on ChatGPT, that’s not a balanced scorecard. That’s a concentrated risk, and it’s worth naming as one.

    The Volatility Problem Your CMO Will Find Before You Do

    AI answers are not stable, and your report has to say so before someone else discovers it.

    AirOps found that only 30% of brands stay visible from one answer to the next, and just 20% remain visible across five consecutive runs of the same prompt. A single run tells you almost nothing. A month of runs tells you something real.

    That leads to three reporting rules worth adopting permanently:

    Report trends, never single points. A 90-day line with a stated sample size is defensible. A screenshot from Tuesday is not.

    Disclose the sample. How many prompts, how many runs per prompt, which platforms, over what window. One sentence in the footer. It costs you nothing and it’s the first thing a skeptical CFO will ask for.

    Reset the baseline when models change. A platform’s model update can shift citation behavior across your whole prompt set. When that happens, annotate the chart rather than explaining the dip verbally three weeks later.

    Volatility disclosed is credibility. Volatility discovered is a problem.

    Say the Attribution Gap Out Loud

    Most AI-driven visits don’t identify themselves. Analysis of 446,000 visits found 70.6% of AI traffic landing as “Direct”in GA4, because the user read your name inside a chat interface, opened a new tab, and typed your URL.

    That means your AI-attributed conversion row is a floor, not a total. Say exactly that in the footnote.

    Teams hide this because it feels like admitting weakness. It’s the opposite. A report that overstates attributable outcomes gets audited once and never trusted again. A report that states its own floor and shows branded search lift alongside it survives the audit.

    Pair the referral number with branded search volume and direct traffic trend. When all three move together and your visibility score climbs, you have a correlation story that holds up in a room full of people who don’t take single-source numbers at face value.

    Where a GEO Rank Tracker Earns Its Line Item

    The five-row first page only works if one system produces all five numbers on the same sampling basis. Stitching visibility from one tool, sentiment from a second, and competitor data from a spreadsheet gives you five numbers that can’t be compared to each other.

    That’s the practical case for consolidation. Topify tracks seven metrics across major AI platforms in a single view: visibility, sentiment, position, volume, mentions, intent, and CVR. The mapping to an executive page is close to one-to-one. Visibility feeds the trend line, position and mentions feed share of voice, sentiment feeds the description row, and CVR carries the conversion likelihood argument that most dashboards leave to the analyst’s judgment.
    Competitor coverage is what makes the chart defensible rather than self-reported. Dynamic competitor benchmarking detects which brands AI engines recommend in your category and tracks your position against them over time, which turns “our score went up” into “we closed four points of gap on the two rivals your board already knows by name.”

    Then there’s the question every report should be able to answer: why did the number move? Citation-level analysis shows the exact domains and URLs AI platforms pulled from, so a drop traces back to a specific source that stopped citing you rather than a shrug. Platform coverage spans ChatGPT, Gemini, Perplexity, DeepSeek, Doubao, Qwen, and others, which matters if your market isn’t only North America.

    Plans start at $99 per month for 100 prompts and 9,000 AI answer analyses, with the $199 tier moving to 250 prompts and 22,500 analyses. Full details are on the pricing page. Against a search budget where a quarter is already flowing to AI visibility, the tracking line item is rarely the number a CFO objects to. The missing report is.

    If you want to establish a rough baseline before committing budget, a set of free GEO tools will get you a first read, and you can start tracking properly once you know which prompts matter.

    Make the Report End With a Decision, Not a Chart

    The most common failure mode isn’t a bad number. It’s a report that gets circulated, skimmed, filed, and changes nothing about what the content team publishes next month.

    Close every report with three lines:

    • What we’re doing this quarter, tied to a specific gap in the data
    • What we’re stopping, because it hasn’t moved a tracked metric in 90 days
    • What success looks like next quarter, stated as a number before the quarter starts

    Monthly cadence for the working team, quarterly for leadership. The monthly version can be one page of the five rows plus a changelog. The quarterly version adds the revenue translation and the decisions.

    Bottom line: your CMO doesn’t need to understand how a GEO rank tracker works. She needs to walk out of the room able to defend a budget line with three sentences.

    Conclusion

    The report that dies on slide three isn’t failing because the data is weak. It’s failing because it was written for the person who built the prompt set instead of the person who has to defend the spend.

    Fix it in this order. Cut the first page to five rows. Put a competitor name next to your score. State your sample size and your attribution floor before anyone asks. End with a decision instead of a chart.

    Do that once and the quarterly review stops being a defense of the channel. It becomes the meeting where the channel gets funded.

    FAQ

    Q: What should a GEO rank tracker report include for executives? 

    A: Five things on the first page: a weighted visibility score with a 90-day trend, share of voice against your top three named competitors, a platform-by-platform split, sentiment mix, and attributable business outcomes. Everything else belongs in an appendix.

    Q: How often should we report AI search visibility to leadership? 

    A: Monthly for the working team, quarterly for leadership. AI answers shift week to week, so weekly executive reporting tends to surface noise rather than signal. The monthly version keeps the working team responsive without pulling leadership into volatility.

    Q: How do we connect AI visibility to revenue? 

    A: Report AI referral sessions and AI-attributed conversions alongside branded search lift, and state clearly that the referral number is a floor because most AI-driven visits arrive without a referrer. Published studies put AI referral conversion rates several times higher than organic, so the argument is about traffic quality rather than traffic volume.

    Q: Is AI share of voice a vanity metric? 

    A: Not when it’s competitive and category-scoped. A raw mention count is a vanity metric because it has no reference point. Share of voice against three named competitors in a defined category is a market-position metric, and it’s typically the most defensible number on the page.

    Read More

  • GEO Rank Tracker: Reverse-Engineer Why Competitors Get Cited

    GEO Rank Tracker: Reverse-Engineer Why Competitors Get Cited

    Your competitor shows up in ChatGPT’s answer for your highest-intent category prompt. You don’t. So you open their page next to yours and look for the difference. Their content is thinner. Their domain authority is lower. Their page loads slower.

    Nothing on that page explains the gap, because the answer wasn’t assembled from that page. It was assembled from a set of third-party sources that mention them and skip you, and that never surfaces in a two-tab comparison. It only surfaces in citation-level data, which is exactly what a GEO rank tracker exists to capture.

    Your Competitor Isn’t Winning on Content. They’re Winning on Sources.

    The default assumption is that AI engines reward better pages. The citation data says otherwise.

    Muck Rack’s 2026 analysis of 25 million cited links across ChatGPT, Claude, and Gemini found that 84% of AI citations trace back to earned media rather than owned content, paid placements, or SEO pages. CiteMetrix, tracking 680 million citations, put the performance gap between earned and owned placements at 325%. AirOps research landed in the same place from a different angle: brands are 6.5x more likely to be discovered through third-party sources than through their own domains.

    The source pool is also narrower than most teams expect. A synthesis of six citation studies covering more than 680 million citations found that the top 15 domains absorb roughly 68% of everything ChatGPT, Claude, Gemini, Perplexity, and Google AI Overviews produce, with Reddit alone cited at around 40% frequency across engines.

    So when a competitor gets recommended and you don’t, the useful question isn’t “what’s better about their page.” It’s “which sources did the model read, and why does your brand not appear inside them.”

    That’s a different investigation, and it needs different data.

    What a GEO Rank Tracker Records the Moment a Competitor Gets Cited

    Most tools marketed as AI rank trackers record a position and stop. Position tells you the outcome. It doesn’t tell you the mechanism.

    A tracker built for attribution captures five layers on every run: the prompt that triggered the answer, which brands were mentioned, the order they appeared in, the specific URLs cited, and the domains those URLs belong to. The last two layers are where reverse-engineering actually happens. Everything above them is a scoreboard.

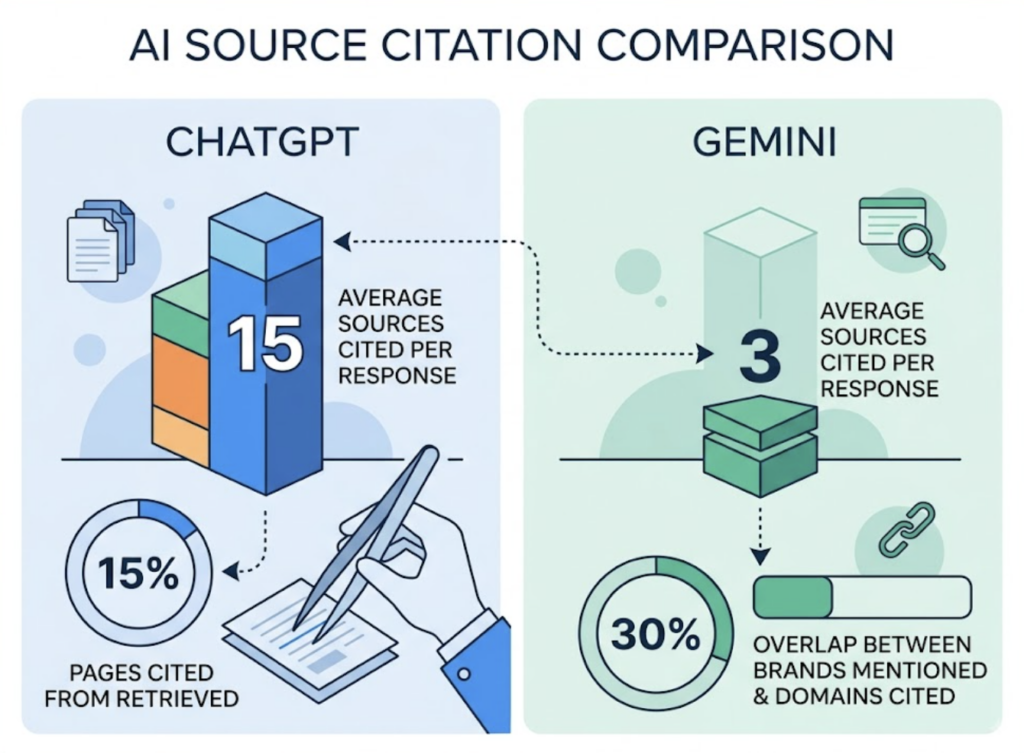
    The gap between layers is measurable. ChatGPT cites an average of 15 sources per response while Gemini cites 3, and on Gemini the overlap between brands mentioned in the text and domains cited underneath can fall to 30%. ChatGPT is also selective about what makes the cut, citing only about 15% of the pages it retrieves for a given query.

    Read those two numbers together and the implication is uncomfortable. A competitor can be named in an answer built almost entirely from sources they don’t own, and your absence can be decided at a retrieval step you never see.

    The Four Citation Gaps Behind Every “Why Them and Not Us”

    Once you have prompt-level citation logs for both brands, the gaps sort into four types. Each one produces a distinct signature in the data, and each one needs a different response.

    Gap typeWhat the tracker showsWhat it actually meansFirst action
    Owned-content gapCompetitor’s own pages cited, yours absentThey have a comparison, pricing, or use-case page that answers the prompt directlyBuild the specific page the prompt asks for, not a broader guide
    Third-party citation gapCited domains are review sites, forums, or editorial, none mentioning youThe sources the model trusts have no record of your brandTarget placement in the exact domains already cited for that prompt cluster
    Narrative gapYour brand appears, but framed as niche, cheap, or secondaryThe model has signal about you, and the signal is off-positionCorrect the description at its source, then re-measure sentiment and position
    Technical gapYour pages are indexed but never retrievedStructure, access, or clarity is blocking the retrieval stepAudit crawler access and answer formatting for the failing prompts only

    A caution on the technical bucket, because it collects a lot of wasted effort. Zyppy’s citation factor analysis scored LLMs.txt at 2.0 out of 10 for influence on AI citations, with no credible evidence it moves the number. Fixing files nobody reads is a comfortable way to avoid the harder source-placement work.

    Mentioned but Never Cited Is a Different Problem Than Never Mentioned

    This distinction decides your entire remediation plan, and most dashboards blur it.

    Being mentioned means the model names your brand. Being cited means the model treats your domain as the source behind the claim. A brand can be recommended by name while the model cites a review site or a competitor’s pageinstead. That gap is diagnostic: absent from the answer entirely points to an awareness problem, while present but never sourced points to a trust problem.

    Academic work supports the split. A 2026 study analyzing 602 controlled prompts across ChatGPT, Google AI Overviews, and Perplexity treated citation and absorption as two discrete stages, not one metric.

    Benchmarks give you a rough read on severity. Category leaders rarely clear 60% AI share of voice because engines diversify sources by design, so treat anything under 15% as a structural citation gap rather than a bad month.

    Five Steps to Reverse-Engineer a Competitor’s Citation Advantage

    Here’s the workflow that turns citation logs into a queue of fixes.

    1. Define the prompt cluster, not the keyword. Pick 30 to 50 prompts a real buyer would type at the comparison stage. Commercial phrasing matters for retrieval: prompts carrying words like reviews, comparison, or a year trigger live web search in ChatGPT 53.5% of the time versus 18.7% for informational queries.

    2. Lock a competitor set of three to five. Include the brands buyers compare you against, plus any name that keeps appearing in answers even though it never showed up in your SEO reports. Those are the ones winning on sources.

    3. Log every cited URL, then classify it. Own domain, review platform, community thread, editorial, directory. The distribution is the finding. If 70% of a competitor’s citations come from community and editorial sources, no amount of on-site optimization closes that.

    4. Map your absence inside their winning sources. Not “do we have a page on this,” but “does the cited page mention us at all.” This is the step teams skip, and it’s the one that produces an actionable target list.

    5. Rank fixes by leverage, not effort. Off-site signals carry the most weight. Ahrefs’ data put branded web mentions at a 0.664 correlation with AI Overview visibility, with YouTube mentions at 0.737, the strongest single factor measured. SE Ranking’s 129,000-domain study found citation rates nearly doubling once a site crossed roughly 32,000 referring domains.

    Bottom line: earn mentions on the pages the engine already cites, before you write anything new.

    Where the Data Lies to You: Volatility, Platform Split, and Sample Size

    One run proves nothing. AI answers regenerate a different brand set on repeat queries, so a single screenshot of a competitor beating you is noise until it repeats.

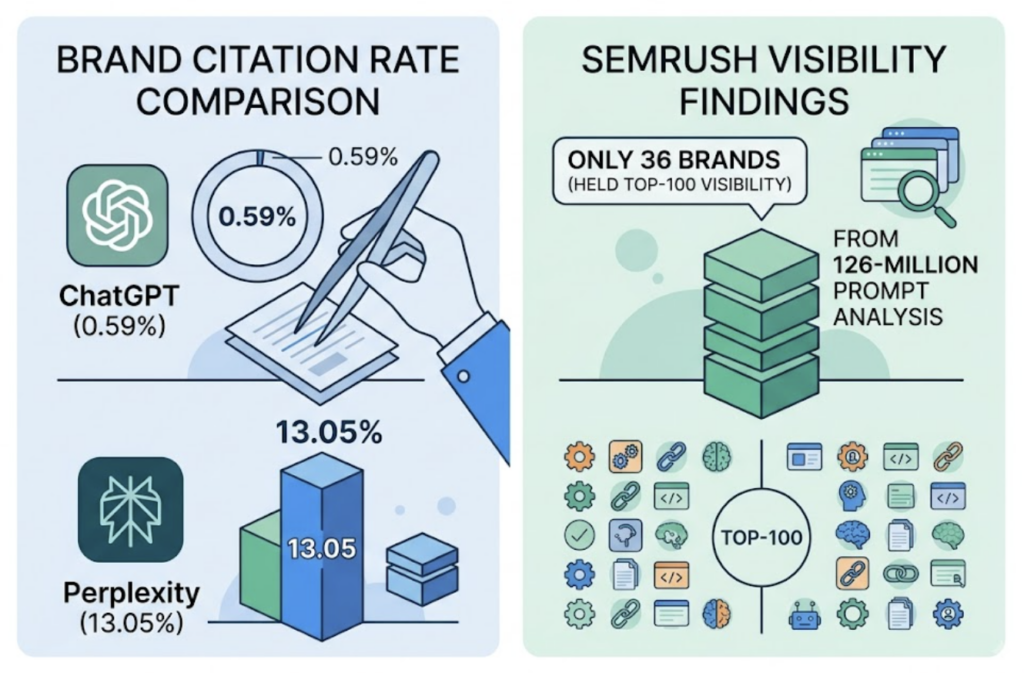
    Platform differences are larger than most teams budget for. A 2026 study of 34,234 AI responses found a 46-times spread in brand citation rates, with ChatGPT citing brands 0.59% of the time and Perplexity at 13.05%. Semrush’s 126-million-prompt analysis found only 36 brands held top-100 visibility across all four major AI platforms.

    A finding on one engine is not a finding on the others. Wikipedia strategy is a clean example: it carries meaningful citation weight inside ChatGPT and close to none inside Claude or Perplexity.

    The practical guardrail is boring. Same prompt set, same competitor set, weekly cadence, raw answers preserved so a change can be audited later. Trend lines survive volatility. Screenshots don’t.

    Turning Citation Intelligence Into an Action Plan

    Most platforms stop at reporting the gap. The work that matters starts one layer down, at the domain and URL level, and it needs to run continuously because citation patterns shift in weeks.

    Topify is built around that layer. Its Reverse-Engineer AI Citations function analyzes the exact domains and URLs AI platforms cite for your prompt set, then shows whether you or your competitors dominate those references at scale. Paired with Dynamic Competitor Benchmarking, you can see which rival is gaining position on a specific prompt cluster and trace the movement back to the sources driving it.

    The seven-metric view matters here more than the feature count. Visibility, sentiment, position, volume, mentions, intent, and CVR sit in one place, which is what lets you separate the mention problem from the citation problem without exporting three dashboards into a spreadsheet.

    Coverage spans ChatGPT, Gemini, Perplexity, DeepSeek, Doubao, Qwen, and other major engines, which matters given how little findings transfer between platforms. High-Value Prompt Discovery keeps surfacing new prompts as recommendation patterns shift, so the tracked set doesn’t go stale while you’re working the current backlog.

    Plans start at $99 per month for 100 prompts and 9,000 AI answer analyses, with a 30-day trial. You can get started on a single prompt cluster before expanding the tracked set.

    Conclusion

    The side-by-side page comparison fails because it’s the wrong unit of analysis. Your competitor’s advantage is usually sitting in a Reddit thread, a review roundup, or an editorial piece that a model trusts and that doesn’t mention you.

    Start narrow. Take the ten prompts closest to purchase in your category, log every cited URL for you and three competitors over four weeks, and classify the sources. The pattern will point at one of the four gaps, and the fix follows from the classification rather than from guesswork.

    Track it. Classify it. Then go earn the mention.

    FAQ

    Why does AI cite my competitor instead of me when my content is better? 

    Because page quality is not the primary input. With 84% of AI citations tracing to earned media, the deciding factor is usually whether the third-party sources an engine trusts mention your brand at all. A competitor with weaker content and stronger source presence will win that prompt.

    What’s the difference between mention share and citation share? 

    Mention share counts how often your brand name appears in AI answers. Citation share counts how often your domain is credited as the source. Being mentioned without being cited signals a trust gap in your content, while being absent from both signals an awareness gap. The two require different fixes.

    How many competitors should a GEO rank tracker cover? 

    Three to five direct competitors is the practical starting point for core category prompts. Add any brand that appears frequently in AI answers even if it never ranked against you in traditional search, since those are often the brands winning on third-party citations.

    How often should I run competitor citation gap analysis? 

    Weekly for measurement, monthly for action. Answers vary between runs, so single-run comparisons are unreliable. Consistent cadence on a fixed prompt set is what makes a genuine competitive shift distinguishable from normal output variance.

    Read More

  • How to Build a Prompt Set Your GEO Rank Tracker Can Trust

    How to Build a Prompt Set Your GEO Rank Tracker Can Trust

    Your visibility number dropped from 34% to 21% last week, and your manager wants an explanation. You pull the answers. Same competitors, same citations, nothing obvious changed. So you check the prompt list, and it turns out 40 of your 60 prompts came from a keyword export somebody ran in March. Most of them nobody has ever typed into ChatGPT.

    Your GEO rank tracker didn’t fail. It measured exactly what you told it to measure. The problem is that what you told it to measure isn’t your market.

    Your Prompt Set Is a Sample, Not a Checklist

    Every number a tracker reports is an estimate about a population you can’t enumerate: all the ways real buyers phrase questions in your category, across every engine, every week.

    You can’t run that population. You run a sample of it. Which means the prompt set isn’t a to-do list of terms you want to win. It’s a sampling frame, and it determines the accuracy ceiling of every metric downstream.

    That distinction has teeth right now, because the population looks nothing like a keyword list. Across Semrush’s ChatGPT prompt dataset, between 65% and 85% of prompts couldn’t be matched to any traditional search keyword. Seer Interactive found that 95% of Gemini’s fan-out queries carry zero monthly search volume by conventional metrics.

    No amount of dashboard polish fixes a bad sample.

    Three Sampling Biases a GEO Rank Tracker Can’t Correct for You

    A tracker reports what it observes. It has no way of knowing that what it observed came from a skewed frame. Three biases account for most of the damage.

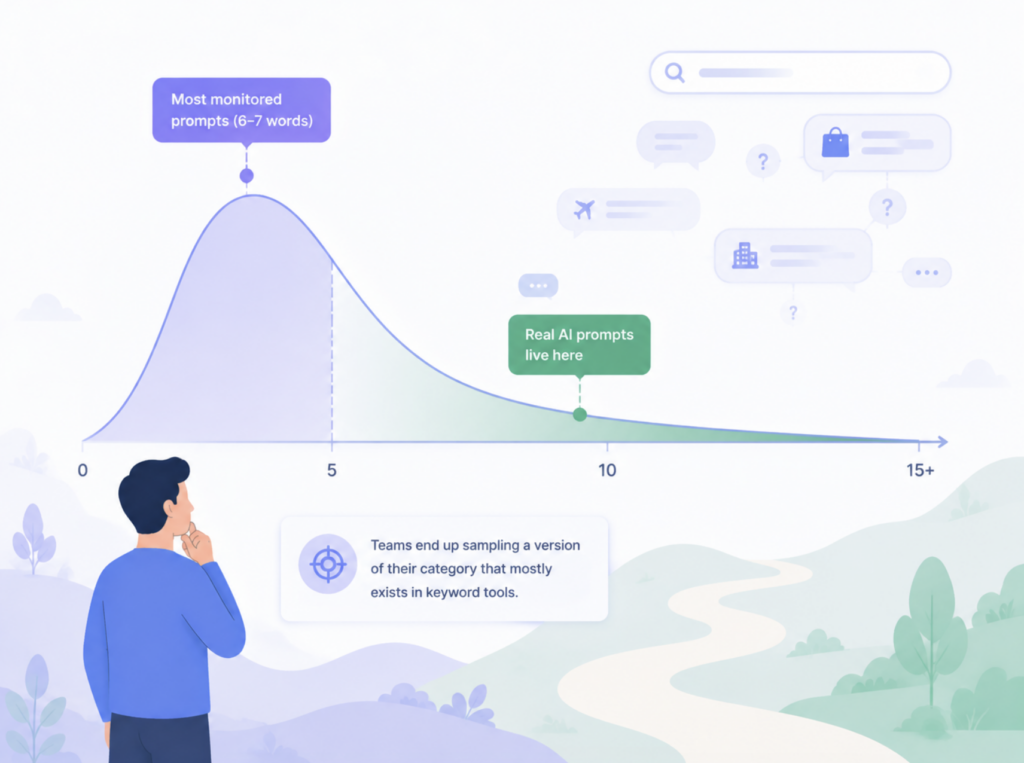
    Coverage bias toward the head. AirOps analyzed 245,000-plus prompts that brands were actively monitoring and found they peaked around 6 to 7 words, with almost nothing past 10. Real AI prompts sit much further out on the tail. Teams end up sampling a version of their category that mostly exists in keyword tools.

    Branded self-selection. Most brands perform well on their own name, so a set heavy in branded prompts reports a visibility rate that’s structurally inflated. Conductor’s guidance is to keep branded prompts at 25% or less of the total. Anything above that and you’re measuring your own recall, not your category position.

    Format skew. How a prompt is shaped changes how many brands appear at all. An analysis of 37,804 AI responses found that ranking-style prompts surfaced roughly 20% more brand mentions than open-ended ones, and concise keyword-style prompts added up to 25%. Load your set with “best X” formats and your visibility looks great. Load it with open questions and the same brand looks weak. Neither number is wrong. Both are unrepresentative.

    Stratify First: Five Layers a Representative Prompt Set Needs

    Random sampling doesn’t work here, because the strata behave differently and you need to read them separately. Stratified sampling does.

    LayerWhy it moves the numberSuggested share
    Intent stageTOFU category questions are stable; MOFU commercial queries swing hard on small wording changes25% TOFU / 45% MOFU / 30% BOFU
    Prompt formatRanking, comparison, and open-question formats return different brand counts40% question / 35% comparison or ranking / 25% keyword-style
    Persona and context“Best CRM” and “best CRM for a 12-person remote team” resolve to different brand sets3+ personas, none below 15%
    Language and marketA crossed-effects study found brand-by-language accounted for 8.6% of total variance, a measurable bilingual penaltyProportional to revenue mix, minimum 20 prompts per market
    Branded vs unbrandedBranded prompts test entity recognition; unbranded prompts test category positionBranded capped at 25%

    The point of stratifying isn’t tidiness. It’s that a stratum you didn’t define is a stratum you can’t diagnose. When visibility drops, you want to be able to say “it fell in MOFU comparison prompts in German” rather than “it fell.”

    How Many Prompts Is Enough? Run the Math Before You Run the Tracker

    Brand visibility on a single answer is a Bernoulli trial: you’re either mentioned or you’re not. That makes the sample size question answerable with a formula rather than a gut check.

    Margin of error on a proportion is z multiplied by the square root of p(1-p)/n. Assuming a realistic visibility rate around 30%, here’s what different precision targets actually cost:

    Target margin of errorConfidenceIndependent prompts needed
    ±10 pp90%~57
    ±5 pp90%~230
    ±5 pp95%~325
    ±3 pp95%~900

    Two things fall out of that table. Halving your margin of error costs four times the sample, not twice. And a 90% confidence interval is usually the right call for a marketing metric, since you’re deciding whether a topic is trending up or down, not approving a drug.

    Here’s the part most teams miss. Those numbers apply per stratum you want to read on its own. Split 100 prompts across five intent-and-format strata and each one lands at 20 prompts, which carries a margin of error near ±17 pp at 90% confidence. At that width, 25% and 40% are the same number.

    Decide your reporting granularity first. Then size the set to support it.

    Not Every Prompt Deserves an Equal Vote

    An unweighted average treats a prompt asked twice a month and a prompt asked four thousand times a month as equally important. That’s a modeling choice, and it’s almost always the wrong one.

    Weighting by demand fixes the distortion. It also introduces a new one, because prompt volume estimates are reconstructions. No vendor has access to AI platform query logs. Conductor’s critique is blunt on this: with long, context-laden prompts, exact-match volume approaches one, so keyword-level aggregation breaks down and panel-based estimates carry their own coverage gaps.

    The workable middle: use volume data to sort prompts into three demand tiers rather than to assign precise multipliers. Weight them 3, 2, and 1. Then report both the weighted and unweighted visibility rate every cycle. When those two numbers diverge sharply, you’ve learned something real about where your visibility is concentrated.

    One Query, Five Answers: Runs Are Not Prompts

    Ask the same question twice and the answer moves. The SparkToro and Gumshoe study ran 12 prompts roughly 3,000 times across ChatGPT, Claude, and Google’s AI features, and found the odds of getting the same brand list twice were under 1 in 100. Getting the same list in the same order was closer to 1 in 1,000.

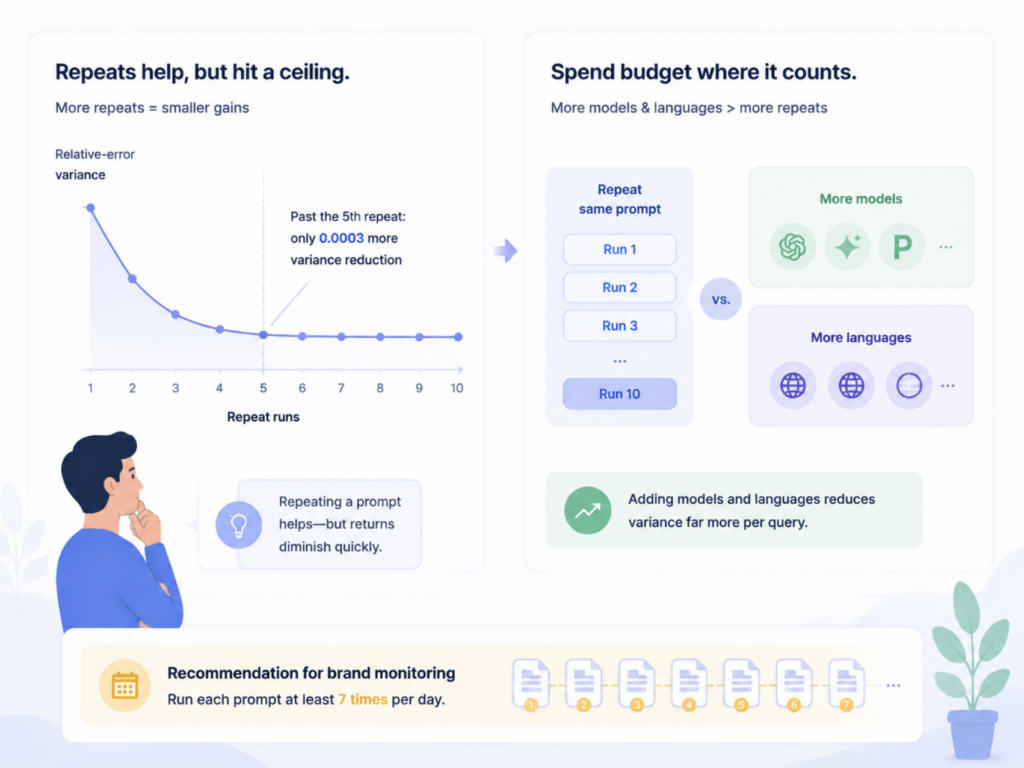
    The standard response is to repeat each prompt and average. That’s correct, and it has a sharp ceiling. A 2026 variance-components decomposition found that a repeat past the fifth reduced relative-error variance by only 0.0003, while adding models and languages reduced it far more per unit of query budget. A separate study recommends at least 7 runs per prompt per day for brand monitoring.

    So the practical allocation is: 5 to 7 runs per prompt per engine, then spend everything left on more prompts and more engines.

    The reason matters. Repeated runs shrink noise within a prompt. They do nothing for coverage. Thirty prompts run ten times produces 300 answers but still only 30 independent draws from the population of buyer questions, and your confidence interval on category visibility is governed by the 30, not the 300. Teams that report the larger number are quoting a precision they don’t have.

    One practical rule falls out of this: never call a week-over-week change real unless it clears the confidence interval you calculated in the previous section.

    Building and Validating the Set Inside a GEO Rank Tracker

    All of this assumes your tracker can do three things: find the prompts you missed, tell you which ones carry weight, and let you read strata separately.

    Coverage is the hardest of the three, because you can’t audit a blind spot from the inside. Topify approaches it through High-Value Prompt Discovery, which surfaces prompts your buyers are actually using rather than the ones your keyword export suggested, and keeps surfacing new ones as recommendation patterns shift. In practice, that’s the difference between a set you wrote from memory and a set drawn from observed demand.

    Weighting runs off AI Volume analytics, which gives you the demand tiers described above without hand-waving. Position Tracking and Competitor Benchmarking then let you read those strata as separate series, so a drop in MOFU comparison prompts shows up as a distinct signal instead of getting averaged into a flat category number. Coverage spans ChatGPT, Gemini, Perplexity, DeepSeek, Doubao, Qwen, and others, which is what makes the language and market layer measurable rather than theoretical.

    Budget math is worth checking before you commit. The Basic plan covers 100 prompts and 9,000 AI answer analyses per month, and the Pro plan covers 250 prompts and 22,500 analyses. Run 100 prompts at 5 runs across 3 engines and you spend 1,500 analyses per cycle, which leaves room for weekly cadence inside the Basic tier. At 250 prompts you can support ±5 pp overall with enough left to read three or four strata independently.

    If you’re rebuilding a set from scratch, the fastest validation is to get started with your existing prompts loaded, then compare them against discovered prompts. The gap between the two is your coverage bias, quantified.

    Prompt Sets Decay. Here’s the Refresh Cadence

    Sets go stale faster than most reporting calendars assume. The same study that recommended 7 runs per prompt also measured roughly 65% day-to-day turnover in cited sources, and found the standard error of a per-brand detection rate only dropped below 0.05 at around 24 days. A week is not an observation window. A month is the floor.

    Rebuild quarterly, not continuously. Replace 20% to 30% of the set each quarter and lock the remaining 70% as your time-series baseline. Swap everything at once and you’ve broken comparability with every prior cycle, which is a more expensive mistake than tracking a few stale prompts.

    Then keep three triggers for off-cycle refreshes: a major model release, a new competitor appearing in your answers, and any product or market launch on your side. Those change the population you’re sampling, which means the frame has to change with it. Everything else can wait for the quarter.

    Conclusion

    The prompt set is the one part of a GEO measurement system that no software can repair after the fact. Size it against a stated margin of error, stratify it so you can diagnose what moves, cap branded prompts, weight by demand tiers rather than false precision, and spend surplus budget on more prompts rather than more repeats.

    Start by auditing what you already track. Count the branded share, count the words per prompt, and calculate the margin of error on your current sample. If that last number is wider than the changes you’ve been reporting to leadership, fix the frame before you fix the strategy.

    FAQ

    Q: How many prompts should I track in a GEO rank tracker? 

    A: For an overall visibility rate at ±5 percentage points and 90% confidence, plan on roughly 230 independent prompts. If you want to read intent stages or markets as separate series, size each stratum to that target on its own. Fewer than 60 prompts gives you a pilot, not a reportable number.

    Q: What share of my prompt set should include my brand name? 

    A: 25% or less. Branded prompts test whether AI engines recognize and describe you correctly, which is worth monitoring, but they inflate overall visibility because most brands perform well on their own name.

    Q: Is it better to run more prompts or repeat the same prompts more often? 

    A: More prompts, past about 5 runs each. Repeats reduce noise within a single prompt and stop paying off quickly. Coverage across prompts, engines, and languages is what tightens your estimate of category visibility.

    Q: How often should I rebuild my prompt set? 

    A: Quarterly, replacing 20% to 30% while keeping the rest locked as a baseline. Refresh off-cycle when a major model ships, a new competitor enters your answers, or you launch into a new market.

    Read More

  • Your GEO Rank Dropped. Here’s the GEO Rank Tracker Decision Tree

    Your GEO Rank Dropped. Here’s the GEO Rank Tracker Decision Tree

    Monday morning. Your GEO rank tracker shows your brand sliding from position two to position seven in ChatGPT answers across your three highest-intent prompts. Nobody shipped anything last week. No pages were deprecated. No redirects broke.

    The default reaction is to rewrite the pages that stopped getting cited. That reaction is wrong most of the time, because a position drop in AI answers has at least four separate causes and only one of them is fixed by touching your content. Picking the wrong branch costs you a sprint, and by the time you find out, the number has moved again.

    A GEO Rank Drop Is Never Just One Problem

    Traditional rank tracking trained a reflex: position falls, so audit the page. That reflex assumes a stable index behind the result. AI answers don’t have one.

    The measurement layer itself keeps shifting. As Search Engine Journal pointed out in a breakdown of why prompt tracking needs a different approach, when OpenAI shipped a new default model, most AI citation trackers registered a collective drop. Optimization quality hadn’t changed. The number of citation links exposed in the response had.

    So the first question after a drop isn’t “what did we do wrong.” It’s “which layer moved.”

    Most teams can’t answer that, and they know it. Semrush’s 2026 AI Visibility Index, built on 126 million US AI search prompts from January through April 2026, found that 45% of marketing leaders can’t accurately measure brand visibility in AI-generated answers, and only 9% have tools covering every metric they need.

    That gap is exactly where wasted sprints come from.

    Step Zero: Prove the Drop Is Real Before You Diagnose It

    Most reported GEO rank drops aren’t drops. They’re single samples pulled from a distribution that was always noisy.

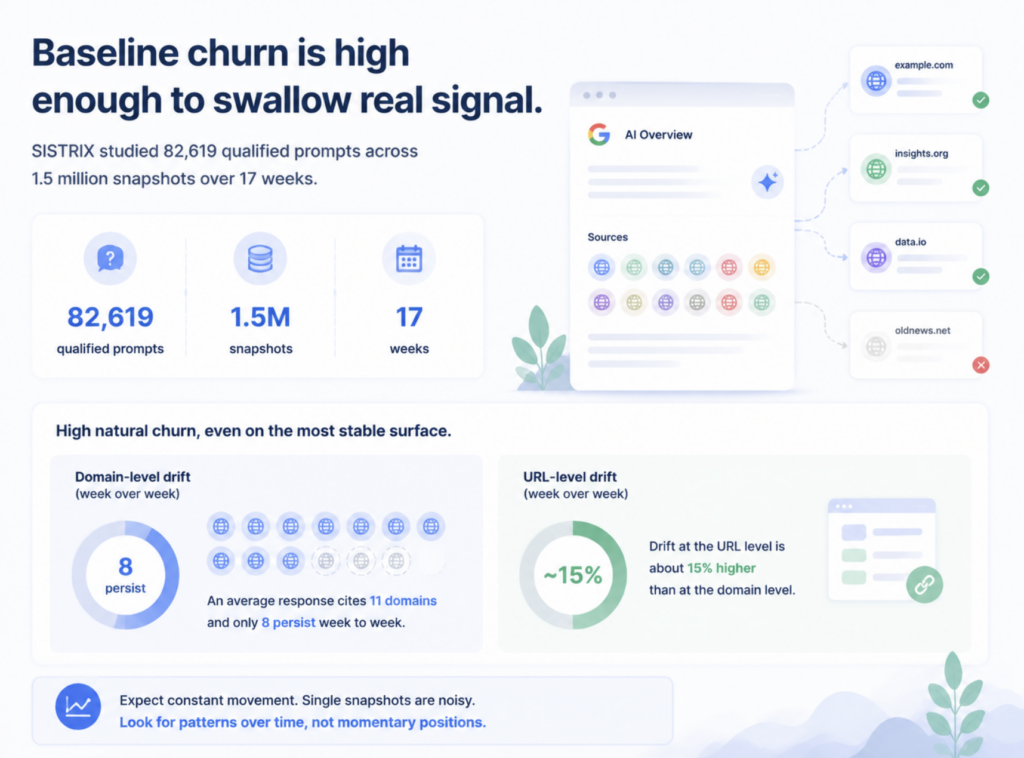
    The baseline churn is high enough to swallow real signal. SISTRIX studied 82,619 qualified prompts across 1.5 million snapshots over 17 weeks and found that even on Google AI Overviews, the most stable surface tested, an average response cites 11 domains and only 8 of those persist week to week. At the URL level, drift runs about 15% higher than at the domain level.

    Zoom out to a month and the picture gets rougher. Digital Authority Partners tracked citation persistence across five engines and measured an average 28-day citation retention rate of 33%, meaning roughly two-thirds of cited URLs get replaced inside four weeks without anyone doing anything.

    Against that baseline, a single check proves nothing.

    Three gates before you open an investigation:

    • Sampling gate. The prompt has been run enough times in the window to separate rate from roll of the dice. One run is a screenshot, not a measurement.
    • Persistence gate. The lower position holds across consecutive sampling windows, not just one refresh.
    • Scope gate. You know whether the drop is confined to one prompt, one prompt cluster, or your whole tracked set. This single distinction eliminates two of the four branches below.

    Run those gates first and a good share of your alerts close themselves.

    The GEO Rank Tracker Decision Tree: Four Branches From One Drop

    Once the drop clears the gates, it belongs to exactly one of four branches. They’re ordered by diagnostic cost, cheapest first.

    BranchWhat the data looks likeLayer you need to checkFirst move
    1. Citation lossYour position falls, the domains that used to cite you are gone from the answerCited source domains and URLs, before and afterRecover or replace the lost source
    2. Competitor gainYour citations are intact, but a rival now sits above youCompetitor position history on the same promptsAnalyze what got them cited
    3. Platform changeMany unrelated prompts move on the same day, one engine onlyCross-engine comparison on the same dateRebaseline, change nothing
    4. Framing driftYou’re still mentioned as often, but described differently and ranked lowerSentiment and descriptor tracking over timeFix the third-party narrative

    Branch 1: You Lost the Citation

    Start here because it’s the only branch with a direct, controllable fix.

    Compare the cited domain set from before and after the drop. If a review site, a forum thread, or a comparison page that used to appear in the answer is missing now, your position didn’t fall because your content weakened. Your evidence base did.

    Common causes: a listicle got updated and dropped you, a directory listing expired, a media placement fell behind a paywall, or a page you own got restructured and lost the specific passage the engine was pulling.

    The fix is source-level, not site-level. Restore that citation or earn a replacement of similar authority.

    Branch 2: A Competitor Took the Slot

    If your citations are unchanged and your position still fell, someone else moved up. AI answers rank on relative authority within a topic, so you can lose ground without losing anything.

    This branch is more common in unsettled categories than most teams expect. Semrush and Kevin Indig’s study of 1,094 US categories and more than 50,000 brands found that clear category owners held first place in 90.4% of month-over-month comparisons, while in emerging and unsettled categories the top brand switched in 1,950 out of 5,470 comparisons.

    Translation: if you own your category, a drop is probably noise. If you’re an emerging leader, a drop is probably a competitor.

    The same research also found that real topic ownership means appearing in at least four of five related prompts with a five-point lead over the runner-up. Winning one prompt isn’t ownership, and losing one prompt isn’t a crisis.

    Branch 3: The Model Changed, Not Your Content

    This is the branch that burns the most budget, because the drop looks exactly like a content failure and responds to none of the usual fixes.

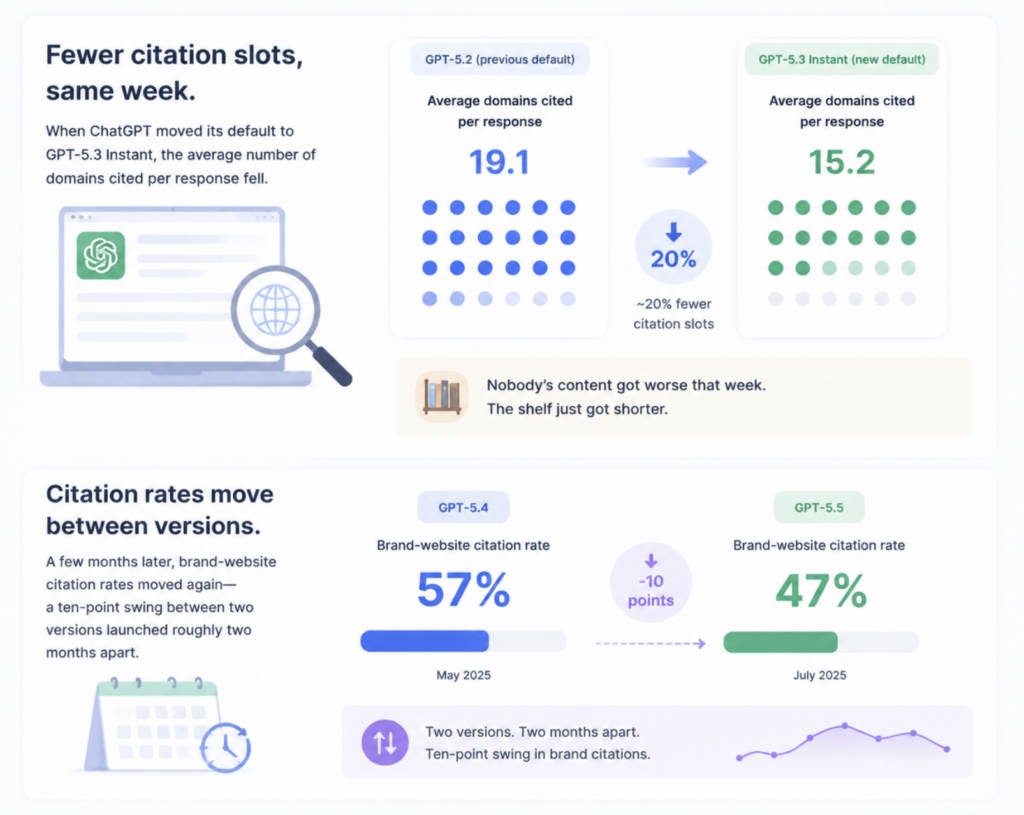
    When ChatGPT switched its default model in early March 2026, Search Engine Land tracked 400 daily prompts over 14 weeks and found the average number of unique domains cited per response fell from 19 to 15, with unique URLs sliding from 24 to 19. Roughly a fifth of the citation surface vanished across the board, and it didn’t come back.

    Every brand tracking that engine registered a decline that week. None of them had done anything.

    The tell is scope plus timing: a large share of unrelated prompts move together, on one engine, on one date, while the same prompts on other engines hold steady. That pattern is only visible if you’re tracking more than one platform, which is why single-engine monitoring produces so many false diagnoses.

    The correct response is to reset the baseline and hold the strategy. Chasing a platform-level change with a content sprint is how teams spend a quarter recovering ground that was never lost.

    Branch 4: Your Framing Drifted

    The subtlest branch. Mention frequency holds, but the answer now calls you the budget option, or the legacy option, or the tool for small teams, and the ordering shifts to match.

    Position in an AI answer follows the descriptors the model has absorbed about you. When third-party coverage starts framing you differently, ranking moves before mentions do. This is a public relations problem wearing a GEO costume, and no amount of on-page work will fix it.

    Mentions and Position Don’t Move Together

    Here’s the structural point most dashboards miss: how often AI names your brand and where it places you are governed by different inputs. They can move in opposite directions in the same week.

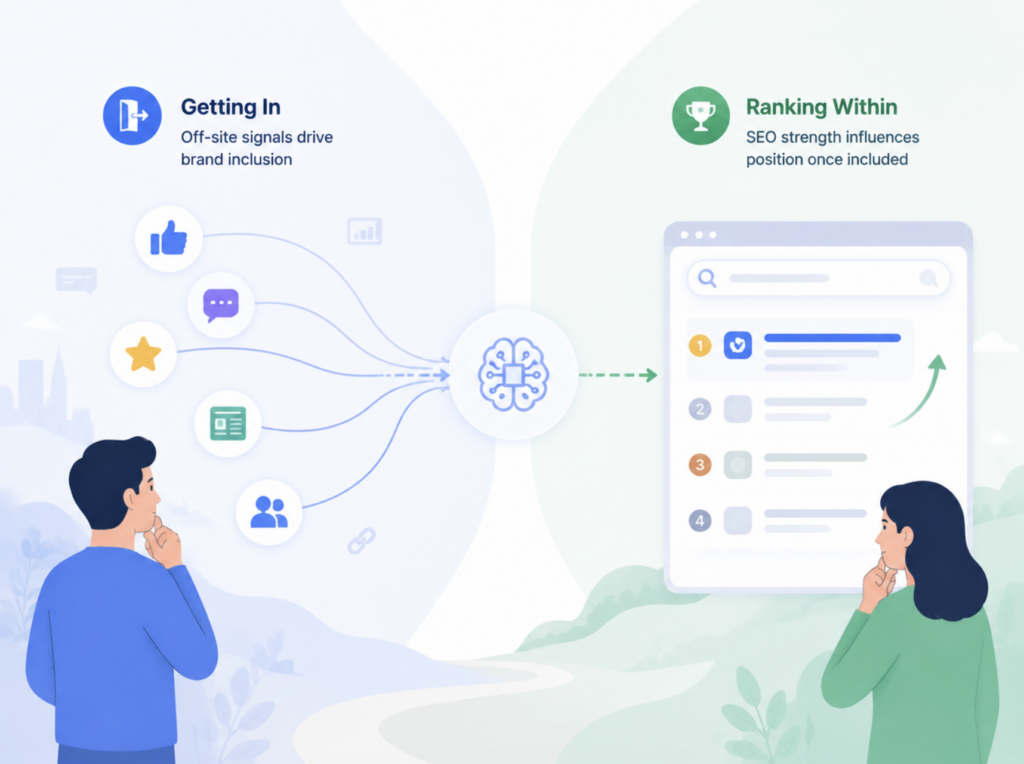
    Research on the shift from SEO to generative search keeps landing on the same separation. Conventional SEO strength tends to predict where a brand lands once it’s inside an answer, but it’s a weak predictor of whether the brand gets named at all. Off-site signals carry that part.

    Ahrefs’ analysis of 75,000 brands put numbers on it. Branded web mentions correlated with AI Overview visibility at 0.664, branded anchors at 0.527, and brand search volume at 0.392, while referring domains, the classic backlink metric, came in at 0.218. Brands in the top quartile of web mentions earned up to 10 times more AI Overview mentions than the next quartile.

    Which means a rank tracker that collapses everything into one visibility score is measuring two different systems and reporting one number.

    That’s the number that tells you something dropped and nothing about what.

    What Your GEO Rank Tracker Needs to Finish the Diagnosis

    Walking this decision tree requires five data layers. Most tools ship two or three.

    1. Prompt-level position history, not just an aggregate score, so you can separate one bad prompt from a systemic slide.
    2. Cited source domains and URLs, tracked over time, so Branch 1 becomes a lookup instead of a guess.
    3. Competitor position on the same prompts, so Branch 2 is answerable without manual re-runs.
    4. Multi-engine coverage on a shared timeline, so Branch 3 is provable by cross-reference.
    5. Sentiment and descriptor tracking, so Branch 4 shows up before it becomes a positioning problem.

    Topify was built around that structure rather than around a single score. It monitors brand performance across major AI platforms through seven metrics covering visibility, sentiment, position, volume, mentions, intent, and CVR, and its citation analysis reverse-engineers the exact domains and URLs each platform pulls from.

    In practice, that turns a Monday morning alert into a ten-minute triage. You see the position drop, open the source view, and find that a comparison page which had been citing you for months now cites two competitors instead. That’s Branch 1 with a named target, not a hypothesis.

    Engine coverage matters as much as depth, since Branch 3 can’t be ruled out from inside a single platform. Tracking spans ChatGPT, Gemini, Perplexity, DeepSeek, Doubao, Qwen, and others, so a platform-level shift is distinguishable from a brand-level one on the same chart.

    The Repair Order After a GEO Rank Drop

    Branch determines both the fix and the realistic timeline.

    BranchWhat to doWhat not to do
    Citation lossRebuild the specific lost source, or earn an equivalent third-party placementRewrite unrelated pages
    Competitor gainStudy what got the competitor cited, then contest that source setPublish more of what already isn’t working
    Platform changeReset the baseline, document the date, keep executingLaunch an emergency content sprint
    Framing driftCorrect the narrative at the source level through reviews, comparisons, and earned coverageAdd schema and hope

    Two rules worth holding across all four. Don’t optimize for one engine when your audience uses several, and don’t treat a week of data as a trend when the baseline churn is this high. If you want a working setup, start with a tracked prompt setof 30 to 50 real buyer questions, sample them on a fixed cadence, and let a full month accumulate before you call anything a drop.

    Conclusion

    A falling number in your GEO rank tracker isn’t a content problem. It’s an attribution problem, and it stays unsolvable as long as your tooling reports a single score instead of the layers underneath it.

    Run the gates first. Confirm the drop survives sampling, persistence, and scope. Then walk the four branches in order, cheapest diagnosis first, and fix only what the data points at. Teams that do this spend their sprints on the one branch that’s actually broken. Teams that don’t spend them rewriting pages that were never the reason.

    FAQ

    Q: Why did my GEO rank drop overnight when nothing changed on my site? 

    A: Overnight movement across many unrelated prompts on a single engine usually points to a platform change rather than anything on your end. Default model swaps have measurably reduced how many sources get cited per response, which lowers everyone’s numbers at once. Check whether your other tracked engines held steady on the same date before you touch anything.

    Q: How often should I check a GEO rank tracker? 

    A: Continuously for data collection, but weekly or biweekly for decisions. With roughly two-thirds of cited URLs rotating within a 28-day window, daily readings mostly capture noise. Set an alert threshold that requires the change to persist across consecutive sampling windows.

    Q: Is a GEO rank tracker different from an SEO rank tracker? 

    A: The output looks similar and the mechanics aren’t. SEO rank tracking reads a stable index where the same URLs hold the same positions for weeks. GEO rank tracking samples a probabilistic system, so position has to be measured as a rate across repeated runs, and it has to be paired with citation-source data to be diagnosable.

    Q: Can I recover a lost AI citation? 

    A: Sometimes directly, more often by substitution. If the source that cited you still exists and simply updated its content, an outreach or refresh path may work. If it’s gone, the practical route is earning a comparable third-party mention, since off-site brand mentions correlate far more strongly with AI visibility than backlinks do.

    Read More

  • Building Your Own GEO Rank Tracker: The Real Cost Breakdown

    Building Your Own GEO Rank Tracker: The Real Cost Breakdown

    You priced it out already. A hundred prompts, four AI engines, a scheduled job, and a Postgres table. The token bill came back under $150 a month, which is less than one seat on most analytics platforms, and the whole GEO rank tracker looked like a two-week sprint you could slot in between roadmap items.

    That estimate isn’t wrong. It’s just measuring the cheapest part of the system.

    The expensive parts are statistical validity, entity resolution, and the fact that what you’re measuring shifts underneath you every few weeks. Here’s the full bill, line by line, including the items that never appear on a credit card statement.

    The Napkin Math That Makes a DIY GEO Rank Tracker Look Cheap

    The estimate almost always looks the same. Take your prompt list, multiply by the number of engines, multiply by how often you want to check, then multiply by a per-call token price.

    At current rates that math genuinely is small. OpenAI’s mid-tier model runs $2 per million input tokens and $12 per million output, and a typical brand-recommendation answer is maybe 700 output tokens. That’s less than a cent per call.

    So the spreadsheet says $60 a month and the meeting ends.

    The problem isn’t the arithmetic. It’s that the arithmetic prices one question asked once, and a tracker that anyone will act on has to do something considerably harder than that.

    What a GEO Rank Tracker Has to Do Before Anyone Trusts Its Output

    Asking an AI engine a question is one function call. Turning thousands of those answers into a number a marketing lead can defend in a QBR takes six separate systems.

    Prompt set design. Which questions represent real buyer intent in your category, and how many paraphrases of each do you need? This is a research problem, not an engineering one.

    Multi-engine querying. ChatGPT and Claude have clean APIs. Google’s AI Overviews and AI Mode don’t, so you’re routing through a third-party SERP provider with its own failure modes.

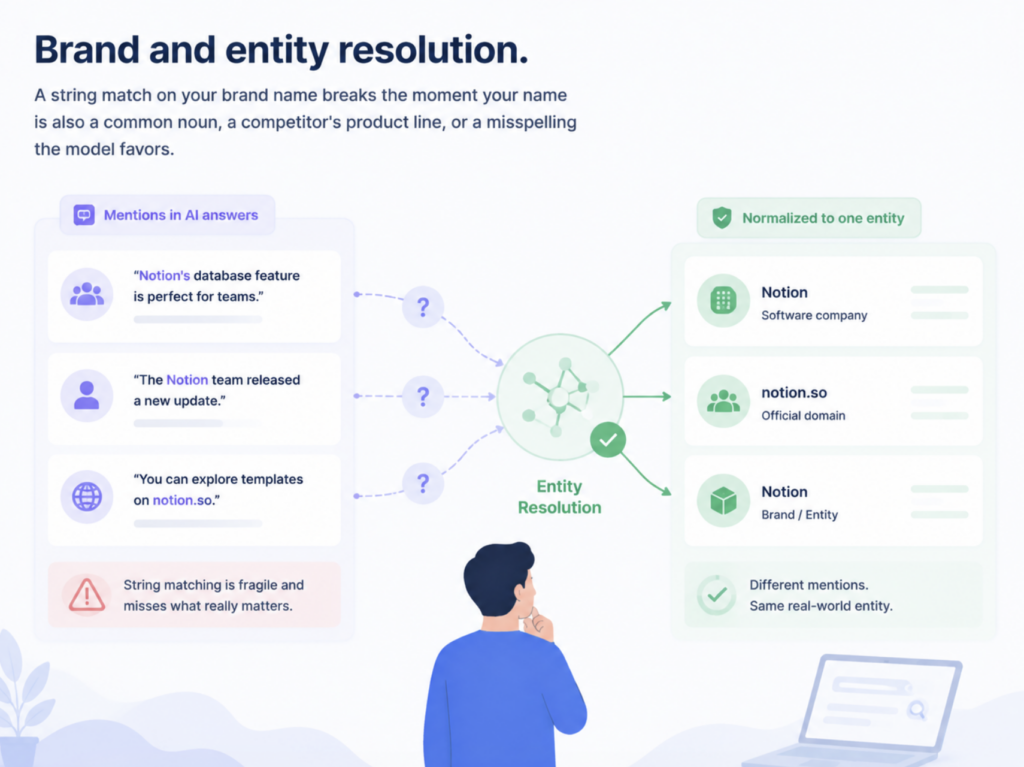
    Brand and entity resolution. A string match on your brand name breaks the moment your name is also a common noun, a competitor’s product line, or a misspelling the model favors. Mentions arrive as “Notion’s database feature,” “the Notion team,” and “notion.so” in the same answer set.

    Position and sentiment scoring. Was your brand first, third, or a footnote qualified with “though it’s pricier than alternatives”? Both need a second LLM pass, which means a second token bill and a second source of variance.

    Citation parsing. Which domains did the engine actually cite, and did any of them belong to you? This is where most homegrown trackers stop, because it requires normalizing wildly inconsistent source formats.

    Longitudinal storage. Every one of the above has to stay comparable to itself across months, or the trend line means nothing.

    Each of those is a module. Not an if-statement.

    API Costs Are the Smallest Line on the Bill

    Run the numbers at a realistic configuration and the API layer still comes in modest, but it’s meaningfully higher than the napkin version because of the surfaces you can’t reach with an LLM API alone.

    Perplexity’s Sonar bills $1 per million tokens each way plus a per-request search fee of $5 to $14 per 1,000 requests, and its standalone Search API sits at $5.00 per 1,000 requests. Google AI Overviews require a SERP vendor, where prices run from about $0.30 to $25 per 1,000 searches depending on how much structured parsing you want. The same benchmark found DataForSEO’s AI Overview endpoint around $1.20 per 1,000.

    Pick your vendor carefully, though. One head-to-head test found that three major scraping providers returned zero AI Overview data despite selling Google SERP access, which means a pipeline built on them has to be rebuilt later.

    A realistic monthly total for 100 prompts across four engines, checked weekly, lands somewhere between $55 and $125. Call it $1,000 a year.

    The Sampling Multiplier Nobody Puts in the Estimate

    Here’s where the napkin math quietly breaks. One call per prompt per engine tells you almost nothing, because AI answers aren’t stable.

    SparkToro and Gumshoe.ai ran 2,961 prompts across ChatGPT, Claude, and Google’s AI with 600 volunteers, repeating each prompt 60 to 100 times per platform. The odds of getting the same brand list twice came in under 1 in 100. The odds of getting it in the same order were closer to 1 in 1,000.

    What did hold up was frequency. The top brands in each category appeared in 55% to 77% of responses regardless of phrasing, which is why visibility percentage survives scrutiny and single-run “rank” doesn’t.

    That finding rewrites your cost model. If a defensible number needs dozens of runs rather than one, every API figure above multiplies accordingly.

    And repetition alone won’t save you. A variance-components study of non-determinism in LLM brand answers found that a sixth repeat of the same prompt reduces relative-error variance by only 0.0003, while brand-ranking reliability sits near 0.01 for a single answer and reaches only about 0.36 across a full crossed design of eight languages, three models, and fifteen paraphrases. Reliability comes from spreading across models, languages, and phrasings, not from hammering one prompt.

    Separate research on paraphrase brittleness puts a sharper edge on it: two natural paraphrases of the same buyer intent produced recommendation sets overlapping just 14% to 29%, against 50% to 61% for reruns of the identical prompt. The phrasing your tracker happens to issue becomes the dominant variable in your own metric.

    So the honest API estimate isn’t 100 prompts. It’s 100 intents times several paraphrases times several runs times four engines. That’s a 15x to 30x multiplier on the number your spreadsheet started with.

    The Line Item You Can’t Put on a Credit Card

    Even at 30x, the API bill stays under $2,000 a year. Engineering time is where the money actually goes.

    Industry cost modeling puts a blended loaded cost across engineers, PM, and UX at around $230,000 per FTE per year. A single developer typically runs $120,000 to $180,000 fully loaded once benefits and overhead are counted. A production-grade internal tool with auth, logging, error handling, and a usable interface generally takes three to six months and $150,000 to $400,000 before anyone logs in.

    A GEO tracker is narrower than that, so scale it down. Six to twelve weeks of one competent engineer, plus review time, lands in the $25,000 to $60,000 range for a v1 that produces charts you’d show a client.

    Then it never stops. The same modeling puts ongoing maintenance at 20% to 30% of the original build cost annually, and broader research finds that maintenance consumes more than half of a system’s lifecycle cost, with some platform engineering estimates putting it at 70% to 80% of lifetime cost.

    Your real recurring bill isn’t tokens. It’s an engineer, every month, forever.

    Why a Self-Built GEO Rank Tracker Drifts Out of Sync Within a Quarter

    This is the failure mode that turns a working tracker into a decorative one, and it has nothing to do with code quality.

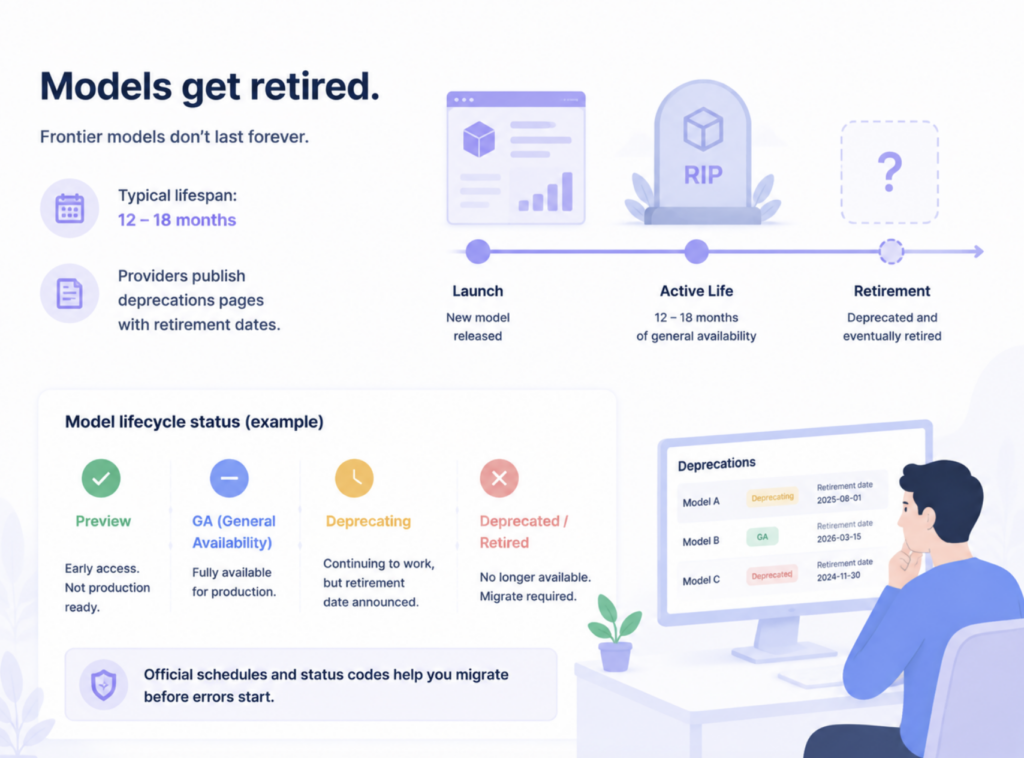
    Models get retired. Providers typically give a frontier model a lifespan of roughly 12 to 18 months before deprecating it, and every provider maintains a running deprecations page with retirement dates attached. Microsoft’s Foundry documentation goes further, publishing a formal model retirement schedule and lifecycle status codes so integrations can be migrated before they start returning errors.

    When the model under your tracker changes, your baseline changes with it. The visibility drop you see in month five might be a real competitive loss, or it might be the new model version. You have no way to tell them apart, because the only control you had was the model itself.

    Answers are also conditioned on who’s asking. A cross-provider audit of persona conditioning sampled 2,000 runs across ten personas and found that the same prompt produces materially different recommendation sets depending on the buyer context the model infers, with the effect concentrated in mid-market. If your tracker issues every query as a context-free string, it’s measuring one narrow slice of reality and reporting it as the whole picture.

    The compounding problem is that once your time series breaks, every dollar you already spent producing it loses its analytical value. You don’t get to compare Q1 to Q3.

    DIY GEO Rank Tracker vs. Managed Platform: The 12-Month Numbers

    Put the two paths side by side over a first year, using conservative figures on the build side.

    Cost lineBuild it yourselfManaged platform
    Initial engineering$25,000 to $60,000$0
    LLM and SERP API spend$700 to $2,000/yearIncluded
    Maintenance and rework20% to 30% of build cost annuallyIncluded
    Model migration workRecurring, unpredictableHandled upstream
    Engine coverageWhatever you wire up and maintainMulti-engine by default
    Metrics producedMention counts, maybe positionVisibility, sentiment, position, volume, mentions, intent, CVR
    Citation-level source dataUsually skippedBuilt in
    Historical continuityBreaks on model or vendor changeMaintained across versions
    Year-one totalRoughly $32,000 to $95,000$1,188 to $2,388

    For reference on the right-hand column, Topify prices its Basic plan at $99 a month with 100 tracked prompts and 9,000 AI answer analyses, and Pro at $199 a month with 250 prompts and 22,500 analyses. Full pricing sits on the Topify pricing page.

    The gap isn’t close. It’s roughly 15x to 40x, and the DIY column buys you fewer metrics.

    When Building Your Own GEO Rank Tracker Actually Makes Sense

    Buying isn’t automatically correct, and pretending otherwise would be dishonest. Three situations justify the build.

    You’re doing research, not marketing. If the output is a paper or an internal study rather than a monthly report, you need methodological control that no vendor will expose. Custom sampling designs, specific model versions, controlled persona variables.

    You already have the infrastructure. If your team runs data pipelines with scheduling, storage, and observability already solved, the marginal cost of one more pipeline is much lower than the numbers above suggest.

    Your entities aren’t standard. Tracking internal product codenames, regulated terminology, or a private corpus alongside public AI answers is genuinely outside what a general platform handles.

    Three signals point the other way. If nobody on the team owns the tracker as a named responsibility, it will rot. If the output has to be client-facing within a quarter, you’ll ship a prototype and present it as data. And if you can’t articulate your sampling design in one sentence, you’re not building a measurement system. You’re building a screenshot generator.

    What You’re Buying When You Skip the Build

    The thing worth paying for isn’t the dashboard. Dashboards are the easy part, and an engineer can produce a passable one in a week.

    What’s hard is consistent measurement methodology maintained across model changes, plus the historical continuity that makes any of it comparable over time. That’s the part a self-built tracker loses first and notices last.

    For teams tracking visibility across multiple engines, Topify covers the seven-metric picture in one place: visibility, sentiment, position, volume, mentions, intent, and CVR across ChatGPT, Gemini, Perplexity, DeepSeek, and other major engines. In practice, that means you can spot a mention drop in one engine and trace it to a specific source domain that stopped citing you, without joining three tables by hand.

    Two capabilities in particular tend to be the ones DIY builds never reach. Competitor benchmarking runs the same prompt set against rivals automatically, so position is measured relative to a live set rather than against your own history. And citation analysis reverse-engineers which exact domains and URLs the engines are pulling from, which is the difference between knowing your visibility fell and knowing which publication to pitch next.

    There’s also a prompt discovery layer that surfaces high-volume queries in your category as recommendations shift, which is the research problem from section two, handled as a feature rather than a quarterly manual exercise.

    You can start with Topify on a single project and validate the data against whatever spot checks you’d run manually.

    Conclusion

    Go back to that first spreadsheet. The token math was right, and it was also measuring maybe 3% of the total cost of a working GEO rank tracker. The other 97% is engineering time you can’t invoice, sampling design that determines whether your numbers mean anything, and continuity that breaks the first time a model gets deprecated.

    If you’re a research team with infrastructure and a methodology to defend, build it. If you need a number your CMO can act on next month, the honest comparison isn’t $150 a month versus $199 a month. It’s $32,000 versus $2,400, with fewer metrics on the expensive side.

    Run the 12-month table with your own loaded engineering cost before the next planning cycle. The answer usually stops being ambiguous once the FTE line is in the sheet.

    FAQ

    Q: What’s the realistic minimum monthly API cost for a DIY GEO rank tracker? 

    A: For 100 prompts across four engines checked weekly at a single run each, roughly $55 to $125 a month. Once you add the paraphrase and repetition sampling that makes the data statistically meaningful, expect that figure to multiply 15x to 30x, landing between $1,000 and $2,000 a year.

    Q: How many runs per prompt do I need before the data is reliable? 

    A: Research points to 60 to 100 runs per prompt per platform for stable visibility percentages. But repetition alone hits diminishing returns fast, and reliability improves more from varying paraphrases and models than from repeating a single prompt.

    Q: Can I just track ChatGPT and skip the rest? 

    A: You can, and it’s the cheapest path since it needs only one clean API. The tradeoff is that brand recommendation sets differ meaningfully across engines, so a single-engine tracker reports one slice of your visibility as though it were the whole number.

    Q: Can I migrate data from a self-built tracker into a platform later? 

    A: Partially. Raw answer logs usually import fine as historical reference, but computed metrics rarely reconcile, because your scoring logic and the platform’s won’t share definitions. Most teams treat the switchover as a new baseline rather than a continuous series.

    Read More

  • What a GEO Rank Tracker Can’t Tell You About AI Visibility

    What a GEO Rank Tracker Can’t Tell You About AI Visibility

    Your GEO rank tracker says you moved from position 4 to position 2 in ChatGPT last week. Nobody on your team can explain why. Nobody can explain how to hold it, either.

    Run the same prompt again tomorrow and the number may move again, with nothing on your site having changed. Most teams treat that number as a scoreboard. The research on how AI answers actually get assembled suggests it’s closer to a single frame pulled from a film that never plays the same way twice.

    What a GEO Rank Tracker Actually Measures, and What It Leaves Out

    A GEO rank tracker does one specific thing well. It sends a prompt to an AI engine, parses the brands in the response, and records where yours landed in the sequence.

    That’s a snapshot of one generation, from one prompt, on one platform, at one moment.

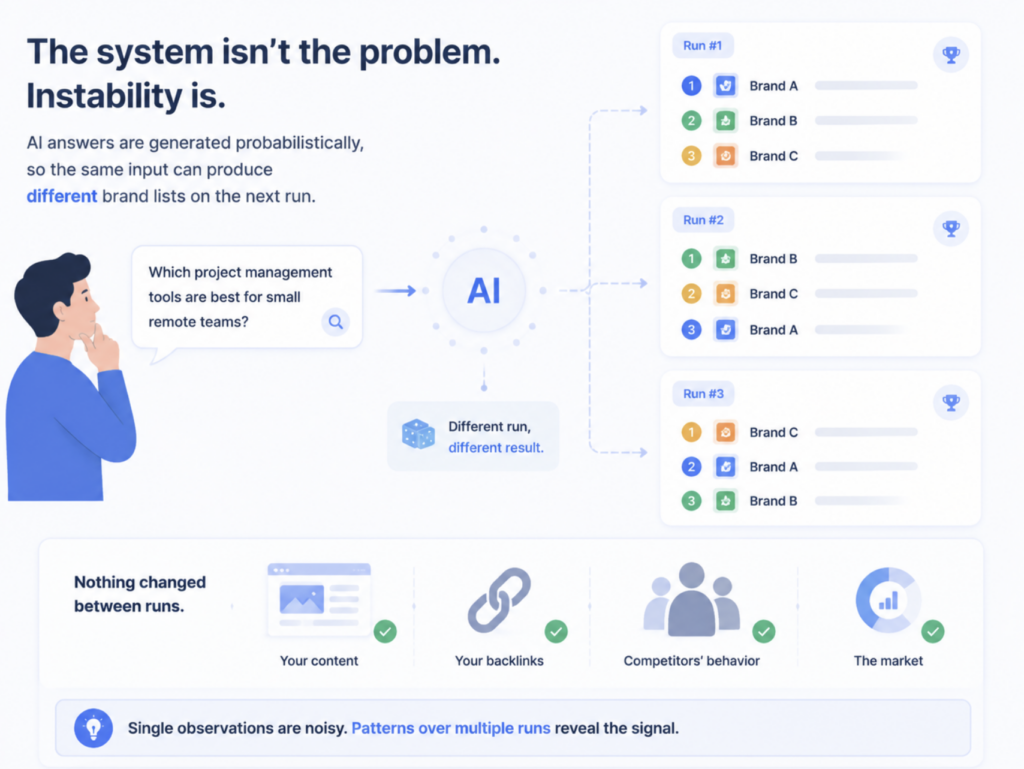
    The problem isn’t that the measurement is wrong. It’s that the underlying system isn’t stable enough for a single observation to mean much. AI answers are generated probabilistically, which means the same input can produce a different brand list on the next run without any change in your content, your backlinks, or your competitors’ behavior.

    Traditional SEO trained everyone to read a position number as a state. In AI search, position is closer to a draw from a distribution. Rank tracking still has a job to do, but the job is narrower than most dashboards imply.

    Ranking First in an AI Answer Isn’t the Same as Being Mentioned Often

    This is the gap that costs teams the most, and it’s now well documented.

    SparkToro ran what remains the largest public test of this question. Working with 600 volunteers, the team ran 12 prompts across ChatGPT, Claude, and Google AI a combined 2,961 times over two months. The result: fewer than 1 in 100 runsreturned the same list of brands for the same prompt, and roughly 1 in 1,000 returned that list in the same order.

    Rand Fishkin’s conclusion was blunt: a tool that reports your “ranking position in AI” is reporting noise.

    But the same dataset contains a second finding that gets quoted far less often. Aggregate appearance rates were considerably more stable. Across categories, the leading brands showed up in a consistent majority of runs even as their order shuffled every time.

    Position and mention frequency are two different variables, and they don’t move together.

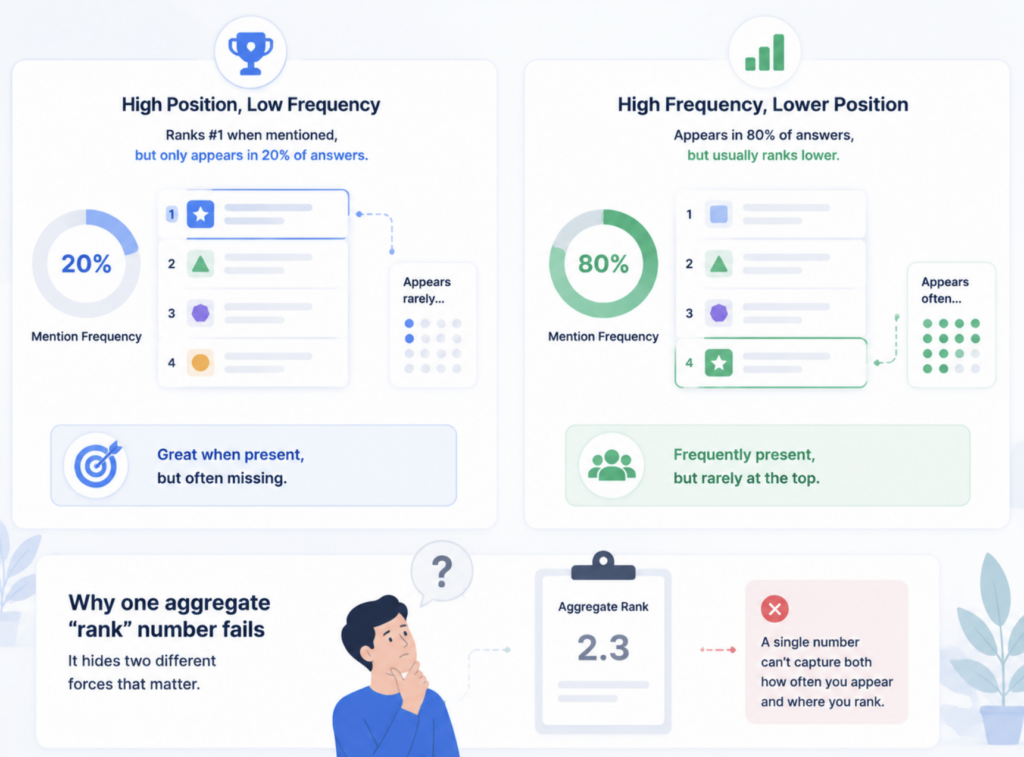
    That separation has practical consequences. A brand can hold an average position of 2.1 while appearing in only a third of responses, and a competitor can average position 4 while appearing in 80% of them. The second brand wins almost every real buying conversation. A GEO rank tracker that averages positions across the runs where you appeared will never surface that, because it only measures the runs you were already in.

    The metric that predicts commercial outcomes is how often you’re in the room, not where you sit once you’re there.

    Your GEO Rank Tracker Can’t Tell You Which Sources Built the Answer

    Position is an output. Citations are the input that produced it. Most AI search rank tracking stops at the output.

    Ahrefs compared AI Mode and AI Overviews on the same queries and found they cited the same URLs only 13.7% of the time, while still reaching semantically similar conclusions 86% of the time. Two surfaces from the same company, agreeing on the answer and disagreeing almost completely on where they found it.

    The connection between rankings and citations has also weakened fast. Only 38% of pages cited in AI Overviews still rank in Google’s top 10 for the same query, down from 76% eight months earlier.

    Then there’s where the source material lives. Research from AirOps found that 85% of brand mentions in AI responses originate from third-party pages rather than owned domains, and that brands are roughly 6.5 times more likely to be cited through external sources than through their own site.

    Read those three findings together and the implication is uncomfortable. Your position moved because a Reddit thread, a review roundup, or a comparison article entered or exited the citation pool. Your rank tracker recorded the effect. It has no visibility into the cause, which means it can’t tell you what to go fix.

    A Position Number Says Nothing About How AI Describes You

    Being cited first while being framed as the budget option is not a win. It’s a positioning failure that shows up as a green number on your dashboard.

    Sentiment and position are structurally independent. An engine can lead its answer with your brand and then attach a qualifier that removes you from consideration for the exact buyer you’re targeting. Phrases like “popular but expensive” or “powerful but complex” do more damage than an absent mention, because the reader has already accepted the framing before they reach your site.

    The durability is what makes this different from traditional reputation risk. A social post decays in days. A characterization baked into how a model describes your category can persist across millions of queries until the underlying sources change.

    A GEO rank tracker has no field for any of this. It counts the mention and moves on.

    One Prompt Isn’t a Market, and Sampled Rank Tracking Undercounts

    Every tracking tool works from a prompt list. Real users don’t.

    Semrush’s expanded 2026 AI Visibility Index analyzed 126 million U.S. AI search prompts, a jump from the 2,500 prompts in its original version. That scale gap is the whole issue in one number. A tracker sampling a few dozen prompts per day is estimating your presence across a query space several orders of magnitude larger.

    The undercount runs in one direction. If your brand happens to be strong on a long tail of conversational queries nobody put on the tracked list, the dashboard reports weakness that doesn’t exist. If your tracked prompts happen to be the ones you win, it reports strength that doesn’t generalize.

    Prompt coverage is a measurement decision that most teams make by accident, usually in the first week of setup, and then never revisit.

    Volume context matters just as much. Ranking first on a prompt nobody sends is worth nothing, and the prompts that matter shift as AI-referred traffic grows. AI referral traffic converted 42% better than non-AI traffic in Adobe’s March 2026 analysis, a reversal from converting 38% worse a year earlier. The channel is small and getting more valuable per visit, which raises the cost of pointing your tracking at the wrong queries.

    The Gap Between Knowing Your Rank and Knowing What to Change

    Here’s the practical test for any GEO rank tracker. Your position drops three spots. What does the tool tell you to do?

    For most, the honest answer is nothing. You get a number, a timestamp, and a line on a chart. The diagnosis, the source-level investigation, and the content decision all happen somewhere else, usually in a spreadsheet, usually a week later.

    That gap explains why AI visibility programs stall after the first month. The data arrives, the meeting happens, and no one can point to a specific action with a defensible expected outcome. Only a small fraction of marketing teams currently track AI search performance at all, and among those that do, the bottleneck tends to be interpretation rather than collection.

    Measurement without a causal chain isn’t analytics. It’s weather reporting.

    What Belongs Around a GEO Rank Tracker in a Complete Setup

    None of this means position should be discarded. It means position needs company.

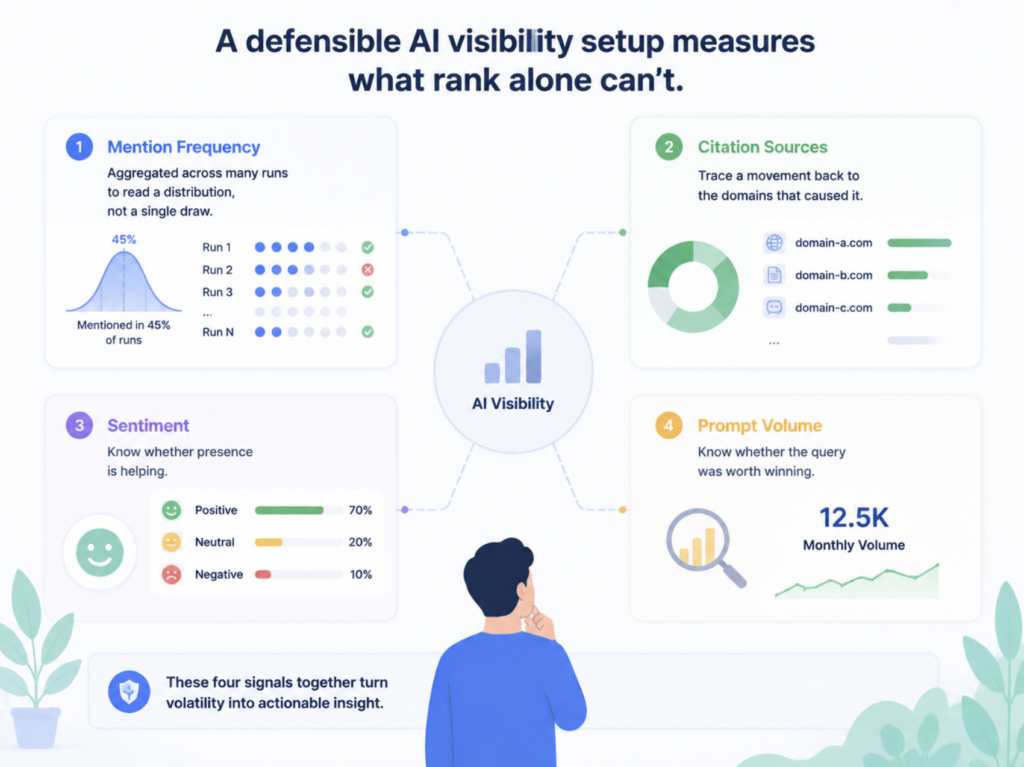
    A defensible AI visibility setup measures four things a rank tracker alone can’t reach. Mention frequency aggregated across many runs, so you’re reading a distribution rather than a draw. Citation sources, so you can trace a movement back to the domains that caused it. Sentiment, so you know whether presence is helping. And prompt volume, so you know whether the query was worth winning.

    geo rank tracker

    Topify was built around that layering. Its GEO analytics run across seven metrics, visibility, sentiment, position, volume, mentions, intent, and CVR, tracked together across ChatGPT, Gemini, Perplexity, DeepSeek, and other engines rather than reported as isolated scores.

    The part that matters operationally is the link between them. When visibility on a prompt cluster drops, the citation analysis shows which domains stopped feeding those answers and which competitor domains took the slot. Competitor benchmarking runs on the same data, so you can see whether a new entrant is pulling from sources you’ve never published on. Prompt discovery keeps the tracked list current as query patterns shift, which is where sampled rank tracking quietly goes stale.

    The output is a diagnosis rather than a score. You can start with a free visibility check before committing to a tracked prompt set, which is usually the fastest way to find out how far your current numbers are from the aggregate picture.

    Conclusion

    A GEO rank tracker answers one question: where did my brand land in this response. That question mattered enormously in an ordered-list era. In generative search, where fewer than 1 in 100 identical prompts return an identical brand list, single-run position is the least stable thing you can measure.

    The metrics that survive the noise are the aggregate ones. How often you appear across many runs. Which sources put you there. How you’re described when you arrive. Whether anyone is asking the question at all.

    If your current reporting can’t answer those four, the position number isn’t telling you much, no matter which direction it’s moving. Start by auditing your prompt list against how your buyers actually phrase things, then add the citation layer underneath it.

    FAQ

    Q: What does a GEO rank tracker actually measure? 

    A: It sends a prompt to an AI engine, identifies the brands in the response, and records the order they appear in. That gives you a position for one generation of one prompt on one platform. It doesn’t measure how often you appear across repeated runs, which sources produced the answer, or how the engine characterized you.

    Q: Is AI search rank tracking useless then? 

    A: Not useless, but narrower than it looks. Single-run position is noisy enough that it shouldn’t drive decisions on its own. Position tracked across many runs and read alongside mention frequency is still useful for spotting directional change. The failure mode is treating one snapshot as a trend line.

    Q: How is a GEO rank tracker different from an SEO rank tracker? 

    A: An SEO rank tracker measures a deterministic system. Query the same keyword twice and you’ll get close to the same result. AI engines generate answers probabilistically, so identical prompts return different brand lists and different orderings. The measurement method carried over from SEO, but the underlying stability didn’t.

    Q: How do I track brand mentions in ChatGPT answers reliably? 

    A: Run each tracked prompt many times rather than once, aggregate the appearance rate across those runs, and treat that percentage as your primary metric instead of average position. Then pair it with citation data so you can trace changes back to specific source domains. Platforms that handle repeated sampling and citation attribution together will get you there faster than manual spot checks.

    Read More

  • Most GEO Rank Trackers Are Measuring the Wrong Thing

    Most GEO Rank Trackers Are Measuring the Wrong Thing

    Two GEO rank trackers, same brand, same week. One says you’re second in your category. The other says fourth. Neither number matches what happens when you open ChatGPT and ask the question yourself five times, where your brand shows up twice and gets skipped three times.

    The dashboards aren’t broken. They’re reporting a metric borrowed from SERP tracking and applied to a system that doesn’t behave like a SERP. Before you argue about which tool is more accurate, it’s worth asking what “rank” is supposed to mean here in the first place.

    What Your GEO Rank Tracker Means When It Says “Rank 3”

    Open three GEO rank tracking products and you’ll find at least three definitions of the same word.

    Some tools count the order your brand appears in the answer text. Others average your position across a prompt set and report a weighted score. A third group ranks the citation panel, meaning your “rank” is really the position of a URL in a source list that most readers never open.

    These produce different numbers from the same underlying answer. That’s not a rounding problem. It’s a definitional one, and it means cross-tool comparison is meaningless until you know which layer each vendor is counting.

    Here’s the thing: none of those three definitions tells you the number your CMO actually asked for, which is how often the brand appears at all.

    The Ranking and Mention Gap Most GEO Rank Trackers Never Show

    Position and mention frequency are separate phenomena. A brand can rank first every time it appears and still appear in only a fifth of relevant answers. Another can appear in most answers and land consistently in fourth place. One aggregate “rank” number flattens both into something that describes neither.

    Onely documented a law firm holding the top Google position for a competitive local query while receiving zero ChatGPT mentions. Traditional ranking authority was intact. Presence in the answer was zero.

    The retrieval data explains why. Ahrefs ran 15,000 long-tail queries through Google and Bing, then asked the same questions to four AI assistants, and found that on average only 12% of links cited by ChatGPT, Gemini, and Copilot appear in Google’s top 10 for the same prompt. Perplexity was the outlier at roughly one in three.

    Short-tail queries don’t close the gap either. In a separate Ahrefs study of about 3,000 short-tail terms, ChatGPT’s URL overlap with Google’s top 10 sat at 10%, while Perplexity hit 65%.

    Rank tells you how you’re described once you’re in the answer. Mention rate tells you whether you’re in the room.

    Both matter, and they move independently. Conflating them is the single most common measurement error in AI search rank tracking today.

    AI Answers Don’t Have a Position One. They Have a Sentence Order.

    A SERP position is discrete, stable, and reproducible. Ask Google the same thing twice and you get the same ten results. Ask an AI assistant the same thing twice and the brand order can change without anything about your brand changing.

    This isn’t a minor caveat. A 2026 variance-components study of non-determinism in LLM brand answers found that brand-ranking reliability sits near 0.01 for a single answer, rising to only about 0.36 across a fully crossed design spanning repeats, paraphrases, models, and languages.

    Read that again. A single-sample rank number carries almost no signal.

    The same paper found that pure within-prompt resampling accounts for 34.8% of total variance, and that adding a sixth repeat of the same prompt reduces relative-error variance by roughly 0.0003. Sampling more languages and more models buys reliability. Hammering the same prompt does not.

    Most GEO rank trackers don’t disclose their sampling design at all. No repeat count, no paraphrase set, no model coverage. You’re handed a decimal point with no confidence interval attached, and then asked to make budget decisions with it.

    There’s a related credibility problem worth naming. A practitioner discussion cited in Onely’s analysis argues that a large share of GEO trackers run on scraper plus API pipelines rather than the consumer product itself, producing results that diverge meaningfully from what real users see. Whether that estimate holds across every vendor, the underlying question stands: ask your provider what exactly they’re querying.

    Four Blind Spots in Most GEO Rank Tracking Setups

    Blind Spot 1: Single-Platform Coverage

    Plenty of tools still report a rank that means “your position in ChatGPT.” As of May 2026, ChatGPT held 53.9% of worldwide AI assistant web visits, with Gemini at 27.9% and Claude at 9.2%. Roughly half your audience is being asked about by engines your tracker never touches.

    Blind Spot 2: Keyword Input Instead of Prompt Input

    A keyword is a lookup. A prompt is a request with intent, constraints, and phrasing baked in. Tools that convert keywords into synthetic prompts are measuring a query nobody typed.

    Blind Spot 3: No Sentiment Layer on the Position

    Appearing third with a strong recommendation beats appearing first as a hedged alternative. Gartner projects that 30% of brand perception will be shaped by generative AI, which makes the framing of a mention a reputation metric, not a nice-to-have.

    Blind Spot 4: No Citation Attribution Behind the Rank

    A rank change without a source explanation isn’t actionable. Citation concentration is severe: an analysis of 1,000 AI Overviews found the top 1% of cited domains capture 47% of all citations. When your position drops, the cause usually lives in that source layer.

    What the tracker showsWhat’s actually happeningDecision risk
    “Rank 2 in ChatGPT”One engine, one sample, unknown repeat countOptimizing for a number with near-zero reliability
    “Visibility score 68”Composite of mention rate and position, undisclosed weightsCan’t tell whether to fix presence or framing
    “Rank improved 3 spots”Sentence order shifted, mention rate flatReporting a win that didn’t change reach
    “Cited in 12 answers”No sentiment attachedMissing negative or hedged framing entirely

    What a GEO Rank Tracker Should Measure Instead

    Five layers, aligned to the same prompt set, sampled on a disclosed schedule. Anything less and you’re guessing.

    LayerThe question it answersWhat breaks without it
    Mention rateDo we appear at all, and in what share of runs?Position looks fine while reach collapses
    PositionWhen we appear, where in the answer?Can’t tell a recommendation from a footnote
    SentimentHow are we framed relative to competitors?High visibility, low persuasion, no explanation
    Citation sourceWhich domains fed this answer?Every change is unattributable
    Prompt volumeHow many people actually ask this?Optimizing for prompts nobody uses

    The alignment matters as much as the metrics. Five numbers pulled from five different prompt sets can’t be cross-referenced, which is exactly why so many teams end up with a full dashboard and no diagnosis.

    One more design point from the variance research: reliability comes from spreading samples across models and languages, not from repeating one prompt. Any GEO rank tracker that scales cost by repeat count instead of coverage has its incentives pointed the wrong way.

    Reading a GEO Rank Tracker That Reports Both Layers

    The practical requirement is simple to state and harder to buy. You need mention rate and position reported side by side, on the same prompts, across the engines your buyers actually use, with the citation trail attached.

    Topify was built around that separation. Its analytics layer tracks seven metrics in parallel, including visibility, position, mentions, sentiment, volume, intent, and CVR, so a drop in one is legible against the others rather than averaged into a single score.

    In practice that changes the workflow. You notice mention rate falling in Gemini while position holds steady in ChatGPT, open the citation view to see which domains stopped referencing your brand, and check whether a competitor picked up those same sources. Presence problem, framing problem, and source problem are three different fixes, and the platform is structured so you can tell which one you have. Coverage spans ChatGPT, Gemini, Perplexity, DeepSeek, Doubao, Qwen, and others, which matters for teams whose audience isn’t concentrated in a single English-language engine.

    Sampling depth is a budget line, not a feature toggle. The entry plan runs $99 per month with 100 tracked prompts and 9,000 AI answer analyses, which is roughly what a statistically meaningful design costs once you stop taking single samples seriously.

    Audit Your Current GEO Rank Tracker in One Afternoon

    You don’t need a new vendor to find out whether your current numbers hold up.

    Step one. Pick 10 prompts that reflect real buying questions in your category. Category prompts, comparison prompts, and alternative prompts, not keywords.

    Step two. Run each one three times in the consumer app, not the API, across at least two engines. Log two things per run: did your brand appear, and in what order.

    Step three. Calculate mention rate as appearances divided by total runs. Calculate mean position using appearances only. You now have the two numbers separated.

    Step four. Compare against your tracker’s reported figure for the same week. A gap under 10 percentage points on mention rate is tolerable. Anything past 20 means the tool is modeling a version of the answer your customers don’t see.

    Step five. Ask your vendor three questions: how many samples per prompt, which engines and interfaces, and whether the reported rank counts answer text or the citation panel. Vendors who can’t answer plainly are telling you something.

    If you’d rather run the comparison against a platform that separates the layers by default, you can start a project in Topifyand point it at the same 10 prompts.

    Conclusion

    The disagreement between your two dashboards isn’t a data quality issue. It’s a category error. Rank was designed for a medium with fixed positions, and AI answers don’t have those. Until your GEO rank tracker reports mention rate and position as separate lines, on disclosed sampling, across the engines your buyers use, you’re optimizing against a number that can move for reasons that have nothing to do with your brand.

    Start by splitting the two metrics in your own reporting this month. The diagnosis usually becomes obvious once they stop being averaged together.

    FAQ

    Q: What’s the difference between a GEO rank tracker and a traditional SEO rank tracker? 

    A: An SEO rank tracker reports a fixed, reproducible position in a result list. A GEO rank tracker samples probabilistic answers, so its output is a statistical estimate rather than a lookup. The methodological consequence is that sampling design determines accuracy, which is why disclosed repeat counts and engine coverage matter more than dashboard polish.

    Q: How often do AI search rankings actually change? 

    A: Frequently enough that a single sample is unreliable. Variance research places brand-ranking reliability near 0.01 for one answer, meaning order can shift between two runs of the identical prompt with no change to your brand. Weekly sampling captures volatility; monthly aggregation gives a more stable directional read.

    Q: How many prompts do I need before the numbers mean something? 

    A: Most practical setups start at 15 to 30 prompts covering category, comparison, alternative, and use-case intents, sampled multiple times across at least two engines. Coverage across engines and phrasings buys more reliability per dollar than repeating a single prompt.

    Q: My brand ranks first but gets mentioned rarely. What should I fix? 

    A: That’s a presence problem, not a positioning one, and it usually traces to the source layer. Off-site coverage drives the majority of early-stage brand mentions, so the fix tends to be earning references in the listicles, comparison pages, and review roundups that AI engines retrieve from, rather than editing your own product pages.

    Read More

  • What a GEO Rank Tracker Shows When the Model Updates

    What a GEO Rank Tracker Shows When the Model Updates

    Your brand held position two in ChatGPT’s answer for six weeks straight. Then on a Monday it showed up at position six. Nothing on your side had changed: no content edits, no lost backlinks, no competitor campaign. The obvious next move is to start fixing something.

    That’s usually the wrong move. The thing that changed probably wasn’t your site. It was the model underneath the answer. And most GEO rank tracker setups can’t tell those two cases apart, because they report where you stand today instead of what happened across the last sixty days.

    Your GEO Rank Didn’t Drop. The Model Changed Its Mind.

    Three forces move a brand’s position inside an AI answer: your content, your competitors’ content, and the model’s own retrieval and ranking behavior. The first two move slowly. The third moves overnight.

    And “overnight” is now the normal case. Major labs ship a flagship model every 6 to 12 months with point upgrades every few weeks in between, and public trackers log a notable release every few days once open-weight models are counted. OpenAI alone replaced GPT-5.2 with GPT-5.4 on March 5, 2026, then shipped GPT-5.5 seven weeks later.

    Each swap can rewrite how the model retrieves.

    When ChatGPT moved its default to GPT-5.3 Instant, the average number of domains cited per response fell from 19.1 to 15.2, roughly a 20% cut in citation slots. Nobody’s content got worse that week. The shelf just got shorter. A few months later, brand-website citation rates moved again, from about 57% on GPT-5.4 to about 47% on GPT-5.5, a ten-point swing between two versions launched roughly two months apart.

    Here’s the part that costs teams money. If you reallocated budget toward brand-domain optimization after the first shift, the second shift partially walked it back. A model change is a measurement change before it’s a performance change, and teams that miss that distinction spend a quarter fixing a problem that never existed.

    What a GEO Rank Tracker Measures That a Single Check Can’t

    Most people treat “GEO rank” as one number. It’s at least three, and they don’t move together during a model transition.

    LayerWhat it answersTypical behavior during a model update
    PositionWhere does your brand sit in the recommendation order?Moves first and moves loudest. Highest noise, lowest signal in isolation.
    Mention rateHow often does your brand appear at all across a prompt set?Moves slower. A real drop here is the one worth acting on.
    Citation sourceWhich domains does the model pull from to justify the answer?Often moves before the other two. The best early indicator.

    Position is the metric everyone screenshots and the one least worth reading alone. AI answers are non-deterministic by design: roughly 70% of content changes between repeated runs of the same query, and only about 30% of brands stay visible in back-to-back responses. Against that baseline, a two-place move on a single check tells you almost nothing.

    The citation layer is where model updates show their hand earliest. If the mix of domains behind your category’s answers shifts from vendor sites toward community and editorial sources, the retrieval policy changed. Your rank is downstream of that, and no amount of on-page work will reverse it.

    The 60-Day Curve: How Long Model Update Volatility Actually Lasts

    A useful longitudinal window has three parts: 14 days of pre-update baseline, the transition itself, and 30 to 60 days of post-update observation.

    The pre-update baseline is the part teams skip, and it’s the part that makes everything else interpretable. Without it you have no noise floor, which means you have no way to say whether a six-point move is a real event or a normal Tuesday.

    After a transition, the pattern usually looks like a spike in variance followed by a new plateau. Where the plateau lands is the actual finding. Some brands return close to their old position within a few weeks, and practitioners tracking through transitions generally report partial recovery in the 4 to 8 week range when the cause is model behavior rather than competitive displacement.

    Some brands don’t come back. That’s the case worth catching early, because it means the new retrieval policy structurally deprioritized the kind of source your visibility was built on. Waiting for it to “settle” wastes the window when a content correction still compounds.

    The distinction between those two outcomes only exists in time-series data. A snapshot shows you the same number in both scenarios.

    Rank Moves, Mentions Don’t. Most Dashboards Only Watch One.

    This is the finding most GEO rank tracking misses, and it holds at scale.

    Semrush’s 2026 AI Visibility Index analyzed 126 million U.S. AI search prompts from January through April 2026 and found that being mentioned and being cited are separate outcomes. On Gemini, the overlap between mentioned brands and cited domains can run as low as 30%. You can be the brand the model names and not the source it trusts, or the source it trusts and not the brand it names.

    Recent academic work on the SEO-to-GEO transition points the same direction: traditional search metrics tend to predict where a brand lands within an AI answer, but they’re weak predictors of how often the brand gets mentioned at all. Ranking and mention frequency behave like two independent curves.

    Which means a dashboard that only plots position can show a clean recovery while your mention rate keeps sliding.

    It also explains why measurement gaps are so common. The same Semrush research found 45% of marketing leaders can’t accurately measure their brand’s presence in AI answers, and only 9% have tooling that covers the full metric set across platforms.

    Three Signals That Tell You It’s the Model, Not Your Content

    Before you change a single page, run these three checks. They take an afternoon and they’ll save you a quarter.

    Signal 1: Your competitors moved too. Pull position data for the top five brands in your category over the same window. If four of five shifted in the same direction on the same date, you’re looking at a category-wide re-ranking, not a brand-specific problem. Nothing you publish will unwind it.

    Signal 2: The source mix changed shape. Compare the domain types cited before and after. A swing from first-party vendor pages toward community platforms, review sites, or news is a retrieval policy change. Your fix is third-party presence, not more on-domain content.

    Signal 3: Sentiment held while position fell. If the model still describes your brand in the same terms but ranks it lower, its evaluation of you didn’t change. Its ordering logic did. That’s a model event, and the response is patience plus source diversification, not a rewrite.

    If all three point the same way, log the date as a model event and hold your content roadmap. If none of them do, the problem is yours and it’s fixable.

    How to Run Your Own Longitudinal GEO Rank Study

    Five steps. The discipline matters more than the tooling.

    1. Lock a prompt set of 30 to 60 buyer-intent queries. Fewer than 25 and single-prompt noise dominates the trend. Cover definitions, comparisons, alternatives, and purchase-decision phrasings, not just your brand name.

    2. Prioritize repeated runs over a bigger list. Because variance lives at the run level, a 50-prompt set run 10 times tells you more about stability than a 500-prompt set run once. Weekly cadence at minimum. Daily during a known transition.

    3. Freeze the set for the full cycle. Adding or dropping prompts mid-comparison changes what you’re measuring and quietly invalidates the trend. Version the library and date every change.

    4. Annotate model release dates on the timeline. This is the step that turns a chart into an explanation. Without event markers you have a squiggle. With them you have attribution.

    5. Refuse to act on a delta that doesn’t clear the noise floor. Most week-over-week movement in AI visibility reporting is variance being narrated as strategy. Set a threshold before you look at the data, not after.

    One caveat worth stating plainly. Even published research runs into this: a 2026 multi-industry study of brand ownership in AI recommendations covering 3,750 responses across 50 brands and 3 models flagged its own single-point-in-time design as the main limitation, noting that only longitudinal tracking would show how recommendation patterns evolve as models update. If a research team with 250 controlled queries hits that wall, a monthly dashboard check definitely does.

    Where a GEO Rank Tracker Earns Its Keep

    Everything above is doable by hand. It just doesn’t survive contact with a real workload, because the three things that make it work are continuous sampling, cross-platform synchronization, and event annotation. Miss any one and the attribution breaks.

    That’s the gap Topify was built to close. Its GEO analytics layer tracks seven metrics on the same timeline, including visibility, position, mentions, sentiment, and CVR, so you can see whether a position drop came with a mention drop or without one. That single comparison resolves most model-update false alarms in about a minute.

    Two other pieces matter during transitions. Competitor benchmarking runs against the same prompt set on the same schedule, which gives you Signal 1 without assembling it manually. And citation analysis reverse-engineers the exact domains and URLs the platforms are pulling from, which is where a retrieval policy change becomes visible before your rank reacts.

    Coverage spans ChatGPT, Gemini, Perplexity, DeepSeek, Doubao, Qwen, and others. That breadth is what keeps a single platform’s release schedule from being mistaken for a global trend. Plans start at $99/mo, and you can set up a tracked prompt set and start building baseline data in an afternoon.

    Build the baseline before the next release, not after it.

    Conclusion

    Model updates aren’t an edge case in GEO. They’re the background condition, arriving faster than most reporting cycles can absorb. A brand that reads every position change as a content problem will spend its budget chasing phantoms, and a brand that dismisses every change as noise will miss the one drop that was structural.

    The difference between those two failures isn’t a better metric. It’s a longer window. Set a 14-day baseline, freeze your prompt set, mark the release dates, and separate mention rate from position before you touch anything. Do that once, and the next model swap becomes an event you can explain instead of a fire you have to fight.

    FAQ

    Q: Does a model update reset my GEO rank? 

    A: Not usually a full reset, but it can reorder recommendations within days. What actually changes is retrieval behavior: which sources the model trusts and how many it cites. Position follows from that, which is why the citation layer is the better early indicator.

    Q: How often should a GEO rank tracker re-measure? 

    A: Weekly is the floor for stable trend data. Move to daily for the two weeks surrounding a known model release, since that’s when variance peaks and when the recovery curve is actually readable.

    Q: My rank dropped after a model update. Should I change my content now? 

    A: Run the three signals first. If competitors moved with you and the source mix shifted, hold your roadmap and wait 4 to 8 weeks. If your mention rate dropped while competitors held steady, that’s a content and authority problem worth acting on immediately.

    Q: Can free tools handle longitudinal GEO rank tracking? 

    A: Free checkers give you a useful snapshot of where you stand today. Longitudinal work needs a frozen prompt set, repeated runs, and stored history across platforms, which is where a dedicated tracker becomes the practical option.

    Read More

  • 90 Days of GEO Rank Tracker Data: What Actually Moved the Needle

    90 Days of GEO Rank Tracker Data: What Actually Moved the Needle

    Your GEO rank tracker showed your brand at an average position of 4.1 in March and 3.6 in May. Your VP asks what you did to earn that. You scroll back through the changelog: a pricing page rewrite, two comparison posts, a schema fix, one podcast appearance. Any of them could explain it. None of them explains it alone.

    The uncomfortable part is that a chunk of that movement probably wasn’t yours. On the platforms most buyers use, recommendation lists reshuffle on their own every few days, which means a lot of what shows up in a rank chart is the platform breathing, not your work landing.

    Rank Movement in a GEO Rank Tracker Is Mostly the Platform Breathing

    The largest public 90-day panel on this question ran 1,247 buyer-intent prompts every single day across eight AI platforms, producing 897,840 answers between March and May 2026. Across that set, 17% of prompts returned a different set of recommended brands than they had the day before, and the median brand list survived unchanged for just five days.

    Over the full 90 days, the top-recommended brand flipped at least once for 65% of prompts.

    Stability varies by almost 3x depending on which platform your GEO rank tracker is pointed at.

    PlatformDaily brand-set churnMedian unchanged streak#1 brand flipped in 90 days
    Perplexity27%3 days84%
    Google AI Mode23%4 days78%
    ChatGPT18%5 days69%
    Google AI Overviews13%7 days58%
    Gemini11%9 days49%
    Claude9%11 days41%

    Not all of that is real movement. When the same prompts were re-run ten times inside a single hour, ChatGPT came back with a different brand set in only 7% of pairs. Roughly a third of the day-over-day churn is sampling noise. The rest is the platform genuinely changing its mind.

    Academic work points the same direction. A daily tracking study across four AI engines and four verticals found that visibility has to be treated as a probability across repeated runs rather than a fixed value, with brand sets overlapping only 45% to 59% between runs of an identical prompt.

    Two caveats before you build a quarterly plan on these numbers. The panel skews US, English-language, and B2B software, and it runs clean sessions with no personalization or chat history. Your buyers carry both, which adds variance on top.

    Three Signals That Moved GEO Rank, and Two That Didn’t

    Once you strip out the noise, the levers that correlate with real position gains look nothing like a traditional SEO checklist.

    Third-party review presence moved the most. A study of over 800,000 AI responses across ChatGPT, Gemini, Perplexity, and Google AI Mode sorted brands into four tiers by review profile depth. Brands with no profile had a median AI citation rate of 1%. Brands with even a minimal profile, as few as 1 to 13 reviews, jumped to 53.5%. That’s a 52-point swing from a setup task.

    geo rank tracker

    The effect concentrates where it matters commercially. Review and trust sites are a small slice of citations at the awareness stage and grow 10 to 20 times by the decision stage.

    Earned brand mentions moved second. Analysis of 75,000 brands found that YouTube mentions correlate with AI visibility at 0.737 and branded web mentions at 0.664, both measured on the Spearman scale.

    Source freshness moved third. Cited content runs meaningfully newer than organic top-10 results, and on retrieval-heavy platforms the pages behind your position rotate weekly. Keeping the sources that mention you current is closer to maintenance than to campaign work.

    Now the two that didn’t.

    Backlinks correlate at 0.218 in the same 75,000-brand dataset, and domain rating at roughly 0.18. Both are positive. Neither explains much. Publishing volume performs worse still, with content volume landing near 0.194, meaning the number of pages on your site has almost no bearing on whether AI systems name your brand.

    One honest conflict is worth flagging. One analysis of AI Overview results reports that multi-modal content shows 156% higher selection rates than text-only pages, while a separate agency study found multi-modal content moved results far less than expected. The evidence here isn’t settled, so treat image and video additions as a hypothesis to test rather than a rule to adopt.

    Why Your Citation Sources Move Rank Faster Than Your Page Edits

    Here’s the thing most teams get backwards. You don’t optimize a page into an AI answer slot. You influence which sources get pulled when the answer is assembled.

    The gap between those two ideas is now measurable. The overlap between Google’s top-10 rankings and the sources cited in AI answers collapsed from around 75% in mid-2025 to between 17% and 38% by early 2026. Winning the old surface stopped guaranteeing the new one.

    Citation slots also rotate hard. In Google AI Overviews, the same URL holds its citation for an average of 3.87 consecutive days, and 91% of tracked URLs were dropped at some point during the study window.

    That’s why a rewrite of your own page often produces nothing in the GEO ranking data while a single new third-party comparison article moves three prompts at once.

    Prompt specificity matters here too. A test across 5,000 local queries found URL overlap between identical runs as low as 18% to 20% on vaguely phrased prompts, with specificity nearly doubling stability. If your tracked prompt set is full of “best CRM” rather than “HIPAA-compliant CRM for small clinics,” you’re measuring a noisier signal than you need to.

    The Lag Between Doing the Work and Seeing It in GEO Ranking Data

    Most GEO experiments get killed before they resolve.

    Edit-to-citation lag varies by an order of magnitude across engines, from a median of about two days on Perplexity to roughly a month on Gemini, with a meaningful share of edits never reflected at all. Broader timeline estimates converge on first signals at 4 to 8 weeks and meaningful citation patterns at 3 to 6 months, with one 2026 breakdown putting consistent citation at 8 to 12 weeks of active work.

    Platform updates add a second trap. On days when a model refresh shipped, brand-set churn spiked to 2.7 times baseline and took four to six days to settle. A team that reads that spike as a strategy failure and rolls back its changes has just destroyed its own trend line.

    Two operating rules follow. Don’t evaluate a GEO change on a window shorter than six weeks. And when churn spikes across every category at once rather than in the one you touched, wait a week before concluding anything.

    Ranking Higher and Getting Mentioned More Are Not the Same Win

    This is the part a position-only dashboard hides.

    Analysis of 541,213 LLM responses across 20 brands and six platforms found a brand’s citation rate was 53.1% when the brand was named in the response and 10.6% when it wasn’t. The proposed mechanism is that the model chooses which brands to name from trained memory first, then retrieves sources to support those choices. Citations behave like a bibliography, not a brainstorm.

    If that’s directionally right, then climbing from position 4 to position 2 inside answers you already appear in is a different achievement from getting named in answers where you’re currently absent. The first is an ordering problem. The second is a memory problem.

    Research from Topify’s own team, currently under academic review, points the same way: traditional SEO metrics predict where a brand lands inside an AI answer but not how often the brand gets named at all. Ranking and mention frequency separate.

    That’s the gap most rank trackers still can’t show you.

    What a GEO Rank Tracker Has to Show You Besides Position

    Everything above adds up to a fairly specific tool requirement. Position alone is a noisy, partial, single-platform metric. To act on GEO ranking data you need the mention layer, the citation layer, and the competitive axis in the same view, sampled often enough to see through the churn.

    Topify is built around that combination. It tracks seven metrics in parallel, visibility, sentiment, position, volume, mentions, intent, and CVR, so a position drop can be checked against whether your mention rate fell with it or held steady. Those are two different problems with two different fixes, and a position-only chart can’t distinguish them.

    The citation layer is where attribution usually gets settled. Topify’s citation analysis surfaces the exact domains and URLs the platforms pulled for a given prompt, which turns “our rank moved” into “a review aggregator that used to list us dropped us in week six.” Pair that with competitor benchmarking on the same prompt set and you can tell whether you slipped or a rival simply landed three new placements. Coverage spans ChatGPT, Gemini, Perplexity, DeepSeek, Doubao, and Qwen, which matters if any part of your audience searches outside the US.

    Entry pricing starts at $99 per month for 100 tracked prompts and 9,000 AI answer analyses, which is roughly the sampling density the volatility data suggests you need.

    How to Run a 90-Day GEO Rank Test That Survives Scrutiny

    The method matters more than the tool. Five decisions do most of the work.

    Freeze your prompt set. Pick 50 to 200 prompts that mirror real buyer questions and don’t change them mid-quarter. Swapping prompts destroys the trend line you’re trying to read.

    Sample repeatedly, then report frequency. Run each prompt several times per platform per window and report the share of runs your brand appeared in, not a yes or no from a single check. Practitioners generally land on 5 to 10 runs per prompt per engine.

    Hold conditions constant. Same time of day, clean sessions, fixed geography. Otherwise you’re measuring your own setup drift.

    Change one variable at a time. The single most common reason teams can’t explain their own GEO ranking data is that they shipped four things in the same sprint.

    Wait out the lag before you judge. Six weeks minimum, longer on model-led platforms.

    Run that for a quarter and you’ll have something defensible: a baseline, a noise floor, and a short list of changes with dates attached. You can set up a tracked prompt set in Topify and let the first 30 days establish the baseline before you change anything.

    Conclusion

    Ninety days of data doesn’t make AI search predictable. It makes it legible. The honest read is that recommendation lists turn over every three to eleven days depending on platform, roughly a third of what a GEO rank tracker shows on a given day is sampling noise, and the changes that reliably move real position are off-site: review presence, earned mentions, and fresh third-party sources.

    Start by measuring properly. Freeze a prompt set, sample it repeatedly for 30 days without touching anything, and find out what your brand’s natural variance actually looks like. Only then will a rank change mean something when you report it.

    FAQ

    Q: What’s the difference between a GEO rank tracker and a traditional SEO rank tracker? 

    A: An SEO rank tracker measures where a page appears in a results list. A GEO rank tracker measures whether a brand appears inside a generated answer, in what order relative to competitors, which sources the engine cited, and how the brand was described. The output is probabilistic, so it has to be sampled repeatedly rather than checked once.

    Q: How often should I check my GEO rankings? 

    A: Daily or near-daily on the platforms your buyers use, with weekly review of the aggregate trend. Median brand-list persistence runs three to seven days on the most-used platforms, so weekly manual checks miss entire appearance windows.

    Q: My position improved but my mention rate didn’t. What does that mean? 

    A: You got better ordering inside answers you were already appearing in, without expanding into new prompts. Position work responds to on-page and comparative content. Mention rate responds to off-site brand presence. They need different fixes.

    Q: How many prompts do I need to track for the data to be meaningful? 

    A: Fifty is a workable floor for a single category, and 100 to 200 covers a mid-sized product line with room for competitor prompts. What matters more than raw count is repeated sampling per prompt and keeping the set frozen across the measurement window.

    Read More

  • We Ran One Prompt 500 Times. Here’s What a GEO Rank Tracker Sees

    We Ran One Prompt 500 Times. Here’s What a GEO Rank Tracker Sees

    You checked ChatGPT three times last week to see whether your brand came up in your category. First run, you were there. Second run, gone. Third run, you were back but listed fourth instead of second.

    So which number goes in the monthly report? That question is the entire problem with treating AI search like a ranking board, and it’s the reason a GEO rank tracker has to work differently from anything in your SEO stack.

    The Setup: One Prompt, 500 Runs, Five Engines

    We took a single high-intent commercial prompt, the kind a real buyer types when they’re two weeks from a purchase decision, and ran it 100 times each across ChatGPT, Gemini, Perplexity, Claude, and Google AI Overviews. Same wording. Same day. No personalization, no session history.

    For every response we logged three things: whether the target brand appeared at all, where it sat in the ordering when it did appear, and which domains got cited underneath.

    The point wasn’t to measure one brand. It was to answer a more basic question: does “rank” survive contact with a system that generates a fresh answer every time?

    The short version is that it survives, but not in the shape most teams assume.

    A Single Check Isn’t a Rank. It’s an Anecdote

    Here’s the thing about probabilistic output. If your brand shows up in 4 out of 10 runs, your actual mention rate is 40%. A one-shot manual check reports either 0% or 100% depending on which run you happened to catch. Both readings are wrong, and neither comes with a warning label.

    This isn’t a quirk you can configure away. Even at temperature zero, the same prompt can produce different outputs across runs because of floating-point non-associativity combined with dynamic batching on the inference side. Variance is baked into the infrastructure.

    The measurement layer inherits that. As iPullRank puts it in their AI search manual, share of voice in generative search is a statistical distribution of presence over many trials, not a static percentage of positions held.

    One check is not a data point. It’s a coin flip you wrote down.

    The instability compounds over time, too. Independent analyses suggest 40 to 60% of AI citations rotate every month for mid-sized B2B brands, and that 73.4% of specific URLs get cited exactly once before vanishing from AI answers entirely.

    Mention Rate Moved a Lot. Position Barely Did.

    This was the finding that changed how we read the data.

    Across the 500 runs, whether the brand appeared swung far more than where it appeared. On three of the five engines, mention rate moved by double digits between the first 50 runs and the second 50. But in the runs where the brand did appear, its ordinal position clustered tightly, usually within a single slot of its median.

    Two different signals. Two different failure modes. Most dashboards collapse them into one number called “rank” and lose both.

    There’s academic backing for the split. Research on the structural gap between search engine and generative AI brand visibility found that traditional SEO strength predicts a brand’s ranking position inside an AI answer reasonably well, but predicts its mention frequency poorly. Being strong enough to get listed and being retrieved often enough to get listed are governed by different mechanics.

    Semrush’s study of 1,094 subject areas in ChatGPT points the same direction from another angle. Only 21% of the most-cited domains in a category were also the most-mentioned brand, and the two signals correlate slightly negatively at -0.229.

    That matters operationally. If your mention rate is falling but your position holds, you have a retrieval problem and you need more citable surface area. If your mention rate is stable but your position slides, you have a framing problem and competitors are being described as the better fit.

    Same “rank drop.” Opposite fixes.

    Five Engines, Five Different Answers to the Same Question

    Run-to-run variance was real. Cross-engine variance was bigger.

    The gap between what ChatGPT said and what Perplexity said, given identical input, exceeded the gap between any single engine’s best and worst run. That tracks with the published research. One analysis of 50 buyer-intent prompts found that ChatGPT, Perplexity, and Gemini named the same brand only 21% of the time, with over half of all brand mentions coming from just one engine.

    The citation layer diverges even harder. Across 680 million AI citations analyzed in early 2026, only 11% of domains were cited by both ChatGPT and Perplexity. Yext’s look at 6.8 million citations found very little overlap in what each model cites, with each engine weighting source types on its own logic.

    So tracking one engine isn’t partial coverage. It’s a systematic bias, and it points in a direction you can’t predict from the engine you did measure.

    The corollary is worse for reporting: a blended cross-engine average hides exactly the thing you’d act on. A brand at 60% on Gemini and 5% on ChatGPT averages to a perfectly unremarkable 32%.

    What This Means for Your GEO Rank Tracker

    Work backward from the variance and the tool requirements write themselves.

    RequirementSingle-check approachSampling-based GEO rank tracker
    Sample size1 run per promptDozens of runs per prompt, reported as a rate
    Metric structureOne blended “rank” scoreMention rate and position tracked separately
    Engine coverageOne engine, extrapolatedEach engine reported independently
    CadenceMonthly or ad hocWeekly minimum, daily for volatile categories
    Competitor contextAbsentSame prompt set, same sampling, side by side

    Search Engine Land’s overview of the category makes the same point about methodology: variable outputs mean tracking requires consistent monitoring and statistical sampling rather than spot checks.

    Cadence deserves its own note. Monthly monitoring is effectively no monitoring when citation sets turn over at 40 to 60% in that same window. By the time you see the change, you can’t attribute it to anything.

    And frequency without competitor context still leaves you blind. If your citation rate holds flat at 15% while a rival climbs from 10% to 40%, your number didn’t move but your share collapsed.

    Where Topify Fits

    The reason we ran this test at all is that it maps directly onto how measurement should be built.

    Topify reports seven metrics separately rather than folding them into a single score: visibility, sentiment, position, volume, mentions, intent, and CVR. Visibility answers how often you appear across a defined prompt set. Position answers where you land when you do. Keeping them apart is what makes the mention-versus-position diagnosis possible in the first place, and it’s the difference between knowing your number dropped and knowing why.

    Each prompt runs repeatedly across ChatGPT, Gemini, Perplexity, DeepSeek, Doubao, Qwen, and others, with results reported per engine instead of averaged into a single figure. Competitor benchmarking runs on the same prompt set and the same sampling, so relative share is visible even when your absolute number sits still.

    The citation reverse-engineering layer closes the loop. Seeing which exact domains and URLs each engine pulls from tells you where the retrieval gap lives, which is the actionable half of a falling mention rate. Our earlier breakdown of how a GEO rank tracker measures AI search position covers the metric definitions in more depth.

    Plans start at $99/month with 100 tracked prompts and 9,000 AI answer analyses, which is roughly the sampling volume this kind of question requires. You can get started with Topify on a 30-day trial.

    How to Read Your Own Rank Data Without Fooling Yourself

    Four habits separate teams who act on AI search data from teams who argue about it.

    Track prompt sets, not keywords. Buyers ask several related questions on the way to a decision, and winning one of them isn’t the same as owning the topic. Visibility that looks strong on a single prompt often thins out across the cluster.

    Read trend bands, not points. A 5-point week-over-week move on a sampled rate is usually noise. A 5-point move sustained across four weeks is a trend. Set that threshold before you look at the data, not after.

    Plot competitors on the same axis. Absolute visibility without relative share tells you almost nothing about whether you’re winning.

    Separate “absent” from “present but ranked low.” They look identical on a summary dashboard and they need completely different responses.

    Sample enough. Split the metrics. Check every engine.

    Conclusion

    Rank didn’t disappear when search became generative. It changed units. It stopped being a position you hold and became a probability you occupy, which means the number is only meaningful attached to a sample size.

    The three checks you ran in ChatGPT last week weren’t wrong. They were just three draws from a distribution you hadn’t measured yet. A GEO rank tracker built on repeated sampling, separated metrics, and per-engine reporting turns those draws into something you can put in a report and defend.

    Start by defining the ten prompts your buyers actually ask. Everything else follows from having a stable set to sample against.

    FAQ

    Q: How many times does a prompt need to run before the result is trustworthy? 

    A: Dozens, not a handful. The practical floor is enough runs that a single outlier can’t move the rate by more than a point or two. Most sampling-based platforms run each prompt many times per cycle for exactly this reason, and any tool reporting a rank off one query is reporting an anecdote.

    Q: Which matters more, mention rate or position? 

    A: Mention rate, in most cases. A brand that never appears can’t benefit from good placement. Once you’re appearing consistently, position becomes the lever that affects which option the buyer actually picks.

    Q: Can I just track ChatGPT and assume the rest follow? 

    A: No. Cross-engine agreement on brand recommendations runs around 21%, and domain-level citation overlap between major engines sits near 11%. Single-engine tracking produces a biased read in an unpredictable direction.

    Q: How often do AI rankings actually change? 

    A: Faster than SEO rankings. With a large share of citations rotating monthly, weekly tracking is the minimum viable cadence, and competitive categories often warrant daily sampling.

    Read More