
The new generative AI report in Google Search Console looks familiar enough to invite familiar conclusions. There is a trend chart, a table, filters, pages, countries, devices, and an export button. Yet the primary metric is not a click, a query, or a ranking. It is an impression inside a set of AI-generated search experiences.
That difference changes what the report can prove. An increase may mean more pages surfaced, more eligible searches occurred, or one high-volume experience expanded. A decrease may reflect demand, visibility, filtering, or a known data issue. This field guide explains each control and limitation so you can establish a defensible baseline before turning a line chart into a strategy claim.
The Generative AI Report Measures Google Visibility Only
Google’s Generative AI performance report shows how links to your site appear in supported generative AI features on Google Search. Google lists AI Overviews and AI Mode as included experiences and says the list may change over time.
The report is not a cross-platform AI visibility dashboard. It does not report what ChatGPT, Perplexity, or other independent assistants say about your brand. It also excludes experiments in Search Labs while those experiences remain under active development.
As of August 31, 2026, Google says the insights are available to websites worldwide. A property may still lack visible data when it has not received enough qualifying impressions or when its pages are not eligible for those generative features.
Treat the scope statement as the first line of your data dictionary:
> Google-owned, organic, link-based impressions in supported generative AI features, subject to Search Console thresholds and reporting rules.
That wording prevents the report from being mislabeled as total AI demand, total brand visibility, or total recommendation share.
Impressions Are the Core Metric, Not a Proxy for Recommendations
Google defines the total as the number of times links to your site were shown to a user in a generative AI feature. The report helps you see trend direction, identify pages receiving visibility, and break impressions down by available dimensions.
An impression confirms a displayed link under Google’s counting rules. It does not, by itself, establish that:
- the brand was recommended;
- the link was the primary supporting source;
- the user read or trusted the cited passage;
- the appearance produced a visit or conversion;
- the same page appeared in another AI platform.
This is not a flaw. It is a boundary. First-party impression data answers a valuable question as long as the team does not expand it into claims the metric cannot support.
The official report currently emphasizes impressions. Teams should therefore resist calculating invented click-through or conversion estimates from the AI impression total unless they have a separate, validated attribution method.
Use This Data Dictionary Before Building a Dashboard
The fields below summarize the report’s operational meaning based on Google’s current documentation.
| Field or control | What it represents | Useful for | Do not infer |
|---|---|---|---|
| Total impressions | Links from the property shown in supported Google generative AI features | Visibility trend and baseline | Recommendations, clicks, or total AI searches |
| Pages | Final linked URL, generally assigned to the canonical URL | Finding content receiving AI exposure | Which passage or claim was used |
| Countries | Country where the search originated | Geographic mix and rollout differences | User identity or market demand outside the property |
| Devices | Desktop, tablet, or mobile | Device mix and experience changes | Exact interface or conversion behavior |
| Dates | Daily, weekly, or monthly grouping in Pacific Time | Trend and period comparison | Local-day alignment in every market |
| Web: text-based | Traffic context originating from text queries in standard search | Separating text-led experiences | The actual query text |
| Web: multimodal | Searches using images, including listed Lens and image-search entry points | Visual discovery analysis | Which image or object triggered the result |
| Export | Download of chart and table data | Reproducible analysis and archiving | Unlimited rows or removal of all privacy limits |
Google notes that values shown as ~ or - in the interface are exported as zeros. Preserve that rule in your data documentation so unavailable or suppressed values are not mistaken for measured zeros.
Aggregation Changes the Meaning of Totals
The chart and table can disagree without either being wrong. Google explains that chart data is aggregated by property unless a URL filter is applied, while table aggregation depends on the selected dimension.
For example, two links from the same site in one generative result may count as one property-level impression in the chart. Page-level rows can still reflect the individual linked URLs. Summing page rows and comparing that total with the property chart can therefore produce a discrepancy.

Canonicalization adds another layer. Google says page data is generally assigned to the canonical URL after redirects, not necessarily the exact duplicate URL a user or crawler encountered. A team that groups performance by raw CMS URL can misattribute the exposure if canonical rules are not understood.
Document the aggregation level beside every exported number. “1,000 AI impressions” is incomplete; “1,000 property-aggregated impressions, text-based web, United States, September 2026” is auditable.
Filters Answer Narrow Questions but Change the Denominator
The report supports dimensions and time ranges, plus filters such as page, country, device, and search type. Apply filters in a deliberate order and restate the active view before interpreting a change.
A practical sequence is:
- Establish the unfiltered property trend.
- Separate text-based and multimodal search types.
- Identify pages contributing most of the movement.
- Check country and device concentration.
- Compare equivalent complete periods.
Do not compare a filtered page view with an unfiltered property baseline as if the totals share one denominator. Also remember that newest data can be preliminary. Google marks it with a dotted line because recent values may still change as collection completes.
For advanced Performance reports, Google warns that filtering and grouping can interact with data truncation and anonymized-query omissions. The generative AI report currently does not expose a normal query table, which makes page and segment interpretation even more important.
Missing Data Has Several Possible Causes
No report or a low total does not automatically mean no AI visibility. Google’s documentation lists insufficient qualifying impressions and eligibility settings among the reasons data may not appear. Reporting thresholds and product availability can also limit what is visible.
Before escalating a visibility problem, check:
- the property and permission level;
- the selected date range and filters;
- whether the site is eligible for generative features and snippets;
- whether pages are indexed and canonicalized as expected;
- whether the latest data is preliminary;
- whether Google has recorded a reporting anomaly.
Google maintains a Search Console data anomalies log. For example, it documented a generative AI Search impression logging issue affecting August 13 through August 17, 2026, and later noted that the missing data had been restored. A sharp movement during a known incident should not become a content-performance narrative.
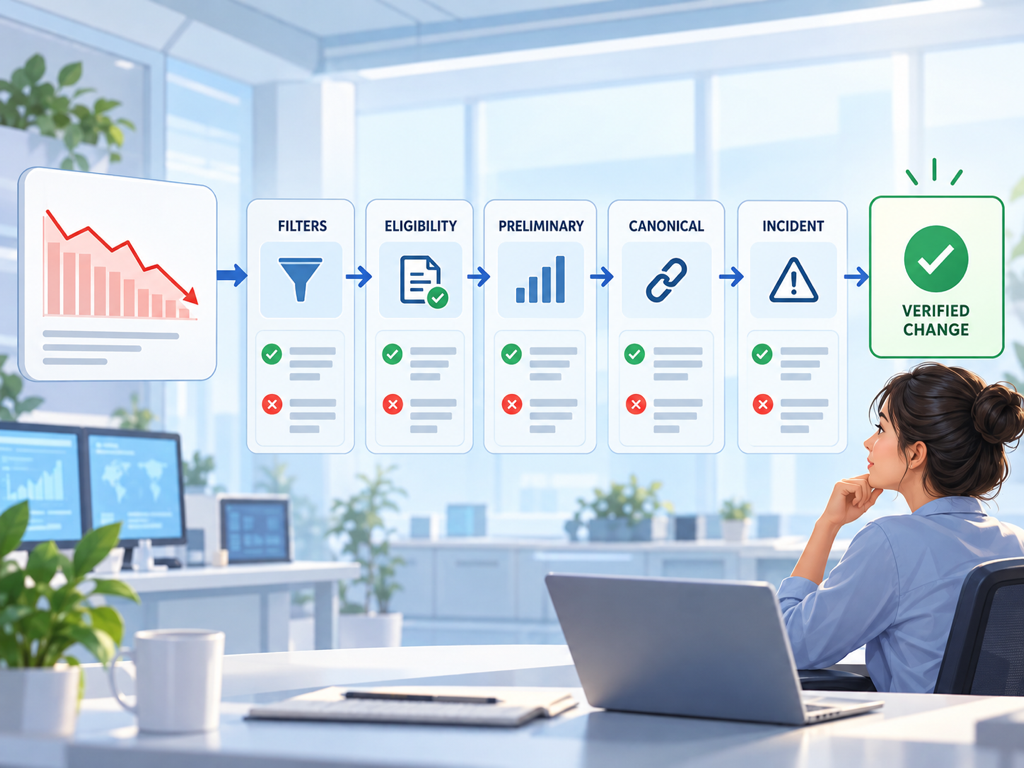
Keep an annotation log beside your exports. Record site migrations, major releases, indexing incidents, filter changes, and Google’s own data notes. The graph becomes much more useful when its context survives the meeting.
Establish a Baseline With Comparable Complete Periods
The first baseline should be simple. Export at least one complete period, preserve the unfiltered total, and create separate views for text-based and multimodal search. Then record the top pages, countries, and devices by impressions.
Use both a recent operational window and a longer context window when enough history exists. A seven-day view catches sudden changes. A 28-day or monthly view reduces the influence of weekday mix and short-lived volatility. Compare like-for-like periods and exclude incomplete newest days.
For every baseline, store:
- export date and report URL;
- property, date range, and time zone;
- active filters and search type;
- chart total and table scope;
- known anomalies or site changes;
- analyst notes and next review date.
Do not call GSC impressions market-wide search volume. They reflect where your property was shown under Google’s reporting conditions, not how often every relevant prompt was asked.
Pair First-Party Reporting With an Answer-Level Layer
Search Console is the authoritative source for supported Google impression data. An answer-level tracker serves a different purpose: observing prompts, brand mentions, ordered recommendations, citations, competitors, and changes across multiple AI platforms.
Use the two layers without pretending they are interchangeable. GSC can show that a page earned more Google generative impressions. It generally cannot reveal the hidden query, the exact claim cited, or what ChatGPT recommended. A tracker can capture those answer details but does not have access to Google’s internal impression logs.
Topify fits the second layer by monitoring prompt-level brand visibility, competitors, position, sentiment, and sources across supported AI experiences. Use GSC as the first-party Google baseline and Topify as an observational answer layer. When both move in the same direction, you have corroborating signals. When they diverge, investigate scope before choosing a story.
Google itself cautions that third-party tools do not have access to its internal ranking or AI systems in the official AI optimization guidance. A credible comparison respects that limit.
Conclusion
Google Search Console’s generative AI report gives site owners a first-party view of link impressions inside supported Google AI experiences. Its value depends on disciplined interpretation: impressions are not recommendations, page rows do not always sum to property totals, filters change scope, and missing data may reflect eligibility or reporting conditions.
Create a written data dictionary before building a dashboard. Preserve report settings with every export, compare complete periods, annotate anomalies, and separate text-based from multimodal views. Then add an answer-level monitoring layer only for questions GSC does not claim to answer. That division produces a baseline your team can defend instead of a chart that invites guesswork.
FAQ
What does the Search Console generative AI report measure?
It reports impressions when links to your property appear in supported generative AI features on Google Search, currently including AI Overviews and AI Mode according to Google.
Does the report show AI Mode queries and clicks?
The current report centers on impression data and available page, country, device, date, and search-type dimensions. It does not provide the familiar query-level view needed to explain every prompt.
Why can the chart total differ from the page table?
The chart can use property-level aggregation while page rows use page-level aggregation. Multiple links from one property in a result can therefore produce different valid totals.
Does Search Console report ChatGPT or Perplexity visibility?
No. Search Console reports Google properties and supported Google features. Cross-platform AI answers require a separate observational measurement approach.
Leave a Reply