Author: Elsa Ji

  • Google Search Console AI Performance: A Field Guide to the New Report

    Google Search Console AI Performance: A Field Guide to the New Report

    The new generative AI report in Google Search Console looks familiar enough to invite familiar conclusions. There is a trend chart, a table, filters, pages, countries, devices, and an export button. Yet the primary metric is not a click, a query, or a ranking. It is an impression inside a set of AI-generated search experiences.

    That difference changes what the report can prove. An increase may mean more pages surfaced, more eligible searches occurred, or one high-volume experience expanded. A decrease may reflect demand, visibility, filtering, or a known data issue. This field guide explains each control and limitation so you can establish a defensible baseline before turning a line chart into a strategy claim.

    The Generative AI Report Measures Google Visibility Only

    Google’s Generative AI performance report shows how links to your site appear in supported generative AI features on Google Search. Google lists AI Overviews and AI Mode as included experiences and says the list may change over time.

    The report is not a cross-platform AI visibility dashboard. It does not report what ChatGPT, Perplexity, or other independent assistants say about your brand. It also excludes experiments in Search Labs while those experiences remain under active development.

    As of August 31, 2026, Google says the insights are available to websites worldwide. A property may still lack visible data when it has not received enough qualifying impressions or when its pages are not eligible for those generative features.

    Treat the scope statement as the first line of your data dictionary:

    > Google-owned, organic, link-based impressions in supported generative AI features, subject to Search Console thresholds and reporting rules.

    That wording prevents the report from being mislabeled as total AI demand, total brand visibility, or total recommendation share.

    Impressions Are the Core Metric, Not a Proxy for Recommendations

    Google defines the total as the number of times links to your site were shown to a user in a generative AI feature. The report helps you see trend direction, identify pages receiving visibility, and break impressions down by available dimensions.

    An impression confirms a displayed link under Google’s counting rules. It does not, by itself, establish that:

    • the brand was recommended;
    • the link was the primary supporting source;
    • the user read or trusted the cited passage;
    • the appearance produced a visit or conversion;
    • the same page appeared in another AI platform.

    This is not a flaw. It is a boundary. First-party impression data answers a valuable question as long as the team does not expand it into claims the metric cannot support.

    The official report currently emphasizes impressions. Teams should therefore resist calculating invented click-through or conversion estimates from the AI impression total unless they have a separate, validated attribution method.

    Use This Data Dictionary Before Building a Dashboard

    The fields below summarize the report’s operational meaning based on Google’s current documentation.

    Field or controlWhat it representsUseful forDo not infer
    Total impressionsLinks from the property shown in supported Google generative AI featuresVisibility trend and baselineRecommendations, clicks, or total AI searches
    PagesFinal linked URL, generally assigned to the canonical URLFinding content receiving AI exposureWhich passage or claim was used
    CountriesCountry where the search originatedGeographic mix and rollout differencesUser identity or market demand outside the property
    DevicesDesktop, tablet, or mobileDevice mix and experience changesExact interface or conversion behavior
    DatesDaily, weekly, or monthly grouping in Pacific TimeTrend and period comparisonLocal-day alignment in every market
    Web: text-basedTraffic context originating from text queries in standard searchSeparating text-led experiencesThe actual query text
    Web: multimodalSearches using images, including listed Lens and image-search entry pointsVisual discovery analysisWhich image or object triggered the result
    ExportDownload of chart and table dataReproducible analysis and archivingUnlimited rows or removal of all privacy limits

    Google notes that values shown as ~ or - in the interface are exported as zeros. Preserve that rule in your data documentation so unavailable or suppressed values are not mistaken for measured zeros.

    Aggregation Changes the Meaning of Totals

    The chart and table can disagree without either being wrong. Google explains that chart data is aggregated by property unless a URL filter is applied, while table aggregation depends on the selected dimension.

    For example, two links from the same site in one generative result may count as one property-level impression in the chart. Page-level rows can still reflect the individual linked URLs. Summing page rows and comparing that total with the property chart can therefore produce a discrepancy.

    Diagram showing property-level and page-level aggregation producing different valid totals from the same generative AI result.

    Canonicalization adds another layer. Google says page data is generally assigned to the canonical URL after redirects, not necessarily the exact duplicate URL a user or crawler encountered. A team that groups performance by raw CMS URL can misattribute the exposure if canonical rules are not understood.

    Document the aggregation level beside every exported number. “1,000 AI impressions” is incomplete; “1,000 property-aggregated impressions, text-based web, United States, September 2026” is auditable.

    Filters Answer Narrow Questions but Change the Denominator

    The report supports dimensions and time ranges, plus filters such as page, country, device, and search type. Apply filters in a deliberate order and restate the active view before interpreting a change.

    A practical sequence is:

    1. Establish the unfiltered property trend.
    2. Separate text-based and multimodal search types.
    3. Identify pages contributing most of the movement.
    4. Check country and device concentration.
    5. Compare equivalent complete periods.

    Do not compare a filtered page view with an unfiltered property baseline as if the totals share one denominator. Also remember that newest data can be preliminary. Google marks it with a dotted line because recent values may still change as collection completes.

    For advanced Performance reports, Google warns that filtering and grouping can interact with data truncation and anonymized-query omissions. The generative AI report currently does not expose a normal query table, which makes page and segment interpretation even more important.

    Missing Data Has Several Possible Causes

    No report or a low total does not automatically mean no AI visibility. Google’s documentation lists insufficient qualifying impressions and eligibility settings among the reasons data may not appear. Reporting thresholds and product availability can also limit what is visible.

    Before escalating a visibility problem, check:

    • the property and permission level;
    • the selected date range and filters;
    • whether the site is eligible for generative features and snippets;
    • whether pages are indexed and canonicalized as expected;
    • whether the latest data is preliminary;
    • whether Google has recorded a reporting anomaly.

    Google maintains a Search Console data anomalies log. For example, it documented a generative AI Search impression logging issue affecting August 13 through August 17, 2026, and later noted that the missing data had been restored. A sharp movement during a known incident should not become a content-performance narrative.
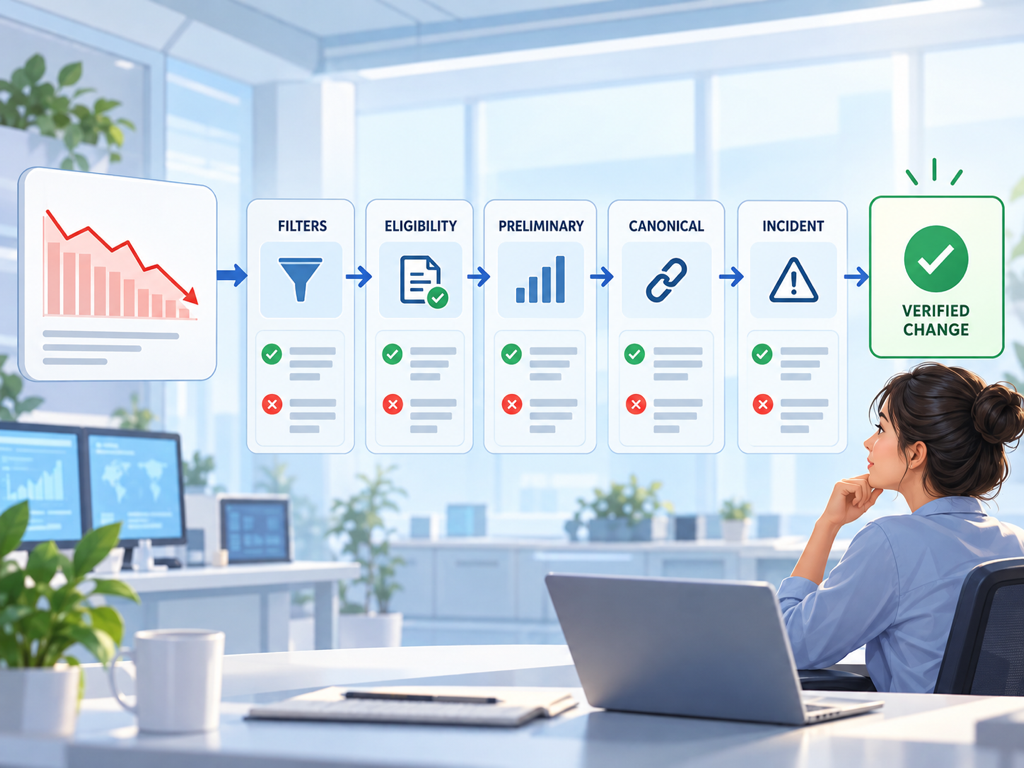
    Troubleshooting flow separating real visibility changes from filters, eligibility, preliminary data, canonicalization, and documented reporting anomalies.

    Keep an annotation log beside your exports. Record site migrations, major releases, indexing incidents, filter changes, and Google’s own data notes. The graph becomes much more useful when its context survives the meeting.

    Establish a Baseline With Comparable Complete Periods

    The first baseline should be simple. Export at least one complete period, preserve the unfiltered total, and create separate views for text-based and multimodal search. Then record the top pages, countries, and devices by impressions.

    Use both a recent operational window and a longer context window when enough history exists. A seven-day view catches sudden changes. A 28-day or monthly view reduces the influence of weekday mix and short-lived volatility. Compare like-for-like periods and exclude incomplete newest days.

    For every baseline, store:

    • export date and report URL;
    • property, date range, and time zone;
    • active filters and search type;
    • chart total and table scope;
    • known anomalies or site changes;
    • analyst notes and next review date.

    Do not call GSC impressions market-wide search volume. They reflect where your property was shown under Google’s reporting conditions, not how often every relevant prompt was asked.

    Pair First-Party Reporting With an Answer-Level Layer

    Search Console is the authoritative source for supported Google impression data. An answer-level tracker serves a different purpose: observing prompts, brand mentions, ordered recommendations, citations, competitors, and changes across multiple AI platforms.

    Use the two layers without pretending they are interchangeable. GSC can show that a page earned more Google generative impressions. It generally cannot reveal the hidden query, the exact claim cited, or what ChatGPT recommended. A tracker can capture those answer details but does not have access to Google’s internal impression logs.

    Topify fits the second layer by monitoring prompt-level brand visibility, competitors, position, sentiment, and sources across supported AI experiences. Use GSC as the first-party Google baseline and Topify as an observational answer layer. When both move in the same direction, you have corroborating signals. When they diverge, investigate scope before choosing a story.

    Google itself cautions that third-party tools do not have access to its internal ranking or AI systems in the official AI optimization guidance. A credible comparison respects that limit.

    Conclusion

    Google Search Console’s generative AI report gives site owners a first-party view of link impressions inside supported Google AI experiences. Its value depends on disciplined interpretation: impressions are not recommendations, page rows do not always sum to property totals, filters change scope, and missing data may reflect eligibility or reporting conditions.

    Create a written data dictionary before building a dashboard. Preserve report settings with every export, compare complete periods, annotate anomalies, and separate text-based from multimodal views. Then add an answer-level monitoring layer only for questions GSC does not claim to answer. That division produces a baseline your team can defend instead of a chart that invites guesswork.

    FAQ

    What does the Search Console generative AI report measure?

    It reports impressions when links to your property appear in supported generative AI features on Google Search, currently including AI Overviews and AI Mode according to Google.

    Does the report show AI Mode queries and clicks?

    The current report centers on impression data and available page, country, device, date, and search-type dimensions. It does not provide the familiar query-level view needed to explain every prompt.

    Why can the chart total differ from the page table?

    The chart can use property-level aggregation while page rows use page-level aggregation. Multiple links from one property in a result can therefore produce different valid totals.

    Does Search Console report ChatGPT or Perplexity visibility?

    No. Search Console reports Google properties and supported Google features. Cross-platform AI answers require a separate observational measurement approach.


    Read More

  • How to Diagnose Search Console AI Performance Trends Without Guessing

    How to Diagnose Search Console AI Performance Trends Without Guessing

    An AI impressions chart moves 35 percent in a week, and the meeting immediately produces three explanations. The content team credits a new guide. The technical team blames indexing. Leadership assumes buyer demand changed. All three stories may sound reasonable, yet the chart alone proves none of them.

    Search Console AI performance diagnosis is the discipline of eliminating reporting, scope, and site explanations before assigning a business cause. The workflow matters because the new generative AI report emphasizes impressions, uses specific aggregation rules, and covers Google experiences only. A useful diagnosis ends with a supported explanation, a bounded hypothesis, or an honest “not enough evidence.”

    Start by Defining the Movement Precisely

    Do not begin with “AI visibility is down.” Restate the observation using the report’s actual scope: property, metric, period, search type, filters, and comparison window.

    A defensible statement sounds like this:

    > Property-aggregated impressions from text-based generative AI features in Google Search decreased 35 percent week over week for complete Monday-to-Sunday periods, with no page filter applied.

    Google’s Generative AI performance report currently covers impressions from supported Google Search features including AI Overviews and AI Mode. It can group data by pages, countries, devices, and dates, and separate text-based from multimodal web search.

    That scope is narrower than total AI visibility. A change does not describe ChatGPT or Perplexity, and it does not automatically represent recommendations, clicks, or conversions.

    Rule Out Reporting Artifacts Before Looking for Causes

    The fastest diagnosis is often a reporting check. Confirm that both periods are complete, use the same filters, and have the same search type. Look for preliminary data marked by a dotted line and recheck after collection settles.

    Then consult Google’s Search Console data anomalies page. Google documented a generative AI Search logging issue for August 13 through August 17, 2026, later restoring the missing impressions. A visible dip during a recorded incident is not evidence of lost demand or weaker content.

    Exports introduce another trap. Google says interface values displayed as ~ or - become zeros in downloads. Preserve suppressed or unavailable status when possible instead of treating every exported zero as a measured absence.

    Finally, verify permissions and property selection. Domain properties, URL-prefix properties, and canonical URLs can change which rows appear even when the site itself has not changed.

    Decompose the Change by Search Type, Page, Country, and Device

    Once the report passes the basic checks, find where the movement is concentrated. Move from broad to narrow without changing several dimensions at once.

    Diagnostic cutQuestion answeredStrong signalCommon mistake
    Search typeIs the change text-based or multimodal?One type explains most of the deltaCombining two different discovery behaviors
    PageWhich canonical URLs moved?A small page set accounts for the changeSumming page rows as if they equal the property chart
    CountryIs the movement geographically concentrated?One market moves while others stay stableCalling a local rollout a global trend
    DeviceIs the change mobile, desktop, or tablet-led?One device diverges materiallyAssuming device mix proves interface cause
    DateDid the shift begin on a specific day?A clear breakpoint aligns with another eventChoosing dates after seeing the desired story

    Google explains that the chart can use property-level aggregation while page tables use page-level aggregation. Multiple links from one property in a result may count differently at those levels. Diagnose contribution directionally; do not force page-row sums to equal the property total.

    Diagnostic funnel narrowing a Search Console AI impression change by search type, page, country, device, and date.

    Stop narrowing when the remaining segment is too small or unstable to support interpretation.

    Separate Demand, Eligibility, Coverage, and Reporting Hypotheses

    After locating the segment, classify plausible explanations into four buckets. This prevents one favored cause from absorbing every movement.

    Demand hypothesis: the number or mix of qualifying searches changed. Seasonality, news, product launches, and market behavior can alter opportunity even when your site is unchanged.

    Eligibility hypothesis: indexing, canonicalization, snippet controls, or technical accessibility changed whether pages could appear. Google’s AI optimization guidance ties eligibility for generative features to established Search requirements rather than a separate AI-only index.

    Coverage hypothesis: Google’s systems selected different pages or sources for the same general demand. Content freshness, competing sources, and result composition may be involved, but the impression chart alone cannot identify the exact retrieval reason.

    Reporting hypothesis: filters, thresholds, aggregation, preliminary data, or a documented incident changed what the report shows.

    Write at least one disconfirming test for each hypothesis. A diagnosis becomes stronger when it can be proven wrong.

    Build an Event Timeline Without Claiming Causality

    Create a timeline around the first visible breakpoint. Include site releases, migrations, template changes, robots or indexing changes, major content publication, product announcements, campaign activity, and known Google incidents.

    Temporal alignment is evidence for investigation, not proof of causality. A guide published two days before an increase may have contributed, but the movement could also reflect market demand or a broader feature rollout.

    Use language that matches the evidence:

    • Observed: impressions rose after the release date.
    • Supported inference: the increase is concentrated on the released page and related pages.
    • Unproven hypothesis: the new guide caused the property-wide increase.

    This distinction keeps a performance note honest while giving the team a clear next test.

    Pair GSC With Page and Answer Evidence

    Search Console tells you that links appeared. To explain why a specific page moved, add evidence from indexing checks, page changes, server logs when available, analytics, and repeated answer observations.

    For a page-level increase, ask:

    1. Was the page indexed and canonical throughout both periods?
    2. Did its content, structured data, or internal links change?
    3. Did the country or device mix change?
    4. Do repeated AI answer checks show the page or brand more often?
    5. Did relevant demand or news change during the same period?
    Evidence board combining Search Console trends, technical checks, page changes, and repeated AI answers before accepting a cause.

    An answer-level tracker can reveal mentions, citations, competitors, or positions that GSC does not expose. It still cannot substitute for Google’s first-party impression count. Use the tools as complementary evidence, not as competing versions of one metric.

    Use Confidence Levels for Every Diagnosis

    Assign a confidence level based on how many independent observations support the explanation and whether alternatives were tested.

    High confidence requires a clear breakpoint, concentrated segment, verified event, matching technical or answer evidence, and no stronger alternative explanation.

    Medium confidence has consistent direction and some corroboration but cannot isolate the cause completely.

    Low confidence describes a plausible story based mainly on timing, a small sample, or a single volatile segment.

    Report the confidence beside the conclusion. “Multimodal impressions increased after new product imagery, medium confidence” is more useful than a precise percentage paired with an unsupported cause.

    When evidence is weak, define the next observation that would raise or lower confidence. That turns uncertainty into a measurement plan.

    Create a Weekly and Monthly Operating Rhythm

    Use weekly checks for anomalies and monthly reviews for decisions. A weekly review should confirm data completeness, scan the anomalies log, compare stable periods, and flag concentrated page or market movements.

    The monthly review should refresh the baseline, examine sustained changes, connect GSC with answer-level and business data, and decide whether a technical, content, authority, or monitoring action is justified.

    Topify can add the prompt and answer layer to this workflow. Track a stable set of relevant prompts, then compare brand visibility, recommendations, position, competitors, and sources with the Google impression trend. A divergence is not automatically an error. It may reflect platform scope, prompt selection, or a change limited to Google.

    Keep the prompt set versioned. If you add prompts during the same period you are comparing, the answer-level baseline changes and the trend becomes harder to interpret.

    Conclusion

    Search Console AI performance trends are signals to diagnose, not stories that explain themselves. Start by stating the movement with its full scope, rule out reporting artifacts, and decompose it one dimension at a time. Then test demand, eligibility, coverage, and reporting hypotheses against technical, page, and answer-level evidence.

    The final output should separate observation, inference, and hypothesis, include a confidence level, and name the next test. That approach may produce fewer dramatic explanations, but it gives content, SEO, and leadership teams a shared basis for action without mistaking correlation for cause.

    FAQ

    Why did Search Console AI impressions suddenly drop?

    Possible causes include demand changes, page eligibility, source-selection changes, filters, preliminary data, aggregation, or a documented reporting incident. Check reporting conditions before assigning a content cause.

    How long should I wait before analyzing recent data?

    Avoid treating dotted preliminary values as final. Recheck after Search Console finishes collecting the period and compare complete equivalent windows.

    Can page rows explain the property-level change exactly?

    Not always. Google uses different aggregation rules at property and page levels, so page-row totals may not equal the chart total.

    Can Topify confirm why a GSC AI trend changed?

    Topify can add prompt-level mentions, recommendations, competitors, position, and citation evidence. It cannot see Google’s internal reporting systems, so the combined evidence supports a diagnosis rather than absolute proof.

    Read More

  • GSC AI Report vs AI Visibility Trackers: What Each Can Prove

    GSC AI Report vs AI Visibility Trackers: What Each Can Prove

    Two dashboards show a rising AI line, but they are not measuring the same event. Google Search Console counts qualifying link impressions inside supported Google generative experiences. An AI visibility tracker observes generated answers for a defined prompt set and records whether a brand, competitor, or source appears. Calling both numbers “AI visibility” hides the difference that matters most.

    The right comparison is not which tool wins. It is which claim the data can support. A first-party impression report is strongest for Google exposure. A controlled answer monitor is strongest for prompt-level recommendations, citations, and cross-platform competition. Teams need a measurement contract before combining them.

    The Two Tools Observe Different Parts of the Journey

    Google’s Generative AI performance report records impressions when links to a verified property appear in supported generative AI features on Google Search. Google currently names AI Overviews and AI Mode, with views by page, country, device, date, and text-based or multimodal search type.

    An AI visibility tracker takes a different approach. It runs or observes a defined set of prompts across selected AI platforms, then structures the responses. Depending on the system, the output may include brand mentions, recommendation inclusion, ordered position, sentiment, citations, competitors, and changes over time.
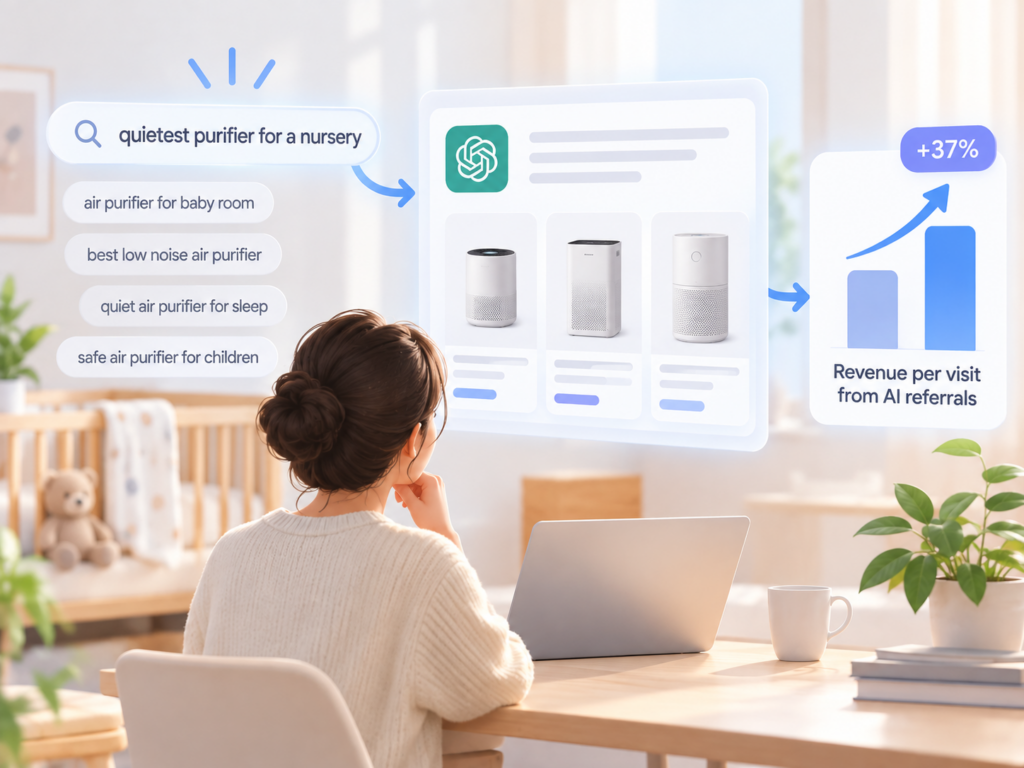
    One is first-party platform reporting. The other is controlled observational measurement.

    That distinction should remain visible in every dashboard, calculation, and executive summary.

    Compare Capabilities Without Pretending the Metrics Match

    The table below describes the typical division of labor. Specific tracker features and platform coverage must be verified with the vendor.

    Measurement questionGSC generative AI reportAI visibility tracker
    Did links to my site appear in supported Google AI experiences?First-party impression dataMay observe citations, but not Google’s internal impression total
    Which pages received Google AI impressions?Page dimension, generally canonicalizedOnly pages visible in sampled answers
    Which prompt caused the exposure?No standard query table in the current reportExact tracked prompt is known
    Was my brand explicitly recommended?Not established by an impressionCan be coded from the answer
    Which competitors appeared?Not a report dimensionCan be recorded for the same prompt set
    Which sources were cited?Page exposure for your property, not a full citation mapCan capture visible cited URLs and domains
    What happened in ChatGPT or Perplexity?Out of scopeCan observe supported external platforms
    How much total market demand exists?Not market-wide demandPrompt-set observations are not total demand either
    Can the tool reveal an internal ranking signal?Google reports its own output, not an optimization formulaNo external tracker has Google’s internal AI or ranking metrics

    Google explicitly warns in its AI optimization guidance that third parties do not have access to Google’s internal ranking or AI systems. A tracker should describe what it observes, not imply privileged access.

    GSC Is Strongest for First-Party Google Exposure

    Use Search Console when the primary question concerns a verified site’s visibility in Google’s supported experiences. It provides a property-based baseline, canonical page reporting, geographic and device breakdowns, date trends, and an exportable first-party record.

    This makes GSC useful for questions such as:

    • Which canonical pages receive the most Google generative impressions?
    • Did text-based or multimodal exposure change?
    • Is the movement concentrated in one country or device?
    • Did a site-wide technical issue coincide with a drop?

    GSC also has established reporting conventions, including preliminary data markers, aggregation rules, row limits, and a public data anomalies log.

    Its limits are equally important. An impression does not prove that the brand was recommended, that a particular claim was used, or that the exposure produced a click. The current report does not function as a prompt library or a competitor response monitor.

    Trackers Are Strongest for Repeatable Answer Observation

    Use an AI visibility tracker when the question starts with a buyer prompt or generated answer. The tracker can keep the exact wording, platform, region, language, and observation date attached to the result.

    A stable prompt set can answer:

    • Does the brand appear for this decision?
    • Is it explicitly recommended or merely mentioned?
    • Which competitors share the answer?
    • Which cited domains support the response?
    • Does position or framing change across platforms and time?
    Two measurement lanes showing GSC counting first-party Google link impressions and a tracker observing prompt-level answers across platforms.

    The trade-off is sampling. A tracker observes the prompts and conditions selected by the team. It does not automatically represent every real user conversation. Generated answers are also variable, so one run is a snapshot rather than a durable rate.

    Good tracker reporting therefore discloses prompt-set size, selection method, platforms, regions, cadence, and version changes.

    Four Common Comparison Errors Distort the Story

    The first error is treating a GSC impression and a tracker mention as interchangeable units. One is a displayed link under Google’s rules; the other is coded content in a sampled answer.

    The second is comparing a property-wide GSC total with a narrow commercial prompt set. The scopes differ in both demand and intent.

    The third is claiming that a tracker “fills in” hidden Google queries. It can test relevant prompts, but it cannot reveal the complete private query stream behind Search Console totals.

    The fourth is merging the numbers into one score without an explicit model. Adding impressions, mentions, citations, and positions produces a number, but not necessarily a meaningful measure.

    Keep raw measures separate. Build a shared interpretation layer above them.

    Use a Measurement Contract to Join the Data

    Before creating a combined dashboard, define a contract for each field. Record its source, unit, scope, update frequency, owner, known limitations, and the decision it supports.

    Measurement contract linking each metric to its source, scope, limitation, owner, and business decision before dashboarding.

    A practical contract might contain:

    • Google AI impressions: GSC property aggregation, complete weekly period, split by search type.
    • Tracked prompt inclusion rate: percentage of approved prompts where the brand appears, based on repeated observations.
    • Recommendation rate: percentage with explicit product or brand recommendation under a documented coding rule.
    • Owned citation rate: percentage of observed answers containing a link to an owned domain.
    • Competitor overlap: frequency with which named competitors appear in the same prompt set.

    Do not call inclusion rate “share of all AI searches.” It is the share of a defined sample. Do not call GSC impressions “brand mentions.” They are link impressions.

    Reconcile Diverging Signals Instead of Choosing a Winner

    The two systems will sometimes move differently. That divergence can be informative.

    If GSC impressions rise while tracked inclusion is flat, Google demand or surface coverage may have expanded beyond the tracked prompt set. Check pages, countries, devices, and search type before changing the prompts.

    If tracked recommendations improve while GSC is flat, the gain may be occurring in ChatGPT, Perplexity, or a Google prompt sample too small to move property totals. Confirm platform scope and citations.

    If both fall, test shared explanations such as indexing, source availability, product changes, or market demand. Parallel movement still does not prove one common cause.

    If they contradict sharply, audit definitions, dates, filters, prompt versions, and reporting anomalies first. Measurement drift is often easier to fix than a speculative optimization program.

    Where Topify Fits in the Combined Stack

    Topify operates in the observational layer. Its current Prompt Discovery workflow focuses on prompt demand, brand visibility gaps, competition, and opportunity prioritization. Its monitoring use case can track how a defined prompt set produces mentions, recommendations, competitors, and citation patterns across supported platforms.

    Keep Google Search Console as the source of truth for Google’s own reported impressions. Use Topify to investigate the answer-level questions GSC does not expose and to extend the view beyond Google where supported.

    A sensible operating sequence is:

    1. Export the complete GSC baseline.
    2. Identify high-value pages, markets, and movement.
    3. Approve a stable prompt set representing the relevant buyer decisions.
    4. Monitor answer inclusion, recommendations, competitors, and citations.
    5. Investigate convergence or divergence with the measurement contract.

    This approach preserves the authority of each source and gives the team more diagnostic depth without inventing a universal metric.

    Conclusion

    The GSC AI report and AI visibility trackers are complementary because they observe different events. Search Console provides first-party Google link impressions for a verified property. A tracker provides controlled observations of prompts, generated answers, competitors, recommendations, and citations across its supported platforms.

    Use each tool for the claim it can support. Keep units separate, publish sampling and scope, and define a measurement contract before joining the views. When the signals diverge, investigate filters, coverage, and prompt selection instead of choosing whichever chart tells the preferred story.

    FAQ

    Is Google Search Console an AI visibility tracker?

    It is a first-party performance report for supported Google generative AI features. It does not provide the same prompt, competitor, recommendation, and cross-platform observations as a dedicated tracker.

    Can an AI visibility tracker access Google’s internal AI metrics?

    No external tracker has access to Google’s internal ranking or AI systems. Trackers observe outputs for defined prompts and conditions.

    Should GSC impressions and tracker mentions be combined into one score?

    Usually not as raw values. They use different units and scopes. Keep them separate unless a documented model explains the normalization and decision purpose.

    Which tool should a small team start with?

    Start with GSC for first-party Google exposure, then add a small stable prompt set when the team needs recommendation, citation, competitor, or non-Google visibility evidence.

    Read More

  • Multimodal Search SEO: How to Optimize for Lens, Images, and AI Search

    Multimodal Search SEO: How to Optimize for Lens, Images, and AI Search

    A shopper points a camera at a chair, circles the fabric pattern, and asks for a similar model that fits a smaller room. A traveler uploads a landmark photo and asks what it is, when to visit, and where to stay nearby. Neither journey begins with a keyword list. The image supplies the object, color, shape, and context; language adds the task and constraints.

    Multimodal search SEO prepares pages for that combined retrieval problem. Images must be discoverable and interpretable, while the surrounding page must provide the entity, attributes, evidence, and destination a search system needs to return a useful result. Great photography without context is weak evidence. Detailed copy without usable images misses the visual query.

    Multimodal Search Combines Visual and Language Evidence

    Multimodal search accepts more than one input type, commonly an image plus text. The system may identify objects or scenes, interpret a user’s follow-up question, retrieve relevant web information, and assemble visual or generative results.

    Google’s Search Console documentation now separates Web: multimodal activity, covering image-led searches from Lens, Circle to Search on Android, uploaded images, and Chrome image search. Google announced the reporting update on September 24, 2026, with global rollout for sites receiving eligible traffic.

    This creates a new measurement view, not a separate shortcut to rankings. Google’s established image and page requirements still matter: crawlable pages, accessible image URLs, useful content, clear context, and eligible indexable resources.

    Think of the optimization unit as an image-page pair. The image contributes visual features; the page explains what those features mean and why the result answers the task.

    Match the Page to the Visual Decision

    A multimodal query may seek identification, comparison, inspiration, troubleshooting, local context, or purchase. The best page type depends on that decision.

    Visual search intentExample input and questionStrong destinationEvidence the page should provide
    IdentifyPhoto of a plant: “What is this?”Species or reference pageClear identity, distinguishing traits, cautions
    Find similarSofa photo: “Show me this style in green”Category or product collectionVisual variants, color, material, dimensions
    CompareTwo devices: “Which is better for travel?”Comparison or buyer guideVisible form factor, specifications, trade-offs
    TroubleshootPhoto of an error or damaged partDiagnostic guideMatching symptom images, steps, safety limits
    Explore placeLandmark image: “What can I do nearby?”Destination or local guideLocation, season, access, related places
    BuyProduct photo: “Where can I get this under $150?”Product detail or merchant pagePrice, availability, variants, merchant terms

    Do not send every visual result to a generic homepage. The destination should resolve the question the image helped express.

    Make Images Discoverable Before Optimizing Their Meaning

    Google’s image SEO best practices recommend standard HTML image elements. Google can find images in the src attribute of an <img> element, including within <picture>, while CSS background images are not indexed in the same way.

    Use stable, crawlable image URLs and a real src fallback with responsive srcset or <picture> markup. Confirm that robots rules, authentication, CDN settings, and hotlink controls do not block the page or image resource.

    Image sitemaps can help Google discover resources it might otherwise miss, including images hosted on a CDN. When using a separate CDN domain, verify ownership in Search Console where practical so crawl problems are visible.

    Use supported formats, descriptive filenames, and dimensions appropriate for the experience. Compression should reduce transfer cost without destroying details needed to recognize the subject. A blurred texture, unreadable label, or tiny object may be fast but unhelpful.

    Technical discoverability is the entry ticket. It does not tell a search system what the image proves.

    Give Every Important Image a Clear Context

    Google says it uses alt text, computer vision, and page content to understand image subject matter. It also recommends placing images near relevant text on pages that match the subject.

    Write alt text for accessibility and meaning, not as a keyword container. Describe the content and function the reader would miss. A useful product alt might identify model, color, material, and visible configuration. It should not repeat every keyword in the page title.

    Captions can add evidence that is visible to all readers: date, location, measurement, result, or the relationship between two objects. Surrounding copy should name entities and explain the attributes a visual alone cannot establish.

    Multimodal retrieval workflow combining an image, a written constraint, page context, product attributes, and a useful destination.

    For charts and diagrams, state the takeaway in nearby prose. For product images, expose price, availability, dimensions, variants, and compatibility in crawlable text or structured data rather than baking facts into pixels only.

    Build Image Sets That Answer Comparison and Constraint Questions

    One polished hero image rarely covers the decisions people make with visual search. Create an intentional set that shows the subject from useful angles and under realistic conditions.

    For products, include scale, details, variants, packaging, interfaces, and in-use scenes. Keep color and proportions faithful. For travel or local content, include recognizable viewpoints, access conditions, seasons, and nearby context. For troubleshooting, show the normal state and the relevant symptom clearly.

    The image set should reduce uncertainty, not create visual volume. Ten near-identical lifestyle photos contribute less evidence than three images that answer size, material, and use.

    Avoid replacing primary product photography with text-heavy promotional cards. Google advises against generic or text-dominated choices for preferred preview imagery. A representative high-resolution image is more useful for visual discovery.

    Connect Structured Data to Visible Page Truth

    Structured data can make explicit relationships between the page, its main entity, and images. Depending on the content, Product, Recipe, LocalBusiness, Article, or other supported markup may include required image properties and relevant attributes.

    Markup must match visible page content. Do not claim a price, availability state, review, or image that users cannot confirm on the page. Structured data eligibility also does not guarantee a particular search treatment.

    Google’s image documentation notes that preferred imagery can be indicated through relevant schema properties and og:image, while selection remains automated. Use a representative, high-resolution image without an extreme aspect ratio. Do not assume the social preview image will solve image-search relevance by itself.

    For commerce, keep feed data, structured data, and product pages aligned. Conflicting price, variant, or availability information weakens the reliability of the destination regardless of how attractive the image is.

    Design the Page for Humans and Machine Interpretation

    Multimodal optimization should improve the page a user lands on. Use descriptive headings, concise attribute blocks, comparison tables, and captions where they make the visual evidence easier to act on.

    Page blueprint showing crawlable images, concise context, attributes, structured data, comparison evidence, and a clear next action.

    Keep important information available in the DOM and accessible without fragile interaction. Tabs and galleries can support browsing, but essential facts should not depend on a user action or a canvas rendering that leaves crawlers with little readable context.

    Performance matters because images are often the largest page resources. Supply responsive sizes, reserve layout space, compress responsibly, and monitor page experience. Do not trade away the detail needed for recognition to hit an arbitrary file-size target.

    For AI search, focus on complete evidence rather than special “LLM formatting.” Google’s generative AI optimization guide emphasizes established Search fundamentals and unique, helpful content. The page should make its subject, attributes, and claims easy to verify.

    Measure Multimodal Visibility With the Right Boundaries

    In Search Console, use the multimodal search type filter in the standard Search results Performance report and the generative AI performance report where available. Export the data, preserve filters and date ranges, and compare complete periods.

    Review pages, countries, devices, and dates to find where multimodal impressions concentrate. Google’s report does not reveal every submitted image or exact visual query, so connect the trend with landing-page inventory, image changes, indexing checks, and business outcomes.

    Do not call impressions “visual search volume.” They represent where links from your property appeared under Google’s reporting rules. Property and page aggregation can also differ.

    Topify can complement this Google view by monitoring prompt-level brand visibility and sources across supported AI platforms. Use it for text or conversational questions associated with the same visual decisions, while recognizing that an external tracker cannot reproduce Google’s private Lens impression data.

    The combined view is strongest when the scopes stay separate: first-party multimodal exposure from GSC, answer-level brand and citation evidence from monitoring, and on-site outcomes from analytics.

    Conclusion

    Multimodal search SEO is not image compression plus alt text. It is the design of a reliable image-page pair for a visual decision. The image must be discoverable and representative; the page must supply identity, attributes, context, structured evidence, and a useful destination.

    Start with the decisions people make from images, then build the smallest image set that reduces uncertainty. Verify crawlability, place images beside relevant explanations, align structured data with visible truth, and measure multimodal impressions within Search Console’s limits. That foundation serves Lens, image-led search, and AI experiences without creating a separate page for every possible photo.

    FAQ

    What is multimodal search SEO?

    Multimodal search SEO prepares images and their landing pages for searches that combine visual input with language, such as a photo plus a product, place, or troubleshooting question.

    Does alt text improve Google Lens visibility?

    Alt text helps Google and assistive technologies understand image subject matter, but it is one signal alongside visual content, page context, crawlability, and the usefulness of the destination.

    Can Search Console report multimodal searches?

    Yes. Google introduced a Web: multimodal search type covering listed image-led entry points such as Lens, Circle to Search, image uploads, and Chrome image search.

    Do I need a separate page for every product image?

    No. Use one strong destination for the entity or decision and provide a purposeful image set with crawlable context, attributes, and variants.

    Read More

  • How to Run a Multimodal Content Audit for Google Lens and AI Search

    How to Run a Multimodal Content Audit for Google Lens and AI Search

    A page can contain sharp product photography, complete copy, and valid schema while still failing as a multimodal result. The image may be loaded only as CSS, the useful detail may be cropped on mobile, the filename and alt text may describe nothing, or the landing page may omit the attribute a visual searcher needs to act.

    A multimodal content audit tests the entire image-page pair. It checks discovery, interpretation, evidence, mobile presentation, structured data, and measurement in one repeatable process. The outcome is not a count of images. It is a prioritized list of visual decisions your site can or cannot currently answer.

    Define the Visual Decisions Before Crawling the Site

    Start with the jobs people perform using an image. Common decisions include identifying an object, finding a similar product, comparing variants, diagnosing a problem, locating a place, or buying under a constraint.

    Choose the pages and image types that support those decisions. An ecommerce audit might sample product detail pages, category pages, buying guides, and support content. A travel audit might sample destination pages, maps, seasonal guides, and local listings.

    Record the intended query for every sampled image. “Blue shoe” is a label; “find this trail shoe in a wide size under $150” is a decision. The second reveals which page attributes the audit must verify.

    Check Whether Crawlers Can Discover the Image

    Google’s image SEO guidance recommends standard HTML <img> elements and notes that CSS background images are not indexed in the same way. Inspect the rendered page and source to confirm an accessible src exists, including a fallback when responsive srcset or <picture> markup is used.

    Test the page and image URL without authentication. Review robots rules, noindex, CDN restrictions, expiring URLs, lazy-loading behavior, and status codes. Confirm that canonical tags point to the intended destination and that image URLs remain stable across releases.

    For large libraries, inspect the image sitemap and CDN property setup. Discovery problems are technical blockers; do not compensate for them by rewriting captions.

    Audit Meaning, Context, and Accessibility Together

    Review alt text as a description of content and function, not a keyword field. It should help someone understand what the image contributes when the pixels are unavailable. Decorative images can use empty alt text; meaning-bearing images need specific, concise descriptions.

    Then inspect the visible context. Google’s guidance says page content, captions, titles, alt text, and computer vision can all contribute to understanding. The image should sit near text that names the entity and explains the relevant attributes.

    Use the same test for charts, product photos, and screenshots: can a reader identify the subject, understand why the image is present, and find the facts needed to act?

    Audit workflow moving from image discovery to meaning, page evidence, mobile presentation, structured data, and measurement.

    Avoid repeating a title as alt text when it adds no visual description. Also avoid embedding essential specifications only inside the image. Important facts belong in crawlable page text.

    Score Every Image-Page Pair Against One Rubric

    Use a consistent rubric so teams can compare pages and assign owners. A pass should mean the evidence is visible and verifiable, not merely present somewhere in the CMS.

    Audit dimensionPass conditionTypical failureOwner
    DiscoveryCrawlable page and stable HTML image URLCSS-only image or blocked CDNEngineering
    IdentitySubject and entity are unambiguousGeneric filename and no contextContent
    AccessibilityUseful alt text matches functionMissing, stuffed, or duplicated alt textContent / accessibility
    EvidenceRelevant attributes appear in visible textSpecs exist only in pixels or tabsProduct / content
    QualityDetail is clear at useful sizesBlur, heavy compression, misleading cropCreative
    MobileSubject and controls remain usableObject or caption disappears on mobileDesign / engineering
    Structured dataMarkup matches visible truthConflicting price, image, or availabilitySEO / engineering
    MeasurementPage and image changes can be trackedNo baseline, annotation, or report viewAnalytics

    Score blockers separately from improvements. A blocked image URL is more urgent than a filename that could be clearer.

    Inspect Image Quality and Variant Coverage

    Open the actual files, not only thumbnails in the CMS. Check resolution, compression artifacts, orientation, color accuracy, readable labels, and whether the focal subject survives responsive crops.

    For product pages, verify that the set covers scale, material, key details, available variants, and use. For troubleshooting, include both normal and failed states. For places, include recognizable viewpoints and seasonal or access conditions when they affect the decision.

    Reject deceptive or decorative variants that do not match the landing-page offer. Visual similarity may bring a user to the page, but inconsistent color, size, availability, or product identity breaks trust immediately.

    Google advises using representative, high-resolution preview images and avoiding extreme aspect ratios or generic images. Record which asset is declared in structured data and social metadata, then confirm it is the image the team actually wants associated with the page.

    Test the Mobile and Interaction Path

    Many visual searches begin on a phone. Audit at realistic mobile sizes and network conditions. Confirm that the image loads, the object remains visible, pinch or gallery controls are usable, captions stay associated, and the next action does not shift off screen.

    Inspect lazy-loaded galleries and carousels. Essential images should be discoverable without fragile interaction, and the fallback markup should remain meaningful. Test the page with scripts delayed or partially unavailable to expose hidden dependencies.

    Side-by-side audit showing a passing mobile image-page pair and a failing version with cropped subject, hidden attributes, and broken context.

    Measure layout stability and transfer cost, but do not optimize away the details required for recognition. The goal is a fast, useful visual, not the smallest possible file.

    Validate Structured Data and Product Feeds

    Use the appropriate validation tools for supported structured data. Confirm that image properties resolve, required fields exist, and markup agrees with visible content. Structured data does not guarantee a feature, but inconsistent markup creates avoidable ambiguity.

    For commerce, compare the page, Product markup, and merchant feed. Check identifiers, titles, descriptions, price, currency, availability, variants, shipping, return information, and image links. A visual result that lands on an unavailable or mismatched variant is a failed experience even if the image was retrieved correctly.

    Document the source of truth for each attribute and the expected refresh cadence. Conflicts often come from systems updating at different times rather than from one obviously incorrect page.

    Establish a Search Console Multimodal Baseline

    Google introduced web multimodal reporting for Lens, Circle to Search, uploaded images, and Chrome image search. Use the Web: multimodal filter in applicable Performance reports, then export a complete baseline before making changes.

    Record pages, countries, devices, dates, active filters, and property-level totals. Search Console does not reveal every submitted image or exact visual query, and page rows may aggregate differently from the chart. Treat impressions as property exposure under Google’s rules, not market-wide visual demand.

    Annotate audit fixes and compare equivalent complete periods. Pair GSC with image indexing checks, analytics landing-page outcomes, and support or sales evidence. A rising impression line is useful, but it does not prove the image answered the user’s decision well.

    Prioritize Fixes by Blocker, Decision Value, and Confidence

    Create a queue with page, image, intended visual decision, failure, evidence, owner, effort, and verification method. Prioritize in this order:

    1. Crawl and eligibility blockers.
    2. Wrong or misleading product and entity information.
    3. Missing decision-critical evidence.
    4. Mobile and performance failures.
    5. Context, accessibility, and asset-quality improvements.
    6. Nice-to-have naming or presentation refinements.

    Topify can add a prompt-level layer for the conversational questions surrounding those visual decisions. Monitor whether the brand and relevant pages appear in supported AI answers, while keeping Google’s private multimodal impression data in Search Console.

    Do not activate a large prompt set simply because the audit found many images. Start with a small approved set tied to high-value decisions and preserve the baseline long enough to measure change.

    Conclusion

    A multimodal content audit succeeds when it connects a visual input to a useful, verifiable destination. Discovery, alt text, image quality, mobile presentation, structured data, and reporting are parts of one system rather than separate checklists.

    Begin with the decisions users make from images, sample the pages that serve those decisions, and score each image-page pair with one rubric. Fix blockers and factual mismatches before polishing filenames or decorative assets. Then establish a Search Console multimodal baseline, annotate changes, and verify outcomes with both first-party exposure and on-site behavior.

    FAQ

    What is a multimodal content audit?

    It is a structured review of how images and landing pages support visual-plus-language search, including discovery, context, accessibility, attributes, structured data, mobile usability, and measurement.

    Which pages should be audited first?

    Start with high-value pages where users identify, compare, troubleshoot, visit, or buy from visual information, plus pages already receiving image or multimodal exposure.

    Does every image need descriptive alt text?

    Meaning-bearing images need useful alt text. Purely decorative images can use empty alt text so assistive technology can skip them.

    How do I measure the result of an audit?

    Use Search Console’s multimodal reporting where available, image indexing checks, page engagement or conversion data, and a dated log of the fixes applied.

    Read More

  • ChatGPT vs Google AI Shopping Visibility: What Makes Products Discoverable

    ChatGPT vs Google AI Shopping Visibility: What Makes Products Discoverable

    A merchant can keep one catalog, one product page, and one set of images, yet receive different treatment in ChatGPT and Google AI shopping experiences. One system may ask follow-up questions and build a buyer’s guide from merchant data plus the public web. Another may connect a conversational request to Google’s Shopping Graph, Merchant Center data, and visual search surfaces.

    The optimization mistake is assuming one universal AI shopping feed. The more useful model is a shared product-truth layer with platform-specific discovery paths. Brands need consistent identifiers, current commerce facts, useful pages, and credible external evidence, then separate measurement for how each experience selects and explains products.

    Both Experiences Start With Buyer Constraints, Not Short Keywords

    AI shopping requests often combine category, budget, use case, preferences, and exclusions. OpenAI says Shopping Research can ask follow-up questions about brands, sizes, performance, comfort, style, and price before starting a multi-step discovery process.

    Google describes conversational shopping in AI Mode similarly. A user can describe a need in natural language, refine the request, and receive visual product results rather than operating a fixed set of filters. Google’s visual AI Mode announcement ties those experiences to the Shopping Graph and frequently refreshed product listings.

    For merchants, the implication is simple: generic category relevance gets a product into the broad search space, while constraint coverage determines whether it remains a credible option.

    The Discovery Inputs Overlap but Are Not Identical

    OpenAI says Shopping Research may use merchant product data supplied through the Agentic Commerce Protocol, publicly available product information, and other relevant retail sources. The final guide can include top picks, trade-offs, side-by-side attributes, and links to merchants.

    Google’s shopping experiences draw on its own commerce ecosystem, including Merchant Center and the Shopping Graph, alongside indexed web information and visual understanding. Exact ranking and recommendation systems are not public, so marketers should avoid claiming a single deterministic formula.

    Input layerChatGPT Shopping ResearchGoogle AI shopping experiencesMerchant action
    Merchant catalogACP merchant data where availableMerchant Center and Shopping Graph ecosystemKeep identifiers, attributes, price, and availability current
    Public product pageCan read publicly available retail informationSearch-indexed page and product informationMake facts crawlable, specific, and consistent
    ImagesSupports visual product discovery and comparisonCentral to visual AI Mode, Lens, and shopping resultsUse representative, high-quality, variant-accurate images
    External evidenceMay use other relevant retail sourcesSearch and shopping systems can use broader web evidenceBuild legitimate reviews, editorial proof, and policy clarity
    Buyer interactionFollow-up questions and live refinementConversational refinement and visual explorationCover real constraints instead of keyword variants
    MeasurementObserve prompts, products, explanations, and merchant linksUse Merchant Center, Search Console, and answer observationKeep platform-specific baselines

    This table describes documented input categories, not hidden weights. No external tool can see the complete internal selection logic.

    Build One Product-Truth Layer Before Platform Tactics

    The shared foundation is accurate product truth. Every system should receive the same core identity and commerce facts even if the delivery format differs.

    Create a canonical record for product ID, title, brand, category, description, price, currency, availability, condition, variants, dimensions, materials, compatibility, shipping, returns, warranty, and primary image. Add regulated or category-specific attributes where needed.

    Resolve conflicts between the page, structured data, merchant feed, and ACP feed. A stale price on one surface or a mismatched variant image can weaken the buying experience and make measurement hard to interpret.

    Shared product-truth layer feeding ChatGPT merchant data, public pages, Google Merchant Center, images, and external evidence.

    Assign an owner and refresh cadence to every dynamic field. Price and stock may require near-real-time updates, while materials and dimensions change only with the product version.

    Make Product Pages Useful Beyond the Feed

    A feed is structured inventory, not the full explanation. Product pages should help a buyer understand fit, trade-offs, compatibility, and policies that a recommendation needs to summarize.

    Expose essential information in crawlable text. Use clear headings, concise attribute blocks, comparison tables, variant-specific images, and accessible alt text. Keep JavaScript interactions from hiding the only copy of a key fact.

    OpenAI notes that shopping information can still be incomplete or wrong and tells users to confirm final price, taxes, fees, shipping, availability, size, color, returns, and warranty on the retailer’s site. That makes the landing page the final source of truth even when discovery happens in an AI conversation.

    Do not write unsupported claims to sound recommendation-ready. Specific limitations build more trust than generic superlatives.

    Treat Images as Product Data, Not Decoration

    Visual shopping depends on accurate representation. Provide a high-resolution primary image, variant-specific views, scale, important details, and realistic use where helpful. Avoid promotional text overlays that obscure the item.

    Google’s image SEO guidance recommends crawlable HTML images, representative high-resolution previews, descriptive context, and useful alt text. Image URLs should be stable and accessible, with responsive markup that includes a fallback src.

    For each variant, align image, color, size, price, and availability. If a blue shoe image opens a generic page with the blue size unavailable, visibility may increase while customer trust falls.

    Use captions or nearby copy for facts a pixel cannot verify, such as dimensions, compatible devices, certification, or what is included in the box.

    External Evidence Shapes Confidence and Explanation

    AI shopping experiences may consult reviews, editorial sources, and other retail information to explain strengths and trade-offs. A merchant feed can establish what the product is and whether it is available; independent evidence can help support how it performs and for whom it fits.

    Build this evidence legitimately. Encourage authentic reviews, keep support and policy information current, publish verifiable testing methods, and make expert documentation easy to cite. Do not manufacture community posts, ratings, or endorsements.

    The right source depends on the question. A return-policy concern should resolve to the merchant’s current policy. A durability claim may need independent testing. A compatibility question may need official technical documentation.

    Audit Visibility With Platform-Specific Questions

    Do not use one score to hide different shopping journeys. Build a small prompt set from real buyer constraints and record the exact platform, region, date, product availability, and wording.

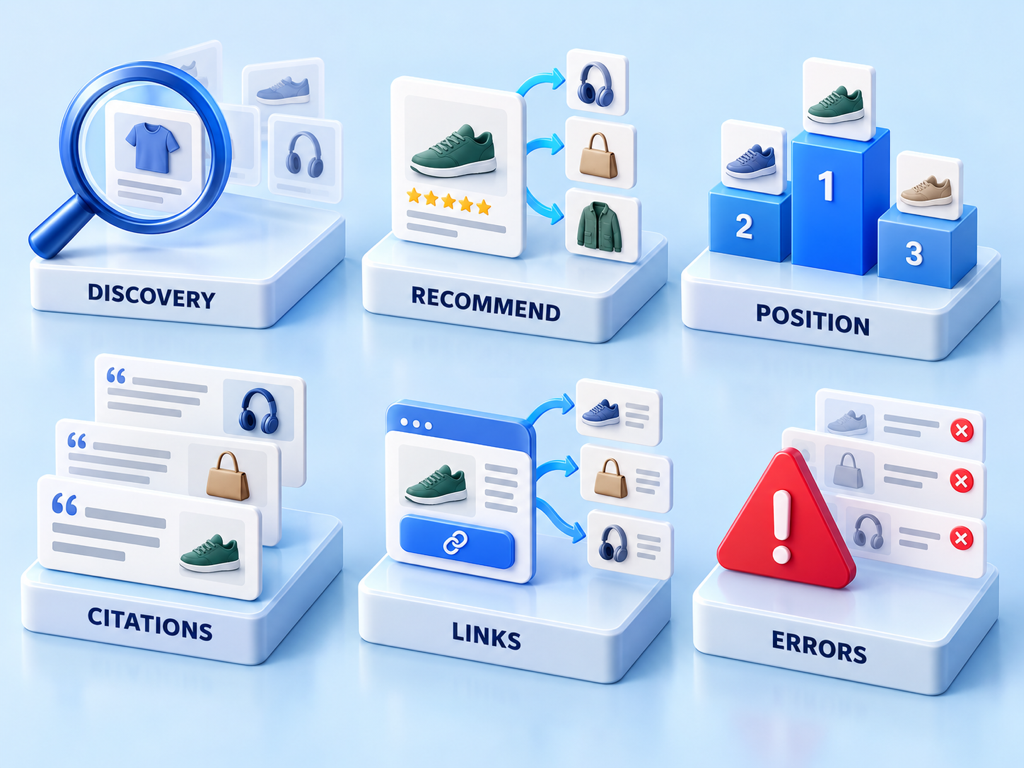
    Comparison scorecard separating discovery, recommendation, position, explanation, citation, and merchant-link outcomes for ChatGPT and Google AI shopping.

    Track at least:

    • product discovered or absent;
    • brand mentioned or explicitly recommended;
    • recommendation position when ordered;
    • stated rationale and trade-offs;
    • merchant link and destination;
    • source or citation when visible;
    • incorrect attributes or stale availability;
    • competitors appearing for the same constraint.

    Repeat observations because answers can vary. Preserve the same baseline prompts rather than adding new ones mid-comparison.

    For Google, pair answer observation with Merchant Center diagnostics and Search Console, including multimodal reporting where relevant. For ChatGPT, inspect the Shopping Research output, product comparisons, merchant links, and any visible sources. Neither view represents every shopper conversation.

    Use Topify as the Cross-Platform Observation Layer

    Topify can support the prompt and competitor layer after the product-truth foundation is stable. Use prompt discovery to identify high-value shopping questions, then monitor whether the brand appears, how it is positioned, which competitors recur, and which sources support the answer across available platforms.

    Keep platform-native diagnostics in their original systems. Topify does not replace Merchant Center’s feed errors or Google’s first-party impression data. Its role is to make the generated-answer layer comparable and repeatable.

    Start with a limited, approved prompt set split by category, constraint, and funnel stage. Review errors manually before assigning content or feed work. A missing recommendation may reflect true product fit, unavailable inventory, weak evidence, or normal response variation.

    The output should be an action queue tied to facts: fix a field conflict, add a missing product attribute, improve a destination page, investigate an external source gap, or gather more observations.

    Conclusion

    ChatGPT and Google AI shopping experiences share a need for accurate products, useful pages, strong images, and credible evidence, but their discovery inputs and reporting systems are not identical. Optimizing one universal “AI shopping feed” oversimplifies the problem.

    Build one canonical product-truth layer, distribute it through the appropriate merchant systems, and keep public pages consistent with every feed. Then measure each platform with the same buyer constraints but separate evidence. Cross-platform monitoring becomes useful only after platform-native diagnostics and product facts are trustworthy.

    FAQ

    What data does ChatGPT Shopping Research use?

    OpenAI says it may use ACP merchant product data, publicly available product information, and other relevant retail sources during multi-step discovery.

    Does Google AI Mode use Merchant Center data?

    Google connects conversational shopping experiences with its Shopping Graph ecosystem, where Merchant Center is a primary way for merchants to supply current product data.

    Is a product feed enough for AI shopping visibility?

    No. Feeds supply structured commerce facts, while public pages, images, policies, reviews, and independent evidence help answer fit and trade-off questions.

    How should brands compare ChatGPT and Google AI shopping visibility?

    Use the same stable buyer constraints, record platform-specific discovery and recommendation outcomes, and keep Merchant Center, Search Console, and ChatGPT observations as distinct evidence sources.

    Read More

  • How to Run a 100-Prompt AI Shopping Visibility Benchmark

    How to Run a 100-Prompt AI Shopping Visibility Benchmark

    A shopping benchmark can look rigorous while measuring almost nothing. One hundred prompts copied from a keyword tool may represent the same broad question. One run per prompt can turn normal answer variation into a leaderboard. Mixing countries, logged-in personalization, changing product availability, and different scoring rules creates percentages that cannot be reproduced.

    A credible AI shopping visibility benchmark begins with a written method and ends with uncertainty, not a dramatic chart. This framework shows how to design 100 prompts, capture recommendation evidence, calculate transparent metrics, and publish a result that another analyst could audit. It provides the scorecard, not invented findings.

    Define the Decision the Benchmark Will Support

    Choose one decision before selecting prompts. A benchmark might compare brands within a category, establish one brand’s baseline, compare platforms, or measure change after product-data improvements. Those purposes require different samples.

    Write the population statement in plain language. For example: “High-intent U.S. prompts for selecting noise-canceling headphones across three buyer stages.” That statement sets boundaries for language, region, product category, availability, and interpretation.

    Do not call a convenience sample “all AI shopping.” A benchmark of one category and market can be useful without pretending to represent every product or shopper.

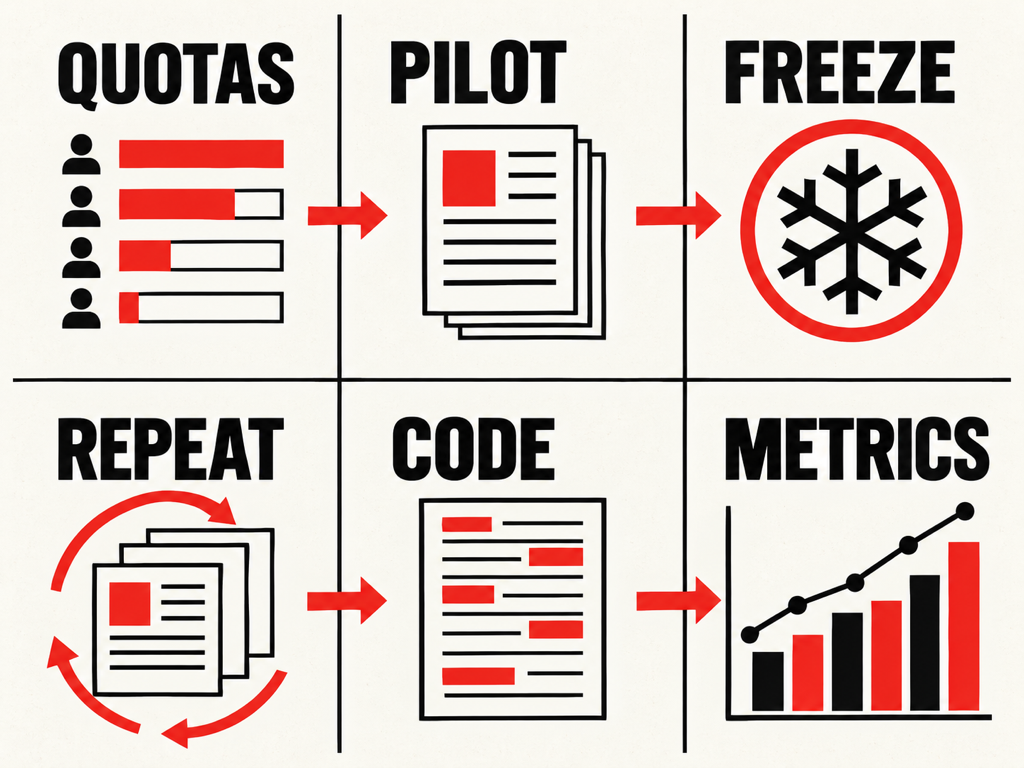
    Build 100 Prompts With a Quota Matrix

    Use a quota matrix so the sample covers distinct buyer decisions rather than 100 paraphrases. A balanced single-category design could allocate prompts across five intent families and five constraint families.

    Prompt quotaCountExample purpose
    Category discovery20Find credible options without naming a brand
    Use-case fit20Select for travel, work, home, sport, or another context
    Constraint fit20Apply budget, size, compatibility, risk, or policy limits
    Comparison20Compare named or discovered alternatives
    Purchase-ready20Ask where to buy, availability, shipping, or current value

    Within each family, distribute role, budget, compatibility, geography, and exclusion signals. Keep a unique prompt ID, exact text, intent, constraint tags, expected answer type, and inclusion reason.

    Pilot ten prompts before freezing the full set. Remove ambiguous wording, duplicate decisions, prompts that require unavailable private information, and questions no credible answer could resolve.

    Freeze the Test Conditions Before Collection

    Document platform, product experience, account state, memory or personalization settings where controllable, region, language, device, date, and time window. Record whether the system asks follow-up questions and how researchers respond.

    OpenAI says Shopping Research can use constraints, merchant ACP data, public product information, and other retail sources in a multi-step discovery process. Google AI shopping experiences can use conversational refinement and its Shopping Graph. The benchmark must therefore define whether follow-ups are answered, skipped, or scripted.

    Check product availability and major price changes before each collection window. A recommendation can change because inventory changed, not because brand visibility improved.

    Do not change prompts halfway through a baseline. Version any revision and report it as a new wave.

    Repeat Observations Instead of Trusting One Answer

    Generated responses can vary. Run each prompt more than once when budget and platform rules allow, spacing observations according to the study purpose. A cross-sectional snapshot may use several repetitions in a short window; a trend benchmark may repeat the frozen set weekly.

    Define the observation count before seeing results. Do not rerun only the prompts where a preferred brand lost.

    Benchmark workflow from quota design and pilot prompts to frozen conditions, repeated observations, coding, and audited metrics.

    Store the raw response or permitted evidence, collection timestamp, links, follow-up path, and any error. Record refusals, unavailable experiences, and timeouts rather than silently replacing them.

    If platform terms or interface constraints prevent automated collection, use a documented manual method or reduce scope. Method consistency is more important than an impressive sample claim.

    Create a Coding Guide Before Analysts Score Answers

    Define every outcome with examples. At minimum, distinguish mentioned, recommended, top pick, cited, and merchant-linked.

    A brand mention in background context is not the same as a recommendation. A product carousel placement may differ from a written top pick. A merchant link may point to the brand, a marketplace, or an unrelated seller.

    Use a structured record for each prompt-observation-brand combination:

    • brand and product name as shown;
    • mention present;
    • explicit recommendation present;
    • ordered position when meaningful;
    • top-pick status;
    • cited owned domain;
    • cited third-party domain;
    • merchant link and destination type;
    • rationale and trade-offs;
    • incorrect or stale claim;
    • coding confidence and reviewer note.

    Have a second reviewer code a sample before full production. Resolve disagreements and update the guide without changing earlier rows silently.

    Calculate Metrics With Transparent Denominators

    Every percentage needs an eligible denominator. Exclude or separately report failed observations; do not turn them into zeros without explanation.

    MetricFormulaInterpretationLimitation
    Recommendation rateobservations explicitly recommending brand / eligible observationsHow often the brand is selectedDepends on prompt sample and repetitions
    Top-pick rateobservations naming brand first or best / eligible ordered observationsFrequency of leading recommendationNot all answers are ordered
    Prompt coverageunique prompts recommending brand / eligible unique promptsBreadth across buyer decisionsIgnores repeated-result stability
    Owned citation rateobservations citing owned domain / eligible observationsUse of brand-controlled evidenceCitation does not equal recommendation
    Merchant-link rateobservations with usable merchant link / eligible observationsPurchase-path availabilityDestination quality still needs review
    Competitor overlapprompts where brand and competitor co-occur / eligible promptsShared consideration setDoes not show which brand is preferred
    Attribute error rateobservations with material wrong fact / audited observationsReliability of product representationRequires current source-of-truth review

    Report counts beside rates. “18 of 60 eligible observations” is more interpretable than “30 percent” alone.

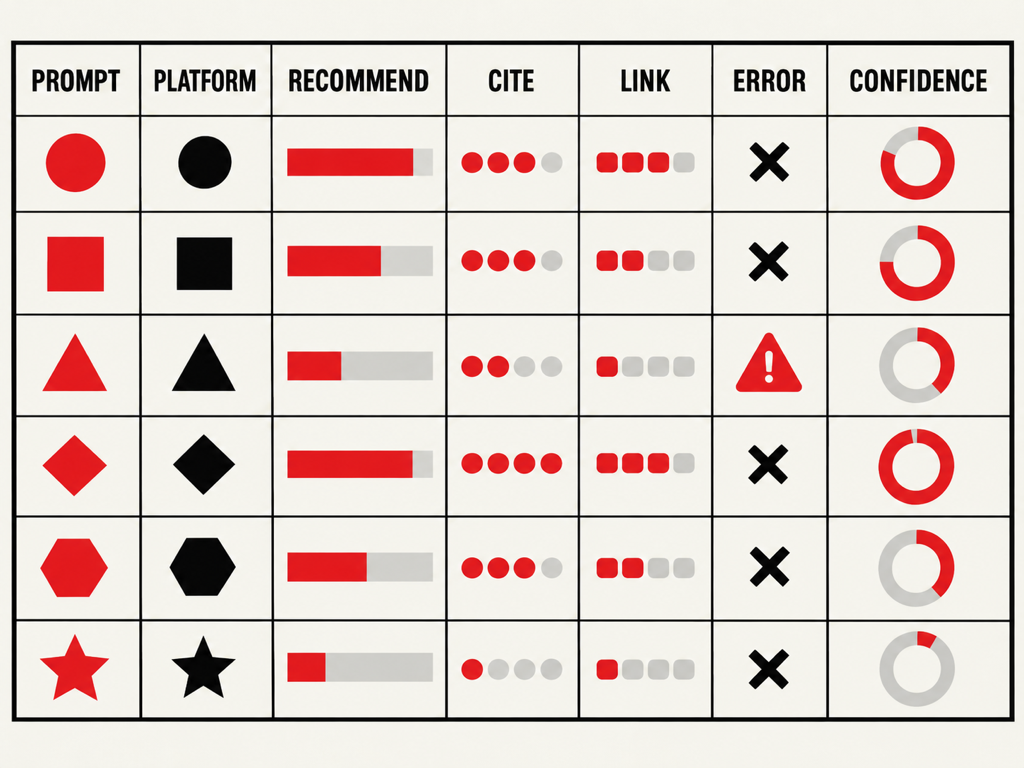
    Separate Brand, Product, Platform, and Prompt Effects

    A result can move because of the product assortment, platform, prompt mix, or observation timing. Break out metrics by intent family, constraint family, platform, and product where sample size permits.

    Benchmark scorecard separating prompt family, platform, recommendation rate, citations, merchant links, errors, and confidence.

    Avoid ranking brands from tiny subgroups. If only four prompts represent regulated use cases, treat the result as directional. Publish the count and uncertainty rather than a false decimal precision.

    When comparing platforms, keep the prompt meaning aligned while respecting different interactions. A system that asks follow-up questions and a system that returns an immediate grid are not identical test environments. Report that behavioral difference as part of the result.

    Add Quality Control and an Audit Trail

    Before analysis, check for duplicate prompt IDs, missing responses, inconsistent brand normalization, broken merchant links, impossible positions, and denominator drift. Keep raw evidence separate from the analysis table.

    Maintain a change log for the prompt set, coding guide, product truth source, and collection scripts or procedures. Hashes or version numbers can help demonstrate that the baseline was not edited after results appeared.

    Review a random sample of coded observations and every surprising outlier. A 100 percent recommendation rate for one small brand may reflect a branded prompt, entity-name collision, or coding mistake.

    Protect user and customer data. Use synthetic or generalized buyer constraints unless participants explicitly consent to research use.

    Publish the Method Beside the Findings

    A benchmark report should disclose purpose, category, market, dates, platforms, prompt-selection method, quotas, exact or representative prompts, repetition count, account conditions, follow-up protocol, coding definitions, exclusions, and limitations.

    Clearly label observations and interpretations. Do not claim causality from a cross-sectional comparison. Do not generalize one category to all AI shopping.

    The report should also state what was not measured: total platform demand, private model signals, every shopper conversation, or guaranteed future recommendations.

    Topify can support recurring prompt observation, competitor comparison, position, and source analysis after the exact 100-prompt set is approved. Keep any paid activation separate from the research design and confirm the platforms, regions, cadence, and credit impact before collection.

    Until real observations exist, publish the method and blank scorecard only. A methodology article is more credible than percentages invented to complete a headline.

    Conclusion

    A 100-prompt AI shopping visibility benchmark is credible only when the sample, conditions, repetitions, coding, and denominators are fixed before results are known. The number 100 creates no rigor by itself.

    Define one decision, build a quota matrix, pilot and freeze the prompts, repeat observations consistently, and code mentions, recommendations, citations, merchant links, and errors with a written guide. Publish counts, limitations, and version history beside every rate. That method produces a baseline teams can rerun and challenge without pretending to measure all AI shopping behavior.

    FAQ

    Why use 100 prompts for an AI shopping benchmark?

    One hundred prompts can support a practical quota design across intent and constraint families. It is a planning size, not proof of statistical representativeness.

    Should each prompt be run more than once?

    Yes when resources and platform rules allow. Repeated observations help separate a stable recommendation pattern from normal answer variation.

    What is the difference between a mention and a recommendation?

    A mention names the brand or product. A recommendation explicitly selects it as suitable for the user’s decision or constraints.

    Can a 100-prompt benchmark estimate total AI shopping market share?

    No. It estimates outcomes within the defined prompt sample, platforms, region, and observation window. It is not total platform demand or market share.

    Read More

  • AI Prompt Intent Signals: How Constraints Reveal What Buyers Actually Want

    AI Prompt Intent Signals: How Constraints Reveal What Buyers Actually Want

    A buyer asks an AI assistant for project management software, but the category is only the starting point. Their role, budget, existing tools, security requirements, and deadline can all change the shortlist. A keyword report usually compresses those details into one phrase. The prompt preserves them.

    That creates a different planning problem for SEO and content teams. Ranking for the category doesn’t tell you whether AI systems consider your product suitable for an agency, a regulated enterprise, or a budget-conscious startup. AI prompt intent signals give you a practical way to identify those differences, turn them into testable prompt groups, and decide which evidence your content still needs to provide.

    Keyword Intent Is Too Coarse for Conversational Search

    Traditional search intent usually sorts queries into broad groups such as informational, commercial, navigational, and transactional. That remains useful, but it loses detail when a user describes a full situation instead of typing a short query.

    Consider these three prompts:

    • “What is project management software?”
    • “Which project management tools give agencies client-facing dashboards?”
    • “Recommend project management software for a healthcare company that needs SSO, audit logs, and a fast security review.”

    All three belong to the same product category. They do not represent the same decision. The first asks for an explanation, the second introduces a workflow requirement, and the third adds industry, integration, risk, and timing constraints.

    OpenAI’s research on how people use ChatGPT classifies user intent with an Asking, Doing, or Expressing rubric. Asking seeks information or advice, while Doing requests an output or action. For marketers, that distinction is a useful first layer, but commercial prompts need another layer that captures the conditions determining which answer is acceptable.

    A prompt can be informational in format and still contain a strong buying signal.

    AI Prompt Intent Signals Are the Conditions Behind the Request

    An AI prompt intent signal is a word, phrase, or contextual detail that changes the answer the user expects. It can identify the user’s role, define an acceptable price, eliminate incompatible products, or introduce a risk that must be resolved before purchase.

    This is a working analysis framework, not a universal standard published by an AI platform. Its value is operational: the framework lets you group prompts by the conditions that influence recommendations rather than by superficial wording alone.

    Google confirms that its generative search experiences can use query fan-out, generating multiple related searches to gather the information needed for one response. A prompt about software for a healthcare team could therefore lead the system to investigate security, integrations, pricing, usability, and industry suitability before producing one synthesized answer.

    OpenAI describes a similar decision dynamic in Shopping Research. The experience asks follow-up questions about factors such as preferred brands, size, performance, style, and price, then uses those clarified constraints in a multi-step product discovery process.

    The implication is straightforward: the category determines where the search starts, while the signals help determine where the answer ends.

    Eight Signals Explain Why Similar Prompts Produce Different Shortlists

    The most useful taxonomy is one your team can apply consistently. The eight signal types below cover many B2B and considered-purchase prompts without pretending every prompt fits perfectly into one box.

    Intent signalWhat it revealsExample phraseContent evidence the user may need
    Task or outcomeThe job the buyer needs completed“reduce manual reporting”Workflow, use case, before-and-after process
    RoleWho will evaluate or use the product“for a marketing operations lead”Role-specific benefits and responsibilities
    OrganizationTeam size, industry, or business model“for a 20-person agency”Relevant deployment model and use-case proof
    BudgetPrice ceiling or value expectation“under $30 per user”Current pricing, plan limits, and total-cost context
    CompatibilityRequired tools, formats, or infrastructure“works with HubSpot and Slack”Integration documentation and limitations
    RiskSecurity, compliance, trust, or switching concerns“needs SOC 2 and SSO”Security documentation, controls, and procurement evidence
    TimelineUrgency, implementation window, or buying stage“must launch this quarter”Setup steps, dependencies, and realistic time requirements
    ExclusionWhat the buyer explicitly rejects“not an enterprise suite”Clear fit boundaries and credible alternatives

    These signals can appear together. “Best analytics platform” is a category-level commercial prompt. “Best analytics platform for a two-person ecommerce team that needs Shopify data and costs less than $200 a month” contains role, organization, compatibility, budget, and exclusion signals.

    Counting signal density can help prioritize research, but more signals do not automatically mean more commercial value. A highly detailed troubleshooting prompt may be urgent without indicating a purchase. Intent still depends on the requested outcome.

    AI Systems Use Constraints to Narrow the Answer Space

    At a practical level, intent signals act like filters and evaluation criteria. The system first identifies the category or task, then looks for information that satisfies the stated conditions. Missing evidence can remove a brand from consideration even when the brand is generally relevant to the category.

    Suppose three buyers ask about project management software. A founder emphasizes price, an agency leader needs client access, and an enterprise IT manager requires security controls. The system may retrieve overlapping sources, but the final recommendation sets can differ because each buyer defines success differently.

    AI prompt separated into role, budget, compatibility, timeline, and risk signals before producing a shortlist

    This does not mean marketers should create a separate page for every possible wording. Google’s official guidance warns against producing pages for every query variation and recommends unique, non-commodity content that genuinely helps users. The right unit is usually a meaningful decision pattern, not an isolated sentence.

    Bottom line: optimize for evidence coverage across a prompt cluster, not for an exact conversational phrase.

    Build a Prompt Signal Map in Five Steps

    A useful signal map connects real prompts to business decisions. It should be small enough to maintain, but varied enough to reveal where recommendations change.

    1. Start with one decision, not a broad topic

    Define the decision you want to study, such as choosing an AI visibility platform, selecting accounting software, or finding a logistics provider. Avoid mixing education, troubleshooting, and product selection in the same initial group.

    2. Collect prompt language from several sources

    Use customer calls, sales objections, support tickets, site search, community discussions, AI referral data, and prompt discovery tools. Remove personal data and confidential customer details before storing prompts.

    The goal is not to manufacture hundreds of variations. It is to capture the conditions real buyers use when asking for help.

    3. Tag signals without rewriting the prompt

    Keep the original wording for repeatable testing. Add separate fields for task, role, organization, budget, compatibility, risk, timeline, and exclusions. A prompt can have several tags in each field.

    4. Create controlled variants

    Change one important signal at a time. For example, keep the category and organization constant while testing three budget levels, or keep the budget constant while changing the security requirement.

    Controlled variants make the result interpretable. When every detail changes at once, you cannot tell which condition altered the shortlist.

    5. Freeze the test set and record context

    Store the platform, model or experience, region, language, date, and exact prompt. AI answers vary, so repeat observations are more useful than a single screenshot. If you revise a prompt, treat it as a new version rather than silently replacing the baseline.

    Turn Prompt Signals Into Content Decisions

    Signal mapping becomes valuable when it changes what you publish. Each repeated constraint points to evidence a buyer expects an AI answer to locate and explain.

    A compatibility signal may reveal that an integration page lacks setup details. A risk signal may show that security documentation is inaccessible or too vague. A role signal may expose a generic feature page that never explains the workflow for the person making the decision.

    The same category can therefore require different evidence paths without requiring duplicate articles.

    Different budget, client access, and security constraints producing different software recommendations

    Use three questions to turn a signal cluster into a content assignment:

    1. What decision is the user trying to make?
    2. What evidence would let a credible adviser answer that decision?
    3. Does that evidence already exist in a crawlable, specific, and current form?

    When the answer to the third question is no, the gap may justify a new use-case page, integration guide, methodology article, comparison, or data study. When the evidence exists but the brand still does not appear, investigate citation sources, authority, technical accessibility, and competitive coverage before publishing more pages.

    Measure Signal-Level Visibility Instead of Counting Prompts

    Raw prompt counts can create false confidence. Ten phrasings that express the same decision are not ten independent markets, and branded prompts can make visibility look healthy while category discovery remains weak.

    Track performance at both the cluster and signal level:

    • Visibility: How often does the brand appear for the cluster?
    • Recommendation rate: How often is the brand explicitly recommended rather than merely mentioned?
    • Competitor overlap: Which brands appear when specific constraints are present?
    • Citation coverage: Which sources support the answer?
    • Position: Where does the brand appear within a ranked or ordered response?
    • Volatility: Does the result persist across repeated observations?

    Compare controlled prompt variants. If a brand appears until “SOC 2” is added, the security signal deserves investigation. If the brand disappears only when “under $50” is added, pricing fit or pricing clarity may be the issue.

    This method turns a vague visibility problem into a falsifiable question.

    Use Topify to Move From Signals to a Repeatable Workflow

    Topify can support the workflow after you define the decision and signal taxonomy. Its current Prompt Discoveryexperience organizes prompt demand, brand visibility gaps, competition, and opportunity scoring, while its monitoring workflow records how visibility changes over time.

    In practice, start with one category and a limited set of controlled prompts. Separate broad educational prompts from comparison and decision prompts, then add fields for the signal types that matter to your market. Review the competitor set and citation sources for each cluster before assigning content.

    Topify’s product page describes prompt opportunity scoring through demand, visibility gaps, commercial intent, and content readiness. Treat that score as prioritization support, not proof that a new page will rank or earn a citation. Human review still needs to decide whether the missing evidence is meaningful, supportable, and distinct from what the site already publishes.

    Once the test set is stable, repeat the measurement on a fixed schedule. New prompts can enter a discovery queue, but baseline prompts should stay unchanged long enough to distinguish real visibility movement from wording drift.

    Conclusion

    AI prompt intent signals expose the conditions that ordinary keyword labels leave behind. Role, budget, compatibility, risk, timeline, and exclusions can all change the evidence an AI system retrieves and the brands it recommends. Mapping those signals helps you test recommendation changes without creating a separate page for every prompt variation.

    Start with one buyer decision, tag the constraints in real prompt language, and create controlled variants. Then measure visibility, recommendations, competitors, and citations at the signal level. When the evidence reveals a genuine gap, use it to produce one useful, specific asset rather than another generic category article.

    FAQ

    What are AI prompt intent signals?

    AI prompt intent signals are contextual details that change the answer a user expects, such as role, budget, compatibility requirements, risk concerns, timeline, and exclusions.

    How are prompt intent signals different from search intent?

    Search intent describes the broad goal behind a query. Prompt intent signals capture the specific conditions that shape which explanation, product, or recommendation will satisfy that goal.

    Should every prompt variation have its own page?

    No. Group prompts by meaningful decision patterns and evidence needs. Google advises against creating pages for every wording variation, especially when the pages would add little distinct value.

    How can a brand track prompt intent signals?

    Store the exact prompt, tag its constraint signals, create controlled variants, and repeatedly measure brand visibility, recommendation rate, competitors, citations, position, and volatility across relevant AI platforms.

    Read More

  • Google AI Brief and AI Max Reporting: The New Numbers Marketers Get

    Google AI Brief and AI Max Reporting: The New Numbers Marketers Get

    Your client’s AI Max campaign drove a quarter of last month’s conversions. Then they ask the obvious follow-up: which searches, which headlines, and which landing pages produced them? You open four reports, export three CSVs, and still can’t draw a straight line from query to click. Google’s latest update targets that gap directly. Google is bringing the closed beta of AI Brief to Dutch, French, German, Italian, Japanese, Portuguese, and Spanish, and introducing a new reporting feature for a clearer view of AI-driven performance. The controls are getting sharper, and the numbers are getting clearer. What matters now is reading the right ones.

    What Google AI Brief Changes Inside AI Max

    Start with the foundation. AI Max isn’t a campaign type. It’s an optimization layer inside an existing Search campaign, with three components you can toggle independently. Its search term matching uses broad match and keywordless technology to expand beyond your keywords, while asset optimization customizes ad copy and uses Final URL Expansion to send users to pages Google judges more relevant.

    Google AI Brief sits on top of that layer. Powered by Gemini, it lets you steer AI Max in your own words by giving it context on your business, what your messages should say, and who you want to reach. Google splits the input into three guideline types:

    GuidelineWhat you tell GoogleExample from Google
    MessagingWhat ads should and shouldn’t sayNever mention prices
    MatchingWhich searches to capture or avoidAvoid searches for in-person degrees
    AudienceWho to reach and how to tailor messagesFor health-conscious users, highlight clean products

    The examples in that table come from Google’s AI Brief announcement page and the AI Max Turns 1 post. You also get a review step. AI Brief shares previews of sample assets and searches so you can give feedback and iterate before committing, and existing text guidelines automatically move into messaging guidelines.

    Matching guidelines work differently from negatives. WordStream’s breakdown notes that they’re broad direction rather than keyword lists: instead of excluding “free” and “cheap,” you’d say you’re a premium brand that wants to avoid discount-seeking queries.

    Here’s the thing: a brief is guidance, not a guarantee.

    Google says AI Brief steers messaging, matching, and audience in your own words, but it hasn’t said those guidelines act as hard exclusions. For required legal copy, the hard guarantee is a separate feature. Google launched text disclaimers so required text always appears in ads while advertisers still use Final URL Expansion. That matters for finance, healthcare, and any vertical where a missing disclosure is a compliance problem, not a copy problem.

    AI Max Reporting Today Lives in Four Separate Places

    Before the new view arrives, you’re working across multiple surfaces. Google’s help documentation lists the search terms report, the keyword report, the asset report, and the landing pages report as the reporting options for AI Max.

    Each one answers a different slice of the question. The search terms report includes a source column that separates traffic your own keywords earned from traffic surfaced by AI Max’s broad match expansion or keywordless matching. Within that report, you can also analyze the search term, headline, and URL together.

    What the search terms report can’t do is give you AI Max’s share of total conversions. Search Engine Land’s walkthrough points to a better place: the Keywords tab summary rows, which break out your keywords, AI Max expanded matches, and AI Max landing page matches. The math is simple. If a campaign generated 100 conversions and 24 came from AI Max expanded and landing page matches combined, AI Max represents 24% of total conversions.

    The visibility is still partial. In practice, you’re stitching together a story from pieces that weren’t designed to connect. One practitioner running a head-to-head test found that AI Max traffic gets its own match type, a source column, and two footer rows in the keywords report, but low-volume queries stay hidden and totals overlap with exact and phrase keywords. That’s a lot of manual reconciliation for a feature Google is now making the default.

    The Unified AI Max Report Connects Query, Creative, and Page

    The new reporting feature is designed to close that loop. Google says it will show a single, unified view of the Search ads journey, covering what search terms triggered your ads, which creative assets the user saw, and where they landed on your website.

    The timing isn’t accidental. Between September 1 and 30, 2026, Google is automatically upgrading Search campaigns using campaign-level broad match or Automatically Created Assets to AI Max. Dynamic Search Ads follow later, with that sunset and auto-upgrade starting in February 2027. A lot of accounts are about to run AI Max whether their owners planned for it or not.

    Question you need answeredTodayWith the unified report
    Which query triggered the adSearch terms reportOne view
    Which generated headline showedAsset report plus search terms columnsOne view
    Which page Google choseLanding pages reportOne view
    AI Max share of conversionsKeywords tab footer rowsStill worth checking separately

    Don’t mark your calendar yet. The unified report is announced, not available, and until it ships, AI Max reporting stays split across the search terms, assets, and landing page reports.

    Also keep the scope in mind. The feature traces what appeared and where a visitor landed. That’s journey visibility, not proof of incrementality. For lift, Google Experiments is still the right tool, since it splits traffic 50/50 between a campaign with AI Max enabled and one without.

    Five AI Max Reporting Numbers Worth Putting in Your Next Deck

    The unified view will make these easier to pull. You don’t need to wait for it to start tracking them.

    NumberWhere to find it nowWhat it tells you
    AI Max share of conversionsKeywords tab footer rowsHow dependent the campaign is on expansion
    Match source splitSearch terms source columnBroad match expansion vs. keywordless reach
    Generated asset performanceAsset report, Google AI labelWhether customized copy stays on brand
    Final URL Expansion page shareLanding pages reportHow often Google overrides your chosen URL
    Measured lift vs. Google benchmarkExperimentsWhether your results match Google’s claims

    Two of these deserve extra attention. On match source, smec’s bulk study found that broad match and keywordless expansion often share a roughly 50/50 contribution to the campaign. On generated copy, generated assets carry a Google AI label in reporting, so you can review their performance and consistency with your brand, offer, and claims.

    Then there’s the benchmark. Google says advertisers that activate AI Max typically see 14% more conversions or conversion value at a similar CPA or ROAS, based on 2025 internal data for non-Retail advertisers. For campaigns still mostly using exact and phrase keywords, Google puts the typical uplift at 27%. Treat those as a hypothesis to test, since Google’s lift numbers aren’t always backed up by outside testing.

    The downside scenario is real too. In one account smec reviewed, AI Max scaled into competitor traffic so aggressively that it took over 69% of total Search impressions. That’s exactly the kind of drift a well-written matching guideline, plus a weekly look at the source column, should catch early.

    Google AI Brief Governs the Ad. Nothing Governs the AI Answer.

    This is the gap most AI Max reporting conversations skip.

    Google AI Brief controls what Google’s AI says about you inside a paid ad. It doesn’t touch what AI Overviews, AI Mode, ChatGPT, Gemini, or Perplexity say about you in an organic answer. Those answers get written with no brief, no messaging guidelines, and no preview step. The same buyer often sees both on the same day.

    That creates a consistency problem you can’t see in Google Ads. Your ad says “enterprise-grade security.” The AI answer above it calls you “a budget option for small teams.” The unified report will faithfully show the query, the headline, and the landing page. It won’t show the answer the user read before they clicked, or the competitors that answer recommended instead.

    Closing that gap takes a different data source. Topify tracks how AI platforms including ChatGPT, Gemini, Perplexity, and Google AI Overviews mention and describe your brand, across seven metrics: visibility, sentiment, position, volume, mentions, intent, and CVR. In practice, a paid search team can see whether AI answers position the brand the same way the ads do, which domains those answers cite, and which competitors show up first. When a sentiment score drops or a rival starts appearing ahead of you, you can trace it back to the specific sources AI is pulling from. That’s the context your AI Max reporting doesn’t carry.

    How to Write a Better Google AI Brief With AI Visibility Data

    The strongest briefs aren’t written from brand guidelines alone. They’re written from evidence about how buyers and AI systems already talk about your category.

    Messaging guidelines from sentiment data

    If AI answers keep calling your product “expensive” or “complex,” that’s the objection buyers bring to your ad. Use sentiment findings to tell AI Brief which claims to lead with and which framings to avoid, so paid copy corrects the narrative instead of repeating it.

    Matching guidelines from prompt discovery

    Conversational prompts reveal intent that keyword tools often flatten. Topify’s high-value prompt discovery surfaces the questions people actually ask AI about your category, which translates directly into plain-language matching boundaries like “prioritize comparison searches from mid-market IT teams.”

    Audience guidelines from competitor benchmarking

    Competitor position data shows which segments AI already associates with rivals. That tells you where your audience guidelines should push harder and where tailored messaging needs to explain the difference.

    Plans start at $99 per month with ChatGPT, Perplexity, and AI Overviews tracking included, per Topify’s pricing. You can get started with Topify and run it alongside your first AI Max experiment.

    Conclusion

    Google AI Brief gives advertisers a real way to steer AI Max in plain language, and the coming unified report finally connects query, creative, and landing page in one place. That’s a meaningful step for anyone who’s struggled to explain AI Max results to a client or a CFO.

    Bottom line: start tracking the five numbers now, test Google’s lift claims with Experiments, and write your brief from evidence rather than assumptions. Then extend the same discipline beyond the ad. The paid journey is only half of what buyers see, and the AI answers around your ads deserve the same level of measurement.

    FAQ

    Q: What is Google AI Brief?
    A: It’s a Gemini-powered feature inside AI Max that lets you guide campaigns in natural language through messaging, matching, and audience guidelines. It includes previews of sample assets and searches before you commit.

    Q: Is Google AI Brief available to all advertisers?
    A: Not yet. It’s in closed beta, rolling out first for AI Max for Search campaigns, with Performance Max and AI Max for Shopping to follow. As of September 23, 2026, the beta covers English plus seven more languages.

    Q: When will the unified AI Max report be available?
    A: Google has announced it but hasn’t shared a date, saying details and availability will come later in 2026. Until then, use the search terms, keyword, asset, and landing pages reports together.

    Q: Does AI Max reporting show how AI search engines describe my brand?
    A: No. AI Max reporting covers your paid Search ads journey. To see how AI Overviews, ChatGPT, or Perplexity describe your brand organically, you need an AI visibility tracking platform.

    Read More

  • 3 Agentic Commerce Protocols, 1 Checkout: Where Your Brand Gets Cited

    3 Agentic Commerce Protocols, 1 Checkout: Where Your Brand Gets Cited

    Your engineering lead wants a decision by end of quarter: which agentic commerce protocol do you build for first? The vendor decks don’t agree. One says the Google-backed standard is the only one that matters. Another warns you’re leaving chatbot revenue on the table. A third wants you to sign off on cryptographic payment mandates that nobody on the finance team can explain.

    Meanwhile, nobody on the call can answer a simpler question. When a shopper asks an AI assistant for the top pick in your category, does your brand show up at all?

    Picking a protocol decides how the money moves. It doesn’t decide who gets named.

    The Agentic Commerce Protocol Question Most Brands Get Backwards

    Most coverage treats UCP, ACP, and AP2 as rivals in a standards war. They aren’t, at least not in the way the headlines suggest. UCP, backed by Google and Shopify, covers discovery and the cart. ACP, from OpenAI and Stripe, handles checkout execution, and AP2 proves who actually authorized the payment. One purchase can run through all three.

    The only real overlap is between two of them. UCP and ACP are the one pair actually competing for the same ground, and ACP shifted its focus to discovery in March 2026. AP2 sits a floor below both, and its governance has already moved out of vendor hands. On April 28, 2026, Google handed AP2 to the FIDO Alliance, together with Mastercard’s Verifiable Intent framework.

    So “which protocol wins” is the wrong frame. The better question is which AI surface your buyers use, and what that surface reads before it recommends anything.

    UCP vs ACP vs AP2: What Each Layer Actually Controls

    Here’s the side-by-side, focused on the part most comparison posts skip: whether each protocol has a place where your brand can be cited.

    ProtocolBackersLayerWhere shoppers meet itWho owns checkoutCitation surface
    UCPGoogle, Shopify, Walmart, Target, Etsy, WayfairDiscovery, cart, checkout sessionAI Mode, Gemini, YouTubeMerchant of record, via Google Pay or cart transferYes, AI Mode and Gemini answers
    ACPOpenAI, Stripe, PayPalProduct feeds and checkout API, discovery-first since March 2026ChatGPTMerchant site or merchant app inside ChatGPTYes, ChatGPT product cards
    AP2Google-initiated, now FIDO AlliancePayment authorization and mandatesInvisible to shoppersNot applicableNone

    A few details matter. UCP launched January 11, 2026 at NRF, was co-developed with Shopify, Etsy, Wayfair, Target and Walmart, and has more than twenty endorsers including Visa, Mastercard, Stripe, and Best Buy. Under UCP, the retailer stays the merchant of record and keeps control of pricing rules, customer relationships, and fulfillment. ACP has broadened too, with PayPal joining Stripe behind the architecture.

    A useful mental model: UCP runs the shopping session, ACP is the purchase interface, and AP2 is the signed proof that a human said yes.

    Every Protocol Is Heading Toward the Same Checkout

    The biggest story of 2026 isn’t a protocol launch. It’s a retreat.

    OpenAI launched Instant Checkout inside ChatGPT on September 29, 2025, with “over a million” Shopify merchants promised. By February 2026, Forrester’s Emily Pfeiffer counted roughly 30 Shopify merchants actually live. In March, OpenAI ended the feature. It said merchants would use their own checkout experiences while it focused on product discovery.

    The conversion data explains why. At Shoptalk 2026, Walmart said ChatGPT’s Instant Checkout converted three times worse than its own website. Under the new model, shoppers find products in ChatGPT and then go to the retailer’s site to buy.

    Google is moving the same direction from the other side. Its latest UCP update adds cart transfer, which sends customers straight to the merchant’s checkout page with their cart already filled. Shoppers seem to want it that way. Gartner’s May 2026 consumer survey found that people want AI help with shopping but prefer to make the final purchase decision themselves.

    The result is that the checkout is converging on the merchant’s own checkout, or a single wallet tap on top of it. Whichever agentic commerce protocol carries the session, the last step looks increasingly the same.

    The checkout is becoming a commodity. The shortlist isn’t.

    Where Your Brand Actually Gets Cited in the Agentic Commerce Protocol Stack

    If checkout is converging, the competitive fight moves upstream to the AI answer that names three or four products before any protocol is involved.

    The stakes are real. By March 2026, AI-referred traffic converted 42% better than non-AI sources such as paid search and email. A year earlier, it had converted 38% worse.

    In the ACP ecosystem: ChatGPT reads feeds, then reviews

    In one 3,312-prompt study across six AI engines, ChatGPT returned a structured product card on 87% of shopping prompts. Your ACP product feed gets you into the pool, but the ranking comes from somewhere else. Nectiv found that commercial-intent prompts trigger a ChatGPT web search 53.5% of the time, compared with 18.7% for informational prompts. That means the pages ChatGPT reads at query time often decide the pick.

    In the UCP ecosystem: Merchant Center plus a deeper source list

    Google AI Mode showed product cards on 91% of prompts in the same study and cited an average of 17.1 sources per answer, compared with 13.1 for ChatGPT. Products tagged with the native_commerce attribute get a checkout button in AI Mode and the Gemini app. That button only matters if you’re in the answer first.

    AP2: no shelf, no citation

    AP2 never faces the shopper, so there’s nothing to be cited in. It matters for fraud and trust, but it has no effect on visibility.

    The sources behind every recommendation

    This is the pattern that should reshape your budget. In the study above, the most-cited domains were YouTube and Reddit at 19% each, followed by RTINGS at 16%. Brand-owned sites barely showed up. A separate signal regression from Hexagon found that third-party editorial citations were the strongest single signal linked to how often a product got recommended. They outweighed brand website quality, review volume, and price competitiveness.

    The field is also fragmented. The engines named 3,481 distinct products, and even the most-mentioned product appeared in only about 2% of answers. There’s no “rank #1” to lock in. You win by showing up consistently in the sources each engine reads.

    The Measurement Gap All Three Protocols Share

    Here’s the part no protocol spec solves. When a purchase completes inside Google AI Mode, the shopper never visits your site, so pageviews, cart events, and retargeting pixels never fire.

    Google offers partial visibility. Its AI performance insights report shows share of voice and which products appear, while the UCP analytics dashboard only starts counting at the Buy button click. Both cover Google surfaces only. There’s no equivalent view of ChatGPT, Perplexity, or Copilot, and none of these tools shows which third-party source earned you the mention.

    Consistency is the other blind spot. Only 30% of brands keep consistent visibility across back-to-back AI answers. A single manual check tells you almost nothing.

    In practice, the brands making good protocol decisions measure the recommendation layer directly, across engines, before they spend engineering time on integrations.

    Tracking Agentic Commerce Visibility Across Every Protocol Surface

    This is where a dedicated GEO platform earns its place in the stack. Topify tracks how AI systems recommend brands across ChatGPT, Gemini, Perplexity, and Google AI Overviews. Those are the surfaces where both the ACP and UCP ecosystems actually show up in front of shoppers.

    For e-commerce teams, three features map directly to the gaps above. Visibility Tracking and Position Tracking show how often your products appear in AI answers for shopping prompts, and where they rank against competitors. Source Analysis reverse-engineers the specific domains and URLs each engine cites, so you can see whether a Reddit thread, a YouTube review, or an editorial roundup put a competitor on the shortlist instead of you. Dynamic Competitor Benchmarking then flags new rivals as they start showing up in answers, which matters in a market where no product holds more than a few percent of mentions.

    Here’s how that plays out. Say your air purifier appears in ChatGPT answers but not in AI Mode. Source Analysis might show that AI Mode’s longer source lists lean on two review sites that never covered your product. That’s a PR brief, not a protocol integration.

    High-Value Prompt Discovery covers the input side by surfacing the real shopping prompts people use, such as “quietest purifier for a nursery,” which keyword tools tend to miss. Adobe’s data shows revenue per visit from AI referrals running 37% above non-AI traffic, so knowing which prompts drive those visits directly affects revenue.

    Plans start at $99/month on Topify Pricing. The Basic plan covers 100 prompts across ChatGPT, Perplexity, and AI Overviews, with a 30-day trial. You can get started with Topify and run a baseline before your next protocol planning meeting.

    Which Agentic Commerce Protocol to Prioritize for Your Brand

    With the citation layer in view, the protocol decision gets simpler. UCP has strong supply-side momentum: one directory tracks 6,540 live UCP domains, and Google’s Universal Cart lets shoppers save items across retailers and pay with Google Pay or the retailer’s own checkout. ACP still connects you to the largest single AI referral source. The right mix depends on where you sell.

    Brand typeProtocol priorityWhyCitation priority
    Shopify DTC brandLet the platform handle itShopify merchants get access to both protocols automatically through platform-level integrationsReddit, YouTube, niche reviewers
    Large multi-category retailerUCP and ACP togetherWalmart already supports both ChatGPT and GeminiEditorial roundups and review labs
    Merchant Center-heavy sellerUCP firstOnboarding runs through existing feeds and the native_commerce attributeAI Mode’s longer source lists
    Brand on Salesforce or StripeWait for the platformSalesforce and Stripe are adding UCP support, so their merchants won’t need to implement it directlyCategory comparison content
    Non-US brand on local paymentsDiscovery layer firstFor a Dutch merchant paying via iDEAL, checkout returns the buyer to your own site anywayRegional review and community sites

    Notice the right column. It doesn’t change with the protocol you choose, because every protocol path starts with an AI answer built from the same kinds of third-party sources.

    Conclusion

    UCP, ACP, and AP2 are settling into distinct layers, and the checkout at the end is converging on something close to your own. That makes the agentic commerce protocol decision more of an integration question than a strategy question. Your platform will handle much of it.

    What no protocol handles is whether your product makes the AI shortlist. That’s decided by YouTube reviews, Reddit threads, and editorial roundups that engines read before any checkout call happens.

    Start by measuring where you’re cited today, across ChatGPT and Google’s AI surfaces, and which sources drive those citations. Then build the protocol integration your platform doesn’t already cover.

    FAQ

    Q: What is an agentic commerce protocol?
    A: It’s an open standard that lets AI agents discover products, build carts, and complete purchases on a shopper’s behalf. The three main ones in 2026 are Google’s UCP, OpenAI and Stripe’s ACP, and AP2, which handles payment authorization.

    Q: Should my brand support UCP or ACP?
    A: Most mid-size and large brands will end up supporting both, usually through their commerce platform rather than building each one directly. Prioritize based on where your shoppers are: ACP for ChatGPT, UCP for AI Mode and Gemini.

    Q: Does implementing a protocol get my products recommended by AI?
    A: No. A protocol makes your catalog transactable and easier for engines to read, but recommendations lean heavily on third-party sources like reviews, Reddit, and editorial coverage. Product feed quality gets you into the pool; citations get you picked.

    Q: How do I track whether AI agents recommend my products?
    A: Run your real shopping prompts across ChatGPT, Gemini, Perplexity, and Google AI surfaces repeatedly, and log both mentions and cited sources. A GEO platform like Topify automates this with visibility, position, and source tracking across engines.

    Read More