Author: Elsa Ji

  • Your Website Traffic Report Is Missing a Channel. Here’s How to Fix It

    Your Website Traffic Report Is Missing a Channel. Here’s How to Fix It

    Your GA4 dashboard says traffic is holding steady. Your leadership team expects a clean monthly report. But conversion rates are quietly slipping, and no one can explain why.

    This isn’t a tracking problem. It’s a reporting problem.

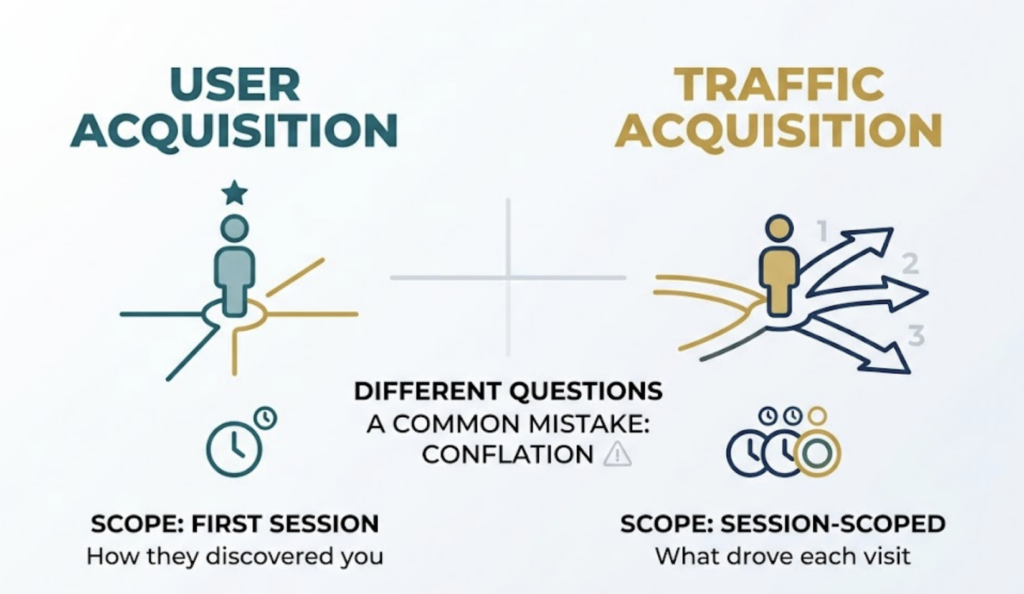
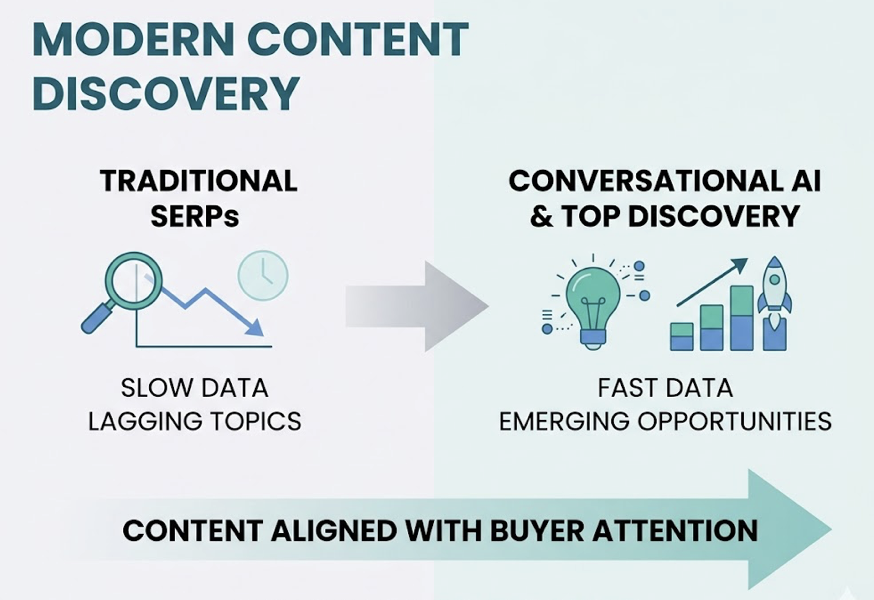
    The way users discover and evaluate brands has fundamentally shifted over the past 18 months. ChatGPT, Perplexity, Gemini, and Google’s AI Overviews are now intercepting users before they ever reach your site, summarizing information, and in many cases, ending the search journey entirely. Your current website traffic report can’t see any of that.

    Here’s what a complete traffic report looks like in 2026, and what you’re likely missing right now.

    The GA4 Report Most Teams Are Still Building

    The standard monthly traffic report is built on a familiar stack: GA4 for behavioral data, Google Search Console for organic performance, and maybe a Looker Studio dashboard to tie it together.

    The core metrics haven’t changed much. Volume metrics like total users and sessions tell you how many people showed up. Quality metrics like engagement rate and average engagement time tell you whether they stayed. Conversion metrics tell you whether any of that activity translated into business outcomes. Channel breakdown helps you figure out which acquisition channels are actually pulling their weight.

    This structure works. It’s not wrong.

    The problem is what it can’t see. GA4’s entire logic is built on the assumption that a search leads to a click, which leads to a session, which leads to a trackable event. That chain is breaking down. Roughly 60% of searches now produce zero clicks, and GA4 has no mechanism to capture what happened in those moments.

    That’s not a rounding error. That’s a structural blind spot.

    What KPIs Actually Belong in a Website Traffic Report

    Before fixing the structure, it’s worth being precise about which metrics deserve to be in the report at all. Most traffic reports include too many numbers and too few insights.

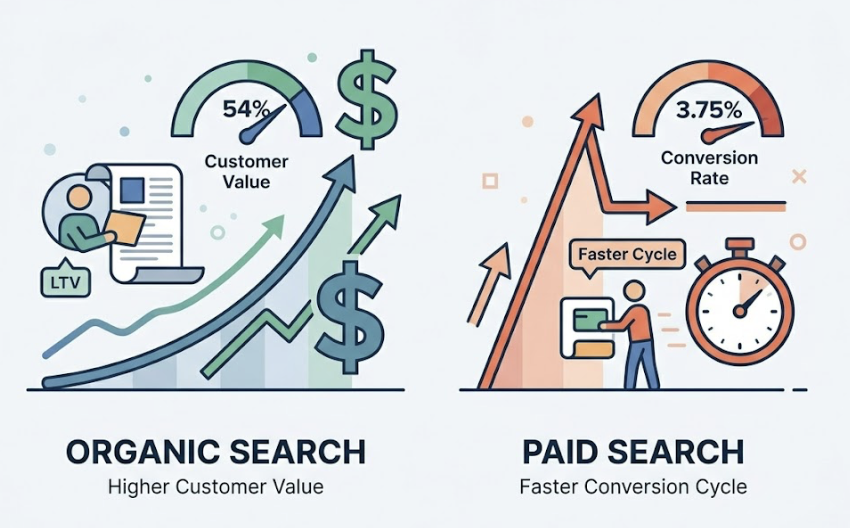
    A useful framework organizes KPIs into three layers. The volume layer captures brand reach: total users, new user growth rate, session counts. This is what leadership uses to judge whether the brand is expanding its audience. The quality layer captures audience stickiness: engagement rate, engaged sessions per user, average time on page. These metrics tell you whether your content is actually resolving user intent or just generating empty visits. The value layercaptures business output: conversion rate by channel, customer lifetime value (LTV), and cost per acquisition.

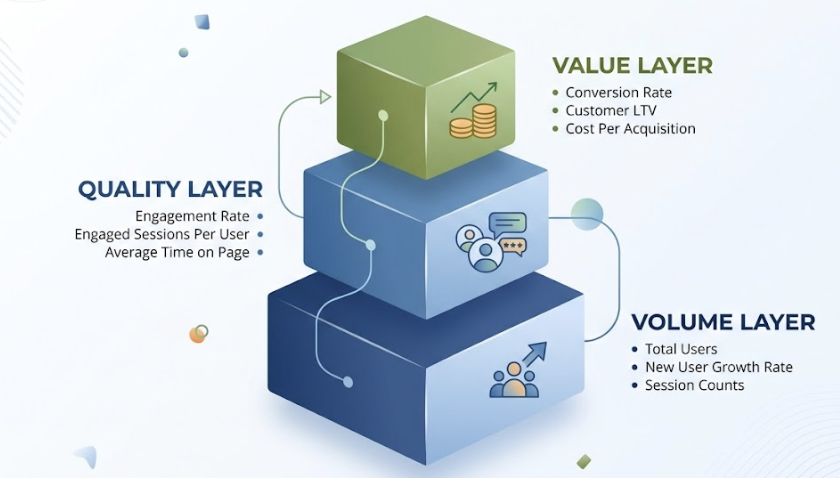
    LTV matters more than most teams acknowledge. In an environment where customer acquisition costs have climbed around 40%, optimizing for LTV often delivers a higher ROI than chasing new traffic volume.

    For executive traffic reports specifically, the focus should sit almost entirely in the quality and value layers. Leadership doesn’t need to see every metric in your GA4 property. They need to know three things: are we reaching more of the right people, are those people engaging meaningfully, and is the investment translating into revenue.

    How to Structure a Monthly Traffic Report Stakeholders Will Read

    The most common reason traffic reports get skimmed and shelved is structure. Data-first reports force the reader to draw their own conclusions, which most executives won’t do under time pressure.

    The fix is simple: lead with the conclusion.

    A well-structured monthly traffic report opens with an executive summary of three to four sentences. This isn’t a preview of what follows. It’s the answer. Here’s what happened, here’s why, here’s what it means for the business.

    From there, the report moves into channel performance analysis, comparing traffic contribution and conversion rates across organic search, paid, email, social, and direct. Page-level performance comes next, with a focus on the top 10 landing pages by conversion rather than by volume. Then a trend and anomaly section, which we’ll cover in detail below. The report closes with concrete next steps, not vague “continue optimizing” language but specific actions tied to the data.

    On visualization: use line charts for time-series metrics like sessions and active users, comparison tables for month-over-month and year-over-year benchmarks, and funnel views to show where users are dropping off between acquisition and conversion. The visual format should serve the business question, not demonstrate the analyst’s command of chart types.

    The Channel Your GA4 Report Can’t See

    Here’s the uncomfortable truth behind many traffic reports showing flat or declining organic performance: the brand may actually be growing its presence in search. It’s just happening somewhere GA4 can’t measure.

    When AI Overviews are triggered on a query, organic click-through rates drop from an average of 1.76% to 0.61%, a decline of about 65%. For informational queries, which is where most content marketing investment goes, traffic losses typically range between 30% and 40%. B2B tech companies are seeing AI search exposure rates around 70%, with projected traffic impacts in the -35% to -45% range. Healthcare and education are similarly exposed.

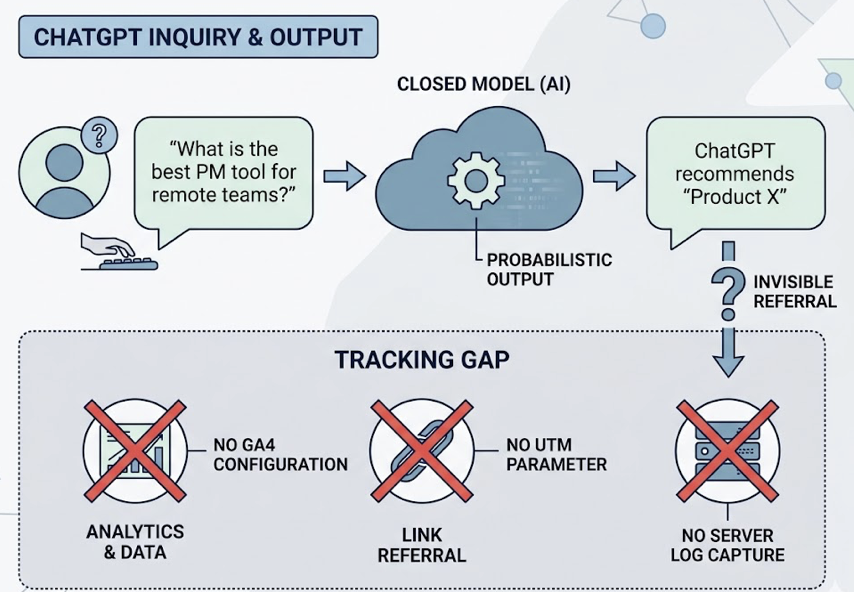
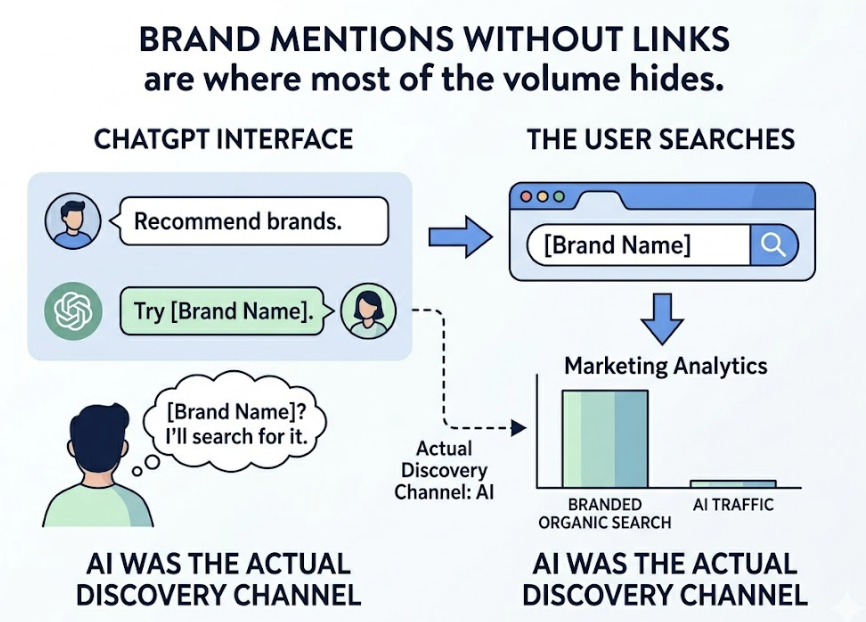
    That traffic isn’t disappearing. It’s being absorbed by AI interfaces.

    GA4 makes this problem worse by miscategorizing AI-referred traffic. Visits originating from ChatGPT, Perplexity, or Gemini frequently get labeled as Referral or Direct in GA4’s default channel grouping. The actual influence of AI platforms on your traffic is almost certainly larger than your reports suggest.

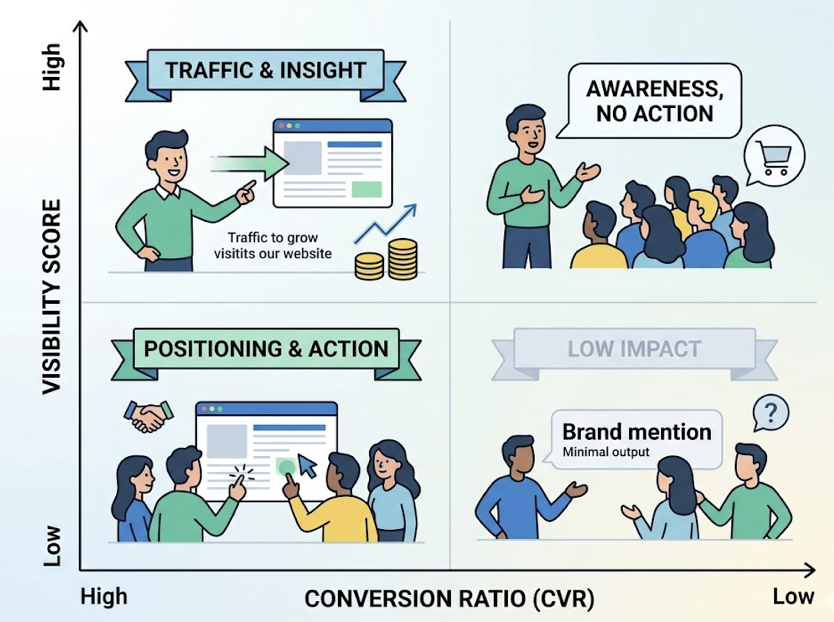
    A complete website performance report now needs a third layer alongside the standard GA4 and GSC data: AI search visibility. This means tracking how often your brand appears in AI-generated answers, what sentiment those answers carry, and how you rank relative to competitors in AI recommendation contexts.

    This is where tools like Topify come in. Topify monitors brand performance across ChatGPT, Gemini, Perplexity, and other major AI platforms by simulating thousands of industry-specific user prompts and measuring where and how brands appear in the responses. It tracks AI mention frequency, citation patterns, sentiment scoring, and competitive positioning in a single dashboard.

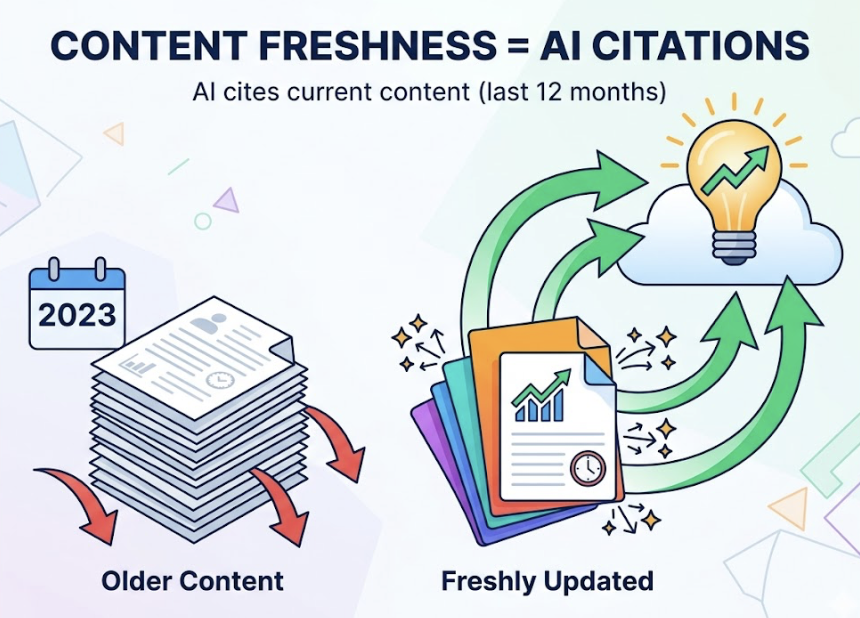
    The practical implication for your traffic report: brands that appear in AI citations see organic CTR improvements of around 35%, partially offsetting the traffic losses caused by zero-click searches. That’s not a coincidence. AI citations create a trust signal that carries forward into traditional search behavior.

    Adding AI Visibility Data to Your Marketing Traffic Dashboard

    Integrating Topify’s data into your existing Looker Studio or Power BI setup gives you a unified decision view. Topify’s AI Volume Analytics quantifies what’s essentially invisible to GA4: the “dark” search traffic where users encounter your brand inside an AI response but never click through.

    Useful dimensions to include in the combined dashboard: AI Share of Voice (how your brand’s AI mention frequency compares to direct competitors), citation gap analysis (which core topics are AI platforms citing competitors for instead of you), and sentiment trend over time. These can be displayed alongside your standard GA4 channel metrics so that leadership sees the full picture in one report.

    How to Set Traffic Benchmarks That Actually Mean Something

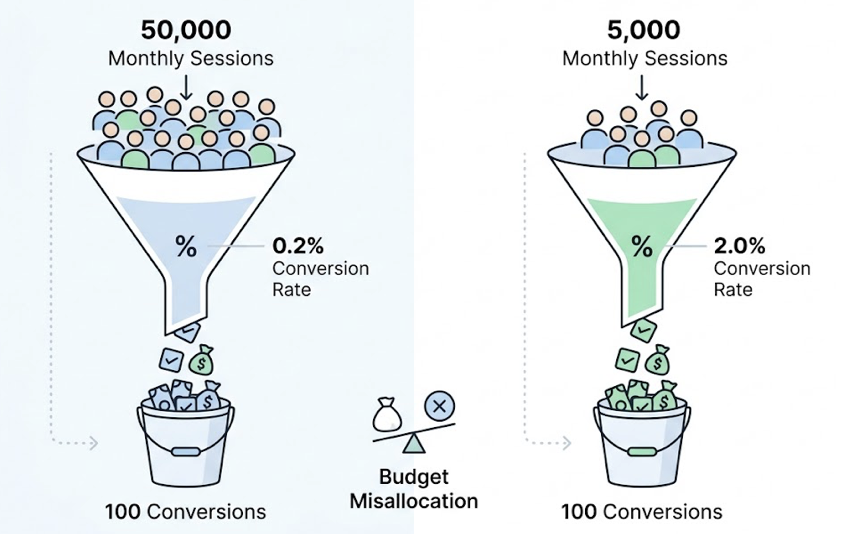
    Traffic benchmarks are only useful when they’re calibrated to industry and company stage. Comparing a B2B SaaS company to an e-commerce retailer on session volume is meaningless.

    Typical e-commerce sites average around 12.46 million monthly sessions with conversion rates between 1.9% and 2.5%. B2B SaaS companies, by contrast, often operate with median session volumes around 4,100 per month, but with conversion rates between 2.3% and 5.0% and repeat visit rates between 60% and 85%. Financial services firms average around 9.29 million sessions with conversion rates of 1.5% to 3.0%. News and media publishers run between 600K and 900K sessions and are among the sectors most exposed to AI summary traffic interception.

    For B2B SaaS, organic traffic year-over-year growth between 35% and 45% is generally considered strong. For e-commerce, 20% to 30% annual growth with stable conversion rates is a healthy benchmark.

    One metric that doesn’t get enough attention in traffic reports is net revenue retention (NRR). The SaaS median sits around 106%. In the context of a traffic report, NRR matters because it tests whether the traffic you’re attracting is converting into customers who stay. High traffic growth alongside declining NRR often signals an audience-fit problem, not a volume problem.

    How to Explain Traffic Drops Without Losing the Room

    When traffic falls, the instinct in a stakeholder report is either to minimize it or to overexplain it. Neither works.

    The right approach is a structured diagnostic presented in three parts: what happened, why it happened, and what you’re doing about it.

    Start by ruling out tracking failures. A sudden, severe drop that affects all channels simultaneously usually indicates a GA4 tag issue, not an actual traffic loss. Verify your implementation before building any narrative around the data.

    From there, check for seasonality. A year-over-year comparison often reveals that the “drop” is a routine annual pattern, which is a far easier conversation with leadership than a structural decline.

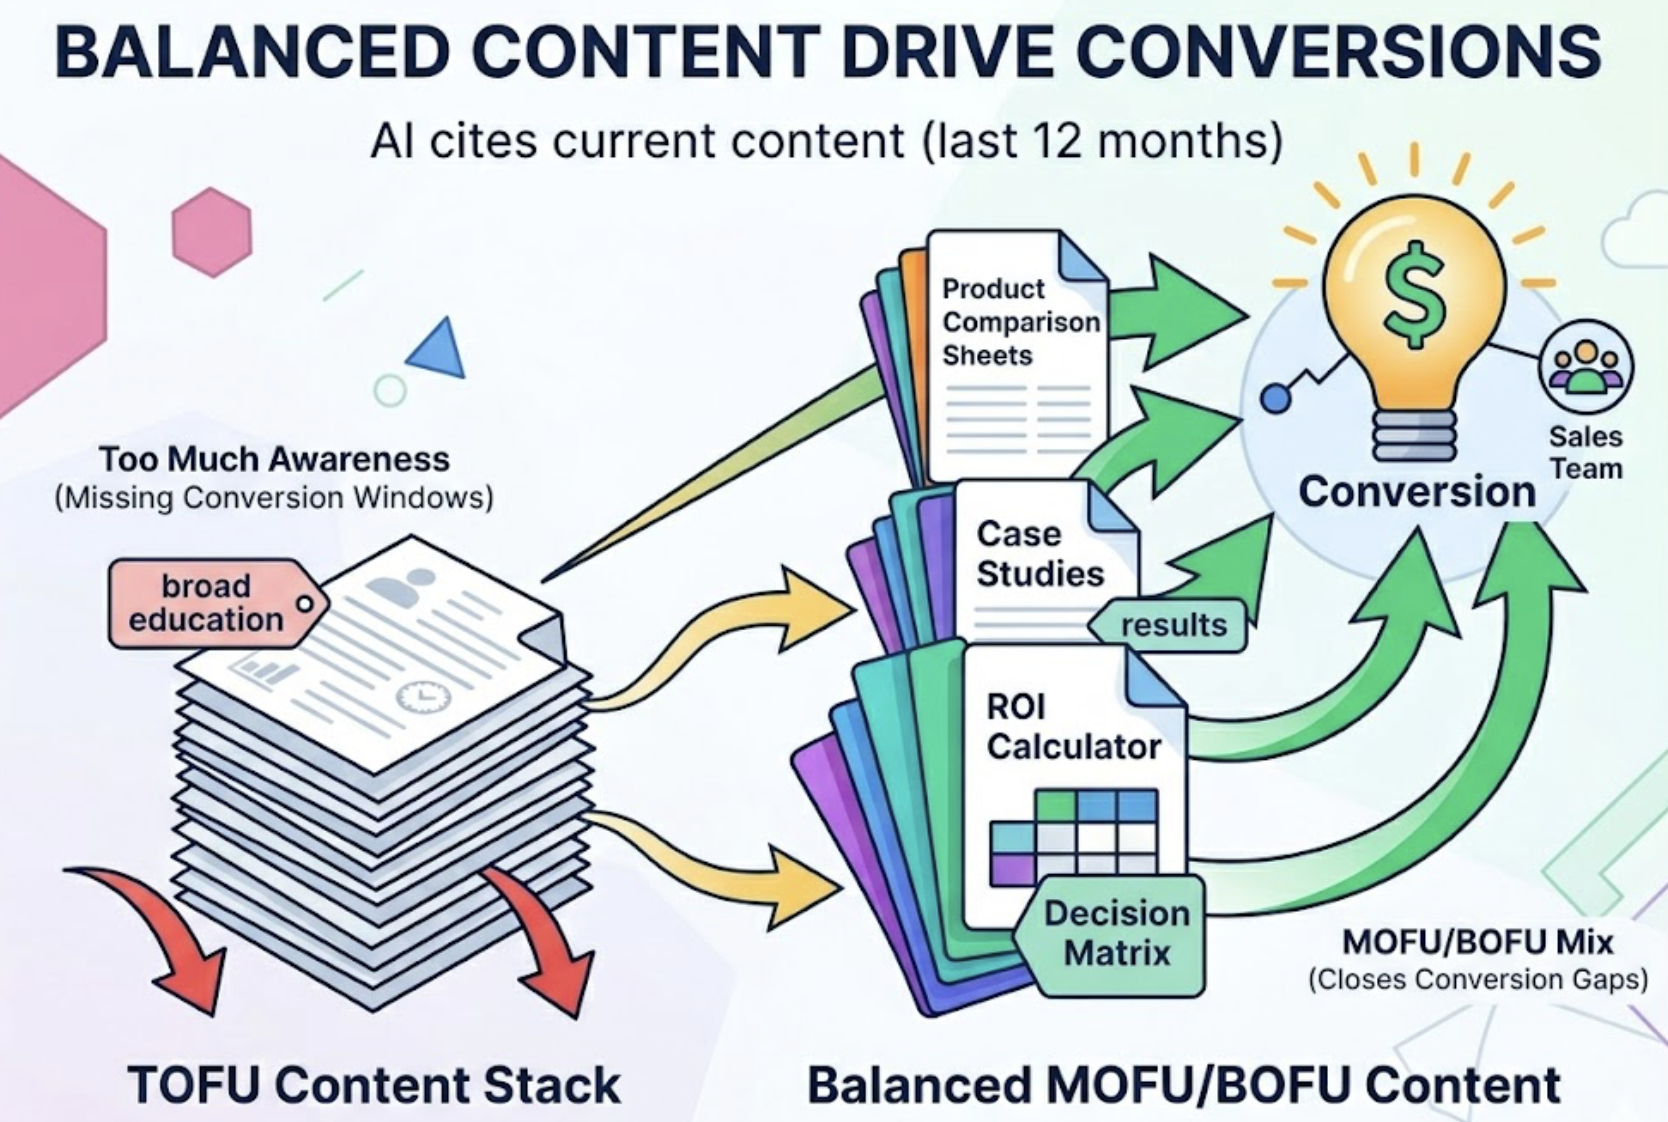
    If the timing aligns with a Google Core Update, dig into whether E-E-A-T signals may be the cause. HubSpot’s organic traffic dropped from 13.5 million to around 6 million following the 2024 core update, primarily because thin informational content, the kind AI can answer directly, was significantly devalued.

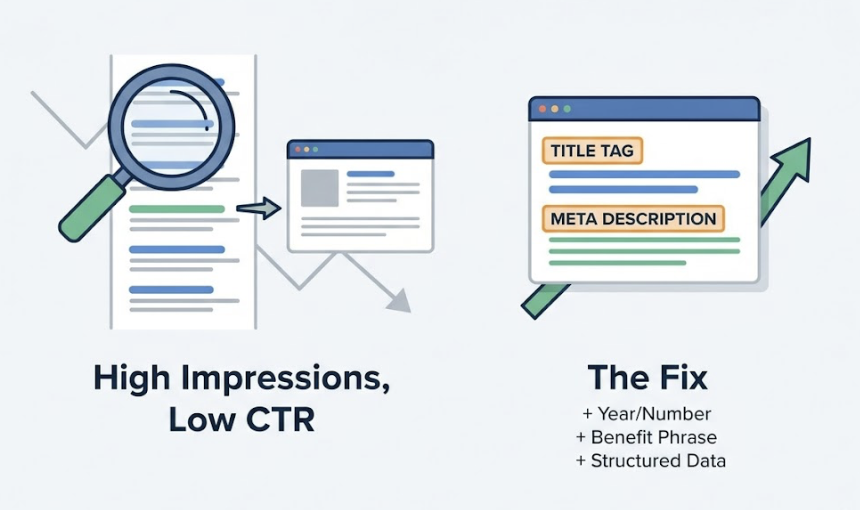
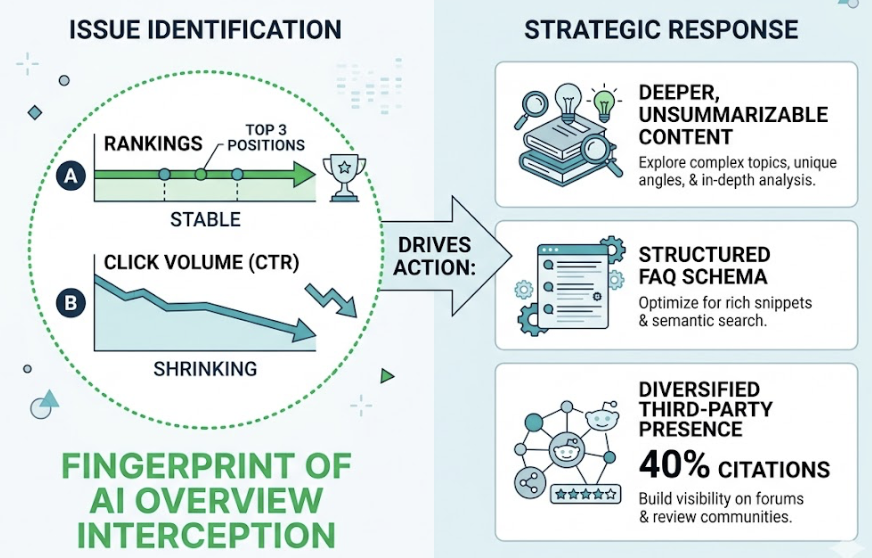
    Finally, check whether rankings held but CTR declined. That specific pattern, stable positions but shrinking click volume, is the fingerprint of AI Overview interception. It requires a different response than a ranking drop: specifically, deeper content that AI systems can’t easily summarize, structured FAQ schema to compete for citation, and diversified presence on third-party platforms, given that roughly 40% of LLM citations originate from Reddit and professional review communities.

    Automating Your Traffic Report: GA4, GSC, and AI Visibility in One Dashboard

    Manual reporting is slow, inconsistent, and often the reason reports arrive two weeks after the data they describe. A modern traffic reporting setup should run itself.

    The foundation is connecting GA4 to Looker Studio via the native connector. For teams dealing with large data volumes or hitting API quota limits, enabling BigQuery export gives you direct access to raw GA4 event data, which you can query with far more flexibility than the standard reporting interface allows.

    Layer GSC data on top using the Search Console connector in Looker Studio. This lets you map keyword-level impressions, clicks, and average position alongside your GA4 behavioral data, which is essential for identifying AI-related CTR degradation.

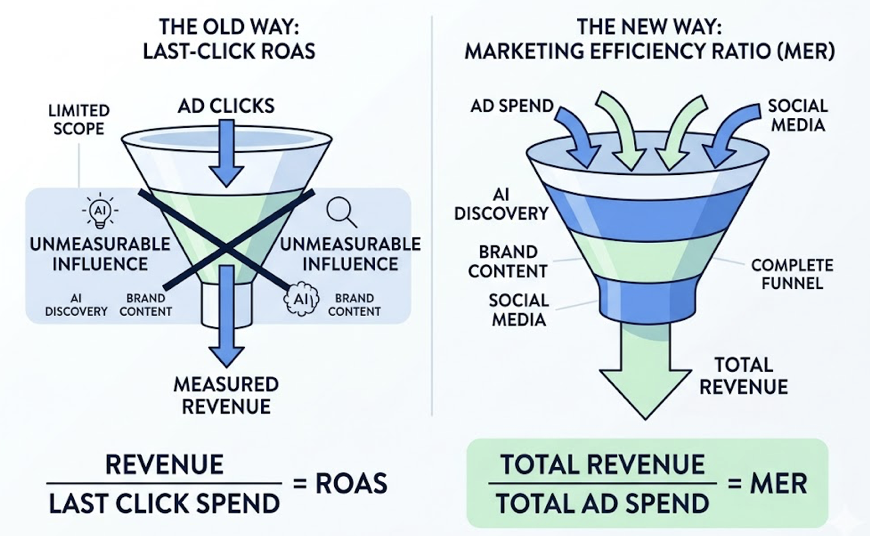
    For AI visibility, pulling Topify’s AI search data as an additional data source creates a complete picture: traditional traffic performance, organic search health, and AI search visibility in a single dashboard. The approximate value of AI-influenced traffic can be modeled as: (AI-referred sessions × conversion rate) + (branded search uplift × average order value). This gives leadership a dollar-value frame for AI visibility investment, which is considerably more persuasive than abstract mention-frequency metrics.

    Set daily automatic refresh schedules and use data blending to merge the three sources into a unified view. The goal is a report that’s ready before anyone has to ask for it.

    Conclusion

    A website traffic report that only looks at GA4 data is working from an incomplete picture of how your brand is actually performing in search. Traditional metrics still matter. Sessions, engagement rate, CVR, and channel breakdown are still the right foundation. But they can’t tell you what’s happening inside AI interfaces, where an increasing share of research, discovery, and brand evaluation is now taking place.

    The teams getting ahead of this are treating AI search visibility as a distinct reporting layer, not a future add-on. Tools like Topify make it possible to track brand presence across ChatGPT, Gemini, Perplexity, and other AI platforms with the same rigor you’d apply to GA4 data. That data, combined with traditional traffic KPIs and the right reporting structure, gives stakeholders a complete view of where your brand stands and where it’s headed.

    Traffic is moving. The question is whether your report is moving with it.


    FAQ

    How do you report on AI search traffic alongside organic traffic in GA4?

    GA4 typically misclassifies AI-originated traffic as Referral or Direct. A practical fix is to create a custom channel group in GA4 under Admin > Data display > Channel groups, using regex patterns like .*chatgpt.*|.*perplexity.*|.*gemini.* to isolate AI referrals as a named channel. For the brand-level AI visibility data that GA4 can’t capture at all, pairing GA4 with a dedicated AI monitoring platform like Topify is the most reliable approach.

    What KPIs should be in an executive website traffic report?

    Executives care about business outcomes, not raw traffic numbers. The core KPIs for an executive report are: engagement rate (traffic quality indicator), conversion rate by channel (channel efficiency), customer lifetime value (long-term acquisition value), and AI Share of Voice (forward-looking market position in AI search). Keep the executive summary to three to four sentences, and let the detail live in the body of the report.

    How do you automate website traffic reporting with GA4?

    Enable BigQuery export in GA4 to move raw event data into a cloud warehouse, then connect BigQuery to Looker Studio for visualization. This bypasses the standard API’s quota constraints and allows more complex queries. Set daily sync schedules and use Looker Studio’s data blending feature to merge GA4, GSC, and AI visibility data sources into a single dashboard.

    How do you explain a traffic drop in a stakeholder report?

    Present it as a structured diagnostic: first rule out tracking failures, then check for seasonality using year-over-year comparisons, then evaluate whether timing aligns with a known algorithm update, and finally check whether rankings held while CTR declined (the AI Overview interception pattern). Frame every negative data point with a cause and a specific action plan. The goal isn’t to minimize the drop. It’s to demonstrate that you know what drove it and what you’re doing next.

    What’s a healthy website traffic growth rate by industry?

    For B2B SaaS, year-over-year organic traffic growth between 35% and 45% is considered strong. For e-commerce, 20% to 30% annual growth with stable conversion rates is healthy. Growth rate alone isn’t the right measure. Net revenue retention (NRR) is the more meaningful indicator of whether traffic quality supports long-term business health. For SaaS companies, maintaining NRR above 100% while growing traffic is the benchmark that actually matters to leadership.


    Read More

  • The Traffic Analytics Tools Every Marketer Relies On in 2026

    The Traffic Analytics Tools Every Marketer Relies On in 2026

    You’ve got GA4 set up. Maybe Hotjar on the side. Traffic numbers look fine. Conversions are holding steady.

    But there’s a good chance 30% of your highest-intent visitors are showing up as “Direct” traffic — and you have no idea they were sent by an AI.

    That’s not a GA4 bug. It’s a structural gap in how modern analytics was built. And in 2026, it’s costing marketers their most qualified leads.

    Most Analytics Setups Still Have a 70.6% Blind Spot

    When a user asks ChatGPT for a tool recommendation and clicks the link, that visit almost never arrives at your site with a referrer header intact. Mobile AI apps — running on iOS or Android WebViews — strip the metadata before the request even leaves the device.

    The result: GA4 misclassifies up to 70.6% of AI-referred sessions as “Direct” traffic. In controlled testing, for every 56 visits originating from the Gemini app on iOS, GA4 correctly identified only 5 as referrals — a capture rate under 9%.

    Here’s why that matters. AI-driven visitors convert at 14.2% to 15.9%. Standard organic traffic converts at 1.76% to 2.8%. You’re not just missing attribution data. You’re missing your best customers.

    This isn’t an edge case anymore. It’s the primary measurement failure of 2026.

    8 Traffic Analytics Tools, Ranked by What They Actually Measure

    No single tool covers every channel. The analytics market in 2026 has split into general-purpose platforms for baseline measurement and specialized tools for deep behavioral and AI-specific insights. Here’s how the core stack compares:

    ToolCore FunctionBest ForPricing (2026)
    GA4Web/App Traffic BaselineAd sync, funnel trackingFree / $50,000+ (360)
    Adobe AnalyticsEnterprise Customer JourneyUnsampled data, B2B attribution$100,000+ /year
    MatomoPrivacy-First Web AnalyticsGDPR compliance, self-hostedFree (self) / $23/mo (cloud)
    MixpanelEvent-Based Product GrowthSaaS retention and funnelsFree / $24+ /month
    HeapAuto-Capture Behavioral DataUX friction, retroactive analysis$2,000–$5,000+ /month
    HotjarHeatmaps & Session ReplayVisualizing user struggleFree / $32+ /month
    SemrushCompetitive IntelligenceTraffic benchmarking, SEO$139–$499+ /month
    TopifyAI Search VisibilityLLM mention and citation tracking$99+ /month

    The right stack depends on your org size and how mature your data culture is. That said, every team — regardless of size — now needs representation in at least three layers: traffic volume, user behavior, and AI visibility.

    GA4: Still the Default, But No Longer the Whole Picture

    Google Analytics 4 powers roughly 78.6% of the web analytics market as of early 2026. For most teams, it remains the foundation: event-based tracking, deep Google Ads integration, and a solid connection to Search Console make it hard to replace for baseline measurement.

    Its limitations are real, though. Data sampling kicks in above certain session thresholds, and when it does, GA4 switches from processing raw events to statistical modeling. For retail clients, that gap has been shown to obscure seasonal patterns affecting up to 8% of revenue.

    In the context of AI search, GA4 has no native capability to distinguish between a visit from standard organic results and one generated by Google’s own AI Overviews or AI Mode. That’s a gap no configuration workaround fully solves.

    Use GA4 as your system of record for financial reporting. Don’t rely on it as a complete picture.

    Google Analytics Alternatives Worth Considering

    For teams with specific constraints, three alternatives consistently stand out.

    Matomo is the privacy-first choice. It offers a self-hosted option that keeps EU user data entirely off US-based servers — a persistent compliance issue for GA4 and Adobe under GDPR and CCPA. Matomo includes cookieless tracking, built-in heatmaps, and A/B testing without third-party scripts. Healthcare and finance teams tend to favor it precisely because it reduces legal surface area without sacrificing data quality.

    Mixpanel is built for product-led growth. Its event-based model goes deeper than GA4 on funnel analysis, retention cohorts, and user-level tracking — making it the better fit for SaaS teams who need to understand activation and churn patterns, not just traffic volume.

    Heap takes a different approach: it auto-captures every user interaction by default, with no need to define events in advance. That retroactive flexibility is valuable when you realize, three months into a campaign, that you should have been tracking something you weren’t.

    None of these replace GA4 entirely for teams already in the Google ecosystem. They’re best used as a layer on top of it, or as a direct replacement when compliance or product-depth requirements make GA4 the wrong fit.

    What Heatmaps Actually Tell You That Numbers Can’t

    Numbers show you what happened. Heatmaps and session recordings show you why.

    GA4 can tell you a landing page has a 70% bounce rate. It can’t tell you whether users are leaving frustrated or leaving satisfied. Those two scenarios require completely different responses.

    Hotjar and Microsoft Clarity (free, unlimited recordings) give you the behavioral layer. Clarity, in particular, has gained adoption fast in 2026 because its forever-free model removes the sampling limits that constrain Hotjar’s free tier. Both tools surface “rage clicks” on unresponsive UI elements and “dead clicks” on items that look interactive but aren’t.

    Average scroll depth across web content sits at 55% in 2026. That means half your page — and most of your CTAs — likely sits below where the average visitor stops scrolling. Behavioral tools are how you find that out before you lose another conversion cycle to a placement problem.

    The workflow is simple: use GA4 to identify the pages with friction, then use Clarity or Hotjar to understand the friction itself.

    Real-Time Monitoring and the Agency Dashboard Problem

    Agencies in 2026 are expected to deliver real-time ROI visibility, not monthly spreadsheet drops. That shift has pushed a set of dashboard tools into standard practice.

    Semrush Traffic Analytics remains the go-to for competitive benchmarking. It’s particularly useful for proving market share shifts to clients — showing not just how a client is performing, but how they’re performing relative to direct competitors across traffic sources.

    For multi-client reporting, AgencyAnalytics and Databox serve different needs. AgencyAnalytics is built for the traditional PPC/SEO agency workflow, with white-labeling that lets clients log in to a portal on the agency’s own subdomain. Databox focuses on executive-level KPI scorecards, accessible on mobile, which tends to land better with client leadership who want a single number, not a full report.

    Setting up a dashboard that actually drives decisions comes down to one principle: separate “Leadership” metrics (revenue, CAC, ROI) from “Managerial” metrics (CPL, CTR, engagement rate). Dashboards that mix both levels tend to get ignored by both audiences.

    The Traffic Source Your Entire Stack Is Currently Ignoring

    Here’s the thing: traditional web analytics tools are structurally incapable of monitoring what happens inside a generative AI model before a user clicks anything.

    When someone asks ChatGPT “what’s the best project management tool for remote teams,” the search happens inside a closed model. If ChatGPT recommends your product, that recommendation exists as a probabilistic output, not an indexable page or a trackable referral. No GA4 configuration, no UTM parameter, no server log captures that moment.

    ChatGPT alone sees 5.4 billion global monthly visits as of January 2026 — 64.5% of AI referral share. Google Gemini quadrupled its position between 2025 and 2026. Perplexity’s user base skews 30% senior leadership, making it one of the highest-value discovery channels per session. Claude, despite smaller volume, drives the highest conversion rate in the category at 16.8%.

    That’s not marginal traffic. That’s where B2B decisions increasingly start.

    Topify was built specifically to monitor this layer. It tracks brand presence across ChatGPT, Gemini, Perplexity, DeepSeek, and other major AI platforms through seven core metrics: visibility, sentiment, position, volume, mentions, intent, and CVR. Its AI Visibility Score measures the percentage of relevant category prompts that produce a brand mention. A score of 25 means your brand appeared in 25 out of 100 tracked prompts — a concrete number you can move over time.

    The Sentiment and Positioning module is particularly important for brand managers. AI platforms sometimes describe products with outdated pricing, incorrect features, or misattributed comparisons. Topify surfaces these hallucinations before they influence a buyer’s decision.

    On the citation side, research shows brands are 6.5 times more likely to be referenced by AI models through third-party sources — reviews, forums, industry publications — than through their own primary domains. Topify’s Source Analysisidentifies exactly which domains are driving AI recommendations, showing you where to build authority rather than guessing.

    Topify’s Basic plan starts at $99/month and includes tracking across ChatGPT, Perplexity, and AI Overviews for up to 100 prompts and 9,000 AI answer analyses. It’s the entry point for teams that want to stop treating AI traffic as a black box.

    How to Build an Analytics Stack That Covers Every Channel

    The 3-layer model is the clearest framework for building a stack with no channel blind spots.

    Layer 1: Foundational Traffic (GA4 or Matomo). This is your quantitative baseline — raw volume, source attribution, revenue. It’s the system of record for financial reporting and executive dashboards.

    Layer 2: Behavioral Intelligence (Microsoft Clarity or Hotjar). This is your qualitative context — heatmaps, session recordings, rage clicks. It explains why the numbers in Layer 1 look the way they do.

    Layer 3: Generative Discovery (Topify). This is your pre-click insight layer. It monitors brand presence in the AI models that are already influencing the “Direct” traffic you see in Layer 1, and gives you a lever to pull.

    Team SizeLayer 1Layer 2Layer 3
    Small TeamGA4 (Free)Microsoft Clarity (Free)Topify Basic ($99/mo)
    Growth / SaaSGA4 + MixpanelHotjarTopify Pro ($199/mo)
    Enterprise / AgencyGA360 or AdobeHeap or FullStoryTopify Enterprise

    For a mid-sized growth team, the total monthly investment in this stack typically runs $300 to $1,200. The ROI case is straightforward: AI search traffic converts at 5.1 times the rate of traditional search. Capturing even a 1% shift in AI discovery market share translates to a disproportionate revenue gain — because the visitors arriving from AI have already been pre-qualified by a model that evaluated your credibility before recommending you.

    AI search traffic converts at 11 times the sign-up rate of standard organic traffic. If your analytics stack can’t see it, you can’t optimize for it.

    Conclusion

    The analytics tools that defined digital marketing for the past decade are still worth running. GA4, Hotjar, Matomo — these aren’t obsolete. They’re necessary but no longer sufficient.

    The 30% blind spot in modern attribution isn’t a configuration error. It’s the gap between how measurement infrastructure was built and how users actually discover brands in 2026. Zero-click searches now account for 93% of interactions in Google AI Mode. The “click” — the event every analytics platform was designed around — is becoming a rare outcome rather than the default one.

    The marketers who close that gap first will have a measurable advantage. They’ll know which AI platforms are recommending them, which sources are driving those citations, and which content gaps are letting competitors take their position. Everyone else will keep attributing their best customers to “Direct” and wondering why the numbers don’t add up.


    FAQ

    What’s the difference between Google Analytics 4 and Adobe Analytics? 

    GA4 is free and tightly integrated with Google Ads, making it the default for most teams. Adobe Analytics processes 100% of data without sampling and supports more complex attribution models, including B2B account-level tracking. The trade-off is cost: Adobe typically runs $100,000 to $300,000 per year, compared to GA4’s free tier. For teams where data completeness directly affects revenue reporting, the sampling gap in GA4 can justify the switch.

    Is Google Analytics or Matomo better for privacy compliance? 

    For teams operating under GDPR or CCPA with strict data residency requirements, Matomo’s self-hosted option is the stronger choice. It keeps all data on your own servers, eliminates the legal complexity of EU-to-US data transfers, and supports cookieless tracking out of the box. GA4 has improved its privacy controls, but it’s still a US-based platform, which creates compliance friction for European organizations.

    What are the best real-time website traffic tracking tools? 

    GA4 provides near-real-time data with a standard processing delay of a few hours for most reports. For true real-time competitive benchmarking, Semrush Traffic Analytics is the stronger option. For AI search visibility in real time, Topify monitors brand mentions across AI platforms on a continuous basis, which no traditional analytics tool supports.

    What analytics tools work best for e-commerce traffic tracking? 

    E-commerce teams typically rely on GA4 for transaction-level tracking and Google Ads attribution, combined with a behavioral tool like Hotjar to identify checkout friction. For brands selling through AI-recommended discovery channels, Topify’s CVR (Conversion Visibility Rate) metric helps estimate how often AI recommendations are leading to purchase intent.

    How do you track the user journey across multiple touchpoints? 

    Multi-touch attribution requires combining GA4’s data-driven attribution model with a CRM layer (HubSpot, Salesforce) that captures the full account journey. For B2B, Adobe Analytics offers account-level attribution that ties multiple sessions across buying group members to a single opportunity. The missing layer for 2026 is AI-assisted discovery, which sits before the first tracked touchpoint — that’s where Topify adds visibility that no traditional attribution model captures.

    How can analytics tools help reduce bounce rate? 

    Bounce rate reduction starts with understanding whether a high bounce rate signals failure or success. GA4 identifies the pages; behavioral tools like Microsoft Clarity or Hotjar show you what users actually do on those pages. In many cases, users bounce after getting the information they needed — which looks identical to a frustrated exit in GA4. Session recordings distinguish between the two scenarios before you redesign a page that was actually working.

    How do you get actionable insights from website traffic data? 

    The most common failure mode is collecting data without a decision framework. Separate your metrics into two tiers: leadership metrics (revenue, CAC, ROAS) and operational metrics (CPL, CTR, scroll depth). Every number should map to a decision someone is capable of making. If a metric can’t change a behavior or a budget, it doesn’t belong on your dashboard.


    Read More

  • Website Traffic Sources Explained: What Each Channel Actually Tells You

    Website Traffic Sources Explained: What Each Channel Actually Tells You

    Your Google Analytics report shows six traffic channels. You glance at organic and paid, maybe check direct when it spikes, and move on. That’s how most marketing decisions get made, and it’s a problem. Research shows over 60% of marketing decisions are based on just two of those channels, which means the data sitting in the other four is quietly shaping your results without anyone reading it.

    The labels aren’t the issue. The interpretations are.


    The 6 Website Traffic Sources and What They Actually Mean

    Organic search, paid search, direct, referral, social, and email. These six categories appear in every analytics platform, but each one hides more than it shows.

    Organic search accounts for 53.3% of all website traffic globally, making it the single largest channel for most sites. It represents users who found you through a non-paid search result and have enough intent to click. That’s a meaningful signal. But calling it “free traffic” is a stretch: getting there requires sustained investment in content quality, technical infrastructure, and E-E-A-T signals that take months to compound.

    Paid search sits at the other end of the spectrum. It’s fast, measurable, and completely dependent on budget continuity. Paid channels now account for nearly 42% of all traffic across the web, a figure that’s climbed as organic competition intensified. The average cost-per-click in paid search sits at $4.22, with high-intent verticals like legal pushing that to $6.75 or more. Stop paying, and the traffic stops the same day.

    Organic Traffic vs Paid Traffic: Not the Same Race

    The real difference isn’t cost, it’s the asset model. Organic search builds equity. A well-ranking article can generate traffic for years without incremental spend. Paid search is a rental agreement: excellent short-term returns, zero residual value.

    The financial case for organic is clearer over time. Organic traffic has a 54% higher lifetime value than paid traffic, largely because users arriving through search tend to have stronger purchase intent and deeper content engagement. That said, paid search delivers faster conversion cycles, with B2B paid search averaging a 3.75% conversion rate in the short term.

    Neither is universally better. The question is what your business actually needs right now.

    Direct Traffic vs Referral Traffic: Where the Confusion Starts

    Direct traffic is supposed to represent users who typed your URL directly or used a bookmark. Referral traffic is supposed to represent clicks from other websites.

    In practice, the line is much blurrier.

    A significant portion of what shows up as “Direct” in Google Analytics isn’t brand loyalty at all. It’s attribution failure. And referral traffic, while smaller in volume, consistently delivers some of the highest conversion rates of any channel, often above 3%, because it carries the implicit trust of the source that linked to you.


    Why Your Direct Traffic Number Is Probably Lying to You

    Here’s the thing about direct traffic: it’s not a channel. It’s a catch-all.

    Google Analytics classifies any visit without a referrer string as “Direct.” That sounds straightforward until you trace where those visits are actually coming from. A user clicks a link inside a WhatsApp group, the mobile app doesn’t pass referrer data, and GA4 records it as direct. Someone shares your article in a private Slack channel, their colleague clicks it on their phone, and again: direct.

    This is dark social. According to RadiumOne, 84% of consumer online sharing happens in private channels like WhatsApp, WeChat, and Slack, with only 16% occurring on public social platforms. All of that private sharing, when it drives clicks, lands in your direct traffic bucket.

    That’s not a minor data quality issue. In a controlled experiment tracking 16 subdomains, 100% of traffic from private messaging apps was recorded as direct. If your direct traffic is unusually high, the most likely explanation isn’t that you have a strong brand. It’s that your content is being shared in places your analytics can’t see.

    Dark social traffic is also disproportionately valuable. Content shared privately is perceived as 3.2x more credible than content shared publicly, and dark social channels tend to produce 4 to 5x higher conversion rates than public social platforms. You’re not seeing garbage traffic in that “Direct” bucket. You’re seeing your most trusted referrals, mislabeled.


    Social Media Traffic and Email Traffic: High Volume, Low Attribution

    Social media drives volume. Email drives conversions. Both are chronically misattributed.

    The core problem with social traffic is that most platforms don’t reliably pass referrer data when users click links inside native apps. A Facebook post click on mobile often drops the referrer entirely, sending the visit straight to Direct. Brands with structured UTM systems report 31% more accurate social attribution than those without, which tells you exactly how much data is leaking without proper tagging.

    Email has the opposite profile. It’s one of the few channels where 1:1 attribution is genuinely achievable. When UTM parameters are applied consistently and user IDs are tied to email links, you can trace a specific subscriber’s journey from click to purchase with precision. 73% of B2B organizations rate email as their most effective lead generation channel, and the data backs that up: email-generated leads convert 67% better than social media leads.

    That gap matters. Both channels require time and budget. But the conversion multiplier on email is hard to ignore.

    How to Use UTM Parameters to Track Traffic Sources Accurately

    UTM parameters are the GPS for traffic attribution. Without them, you’re guessing. A complete UTM structure includes five parameters: utm_source (where the click came from), utm_medium (the type of channel), utm_campaign (the specific initiative), utm_content (which creative or placement), and utm_term (for paid keyword tracking).

    The most common failure isn’t missing UTMs. It’s inconsistent UTMs. When one team tags Instagram links as source=instagram and another uses source=ig, you end up with fragmented data that can’t be aggregated. A shared naming convention, enforced across every team that publishes links, is non-negotiable.


    How to Compare Traffic Sources to Find Your Best-Performing Channel

    Volume is the worst metric to optimize for first.

    A channel with 50,000 monthly sessions and a 0.2% conversion rate generates 100 conversions. A channel with 5,000 sessions and a 2% conversion rate generates the same 100 conversions, at one-tenth the traffic cost. Optimizing for the first one while ignoring the second is exactly how marketing budgets get misallocated.

    The right framework combines four dimensions: volume, intent, conversion rate, and scalability. Here’s how the six channels typically stack up:

    ChannelVolumeUser IntentConversion RateScalability
    Organic SearchHighHighModerate–HighMedium
    Paid SearchMedium–HighVery HighHighVery High
    DirectMediumVery HighVery HighLow
    ReferralLowHighHigh (often 3%+)Low
    Social MediaVery HighLow–MediumLow (0.4–0.8%)High
    EmailMediumHighModerate–HighMedium

    The goal isn’t to pick one winner. It’s to understand what each channel is actually for. Social at 0.4% conversion isn’t failing. It’s operating as a brand awareness channel. Expecting it to perform like direct traffic is the mistake.

    The deeper financial metric is the LTV:CAC ratio. The ideal growth model targets a 3:1 LTV:CAC ratio, and not every channel gets you there. Paid search often wins on conversion speed but loses on retention, because intent-driven urgency doesn’t always translate to long-term loyalty. Organic and referral tend to produce customers who stay longer, which is why their lower short-term volume is often worth it.


    Traffic Source Breakdown: A Practical Audit Process

    Most marketing teams look at traffic dashboards weekly but audit the underlying data quality annually. That gap is where the mislabeled traffic accumulates.

    Step 1: Reconcile your attribution model. Compare what your ad platforms report against what your CRM shows. Due to iOS privacy changes and browser restrictions, ad platform pixels miss between 30% and 50% of real conversions. If your ads dashboard shows 200 conversions but your CRM shows 120 closed deals from the same cohort, you have an attribution gap.

    Step 2: Diagnose your direct traffic. Filter for “Direct” sessions landing on deep content pages like blog articles or product comparisons. If complex pages are showing up as direct, that’s almost certainly dark social or untagged email, not brand navigation. Homepage traffic being direct makes sense. Deep-content pages being direct usually doesn’t.

    Step 3: Run a technical check. One underappreciated cause of referral misattribution: HTTPS-to-HTTP redirects strip referrer data entirely. If any pages still serve on HTTP, all referral traffic to those pages will appear as Direct. Check your SSL coverage across all subdomains and confirm your consent banner is correctly configured so that users who accept tracking are being tracked.

    Step 4: Clean your UTM data. Pull a source/medium report for the past 90 days and look for variants of the same source spelled differently. Deduplicate and standardize. Build a shared UTM naming document that every team uses before publishing any link.

    Step 5: Score channels on value, not volume. Use the four-dimension matrix above. Flag channels with high spend and low LTV for review. Identify referral sources that are small in volume but high in conversion. Those are partnership opportunities worth scaling.

    Step 6: Build a monitoring cadence. Traffic attribution degrades over time as platforms change, tracking consent rules evolve, and link-sharing behavior shifts. A quarterly audit prevents six months of bad data from compounding into a year of bad decisions.


    AI Search Is Now a Website Traffic Source. Most Analytics Tools Can’t See It.

    This is the part most traffic source breakdowns miss entirely.

    AI platform-driven referral traffic grew by 357% between June 2024 and June 2025ChatGPT alone accounts for 87.4% of all AI referral traffic. Users are asking ChatGPT, Perplexity, and Gemini for product recommendations, and those platforms are linking out to brand websites in their answers.

    That’s a real traffic source. But GA4 doesn’t have an “AI Search” channel.

    Some of that traffic shows up under Referral, but inconsistently. ChatGPT’s paid subscribers often browse without passing referrer data, meaning the highest-intent AI users, the ones who pay for a premium tool and follow its recommendations, register in your analytics as Direct. You can’t see them. You can’t measure what AI said to send them.

    The conversion quality is substantial. AI referral traffic converts at 5 to 23x the rate of traditional organic search. That’s because AI platforms function as recommendation engines: by the time a user clicks a link from a ChatGPT response, the AI has already completed an initial qualification pass. The user arrives with a formed opinion and high purchase intent.

    On top of that, when AI Overviews appear in Google search results, organic CTR drops by 67.8%. Brands cited inside those AI Overviews, however, receive 35% more organic clicks than brands that don’t appear. Being visible in AI answers is no longer a future consideration. It’s already changing how traffic distributes across channels.

    For teams that want to measure and optimize this channel, Topify tracks brand visibility across ChatGPT, Gemini, Perplexity, and other major AI platforms. Its AI Volume Analytics and Visibility Tracking surface which prompts are driving AI recommendations in your category, how often your brand appears in responses, and which domains AI platforms are citing as sources. In practice, this fills the attribution gap that every traditional analytics tool currently has when it comes to AI-generated traffic.

    Get started with Topify to see where your brand stands across the AI channels your analytics dashboard can’t measure.


    Conclusion

    Website traffic sources haven’t changed in name. Organic, paid, direct, referral, social, email: those six categories still dominate every analytics report. What has changed is how much noise exists inside each label, and how consequential that noise is for decision-making.

    Dark social is hiding your most trusted referrals inside your direct traffic. Missing UTMs are sending your best social campaigns to the same bucket. And a fast-growing, high-converting traffic source called AI search is either showing up as referral or not showing up at all.

    The teams that win the next few years of traffic competition won’t be the ones with the highest volume. They’ll be the ones who actually know where their traffic is coming from, including the sources that today’s dashboards were never built to see.


    FAQ

    Q: How do I reduce reliance on paid traffic with organic growth?

    A: Start by identifying which paid campaigns generate customers with the highest LTV, not just the highest conversion rate. Paid channels often win on short-term conversion but lose on retention. Build content assets targeting the same high-intent queries your paid campaigns cover, and shift budget incrementally as organic rankings improve. The transition typically takes 6 to 12 months before organic can offset paid volume, but the long-term cost structure is significantly better.

    Q: How do I track dark social traffic that goes unattributed?

    A: Add UTM parameters to every link you share, including in internal Slack channels, newsletters, and email outreach. For content you know gets shared privately, monitor for spikes in direct traffic to specific deep pages as a proxy indicator. Some teams use campaign-specific landing pages with unique URLs to make private sharing traceable. Full dark social attribution isn’t achievable without consent-based identity resolution, but structured UTMs eliminate the most preventable leakage.

    Q: How do I attribute conversions to the right traffic source when users touch multiple channels?

    A: Last-click attribution gives credit to the final touchpoint and systematically undervalues brand-building channels like organic social and display. Data-driven attribution, available in GA4, distributes credit across the full path. For B2B with longer sales cycles, a time-decay or position-based model often captures multi-touch reality more accurately. The key is picking one model and applying it consistently, then comparing channels using the same rules.

    Q: How do I grow referral traffic through backlinks and partnerships?

    A: Quality matters far more than volume. One link from a high-authority publication in your vertical delivers more SEO value than dozens of low-quality directory links. The most scalable approach is digital PR: producing data-driven or original research content that journalists and bloggers link to naturally. Direct partnership programs with complementary tools or services, where you cross-link in product documentation or resource pages, tend to produce referral traffic with strong conversion rates because the audience overlap is intentional. Companies with a structured link-building strategy earn 97% more inbound links than those without one.


    Read More

  • Google Search Console: Where Most SEOs Leave Clicks

    Google Search Console: Where Most SEOs Leave Clicks

    You ran a report last week. Rankings look stable. Average positions haven’t moved much. But organic clicks are down.

    That gap between “ranking fine” and “getting traffic” is exactly why learning to read Google Search Console properly matters more now than it did three years ago. GSC is still the most direct, server-side data feed you have for understanding how Google sees your site. But it rewards practitioners who go beyond surface metrics.

    This guide covers how to actually use it.

    What Google Search Console Measures (and What It Deliberately Skips)

    GSC gives you four core metrics in the Search Performance report: Total Clicks, Total Impressions, Average CTR, and Average Position. Each one measures something different, and they interact in ways that trip up a lot of analysts.

    An impression is counted when your URL appears in a Google result. A click is counted when a user transitions from the SERP to your page. Average Position is the mean rank of your topmost appearing link across all searches. Here’s the part that trips people up: position is only recorded when an impression occurs, so a page with zero impressions will show no position data at all.

    What GSC doesn’t track: direct traffic, social, email, paid ads, or any clicks coming from ChatGPT, Perplexity, or Gemini. If someone finds your brand through an AI answer and types your URL directly, GSC never sees it. That’s not a bug. It’s just a scope boundary you need to plan around.

    How to Read the Search Performance Report Without Getting Confused by the Numbers

    Open the Search Performance report and you’ll see aggregate numbers across your full property. The data starts to become useful when you filter by dimension: Query, Page, Country, or Device.

    The most common misread is treating Average Position as a single, stable number. It’s an average across all searches that triggered an impression, which means a volatile long-tail keyword portfolio can make your “position” look artificially steady even when core rankings are slipping.

    The metric interaction that matters most is stable position + declining clicks. That combination typically signals one thing: a zero-click shift. Google’s SERP features answered the query. Your GSC keyword tracking data confirms your ranking; your click data confirms users didn’t need to leave Google to get what they came for.

    Zero-click searches now account for approximately 60% of all global searches. On mobile, that number reaches 77.2%. For informational queries where an AI Overview appears, click-through rates can drop by as much as 61%.

    How to Find Quick-Win Keywords in Google Search Console

    This is the most actionable thing most SEO teams can do in an afternoon.

    Filter the Search Performance report for Average Position between 10.9 and 20. Sort the results by Impressions descending. What you’re looking at are keywords where Google already considers your page relevant, but you’re sitting on page two where less than 1% of all organic clicks actually land.

    Moving a keyword from position 15 to position 8 can push CTR from roughly 0.78% to around 3%, which is close to a 10x improvement in clicks without acquiring a single new backlink.

    The workflow from there: cross-reference those keywords with the Pages tab to identify which specific URL is ranking. Then run a content refresh. Add updated statistics. Improve the internal link equity pointing to that page. Rewrite the title tag with something more specific. Brackets in titles, for instance, have been shown to improve CTR by nearly 40%.

    This is what a functional search performance report is actually for: not just tracking what you have, but surfacing what’s close enough to move.

    Google Search Console vs GA4: Two Lenses, Not One

    The data mismatch between GSC and GA4 is one of the most frequently asked questions in SEO forums, and it has a straightforward answer: the two tools don’t measure the same thing.

    GSC answers “how did Google handle this page in search?” GA4 answers “what did users do after they arrived?” They’re complementary, not redundant.

    FeatureGoogle Search ConsoleGoogle Analytics 4
    Primary questionHow Google sees your siteHow users behave on your site
    Data sourceGoogle’s internal logs (server-side)Client-side JavaScript
    Affected by ad blockersNoYes
    TimezoneFixed to PDTConfigurable
    Traffic types coveredGoogle organic onlyAll channels
    Real-time capability48-72 hour lag (24-hr comparisons as of June 2025)Near-instant

    How to connect Google Search Console with GA4: Go to GA4 Admin, then Product Links, then Search Console Links. Pair your GSC property with a web data stream. Then publish the Search Console collection in the GA4 Library so it appears in your primary reporting menu. Once linked, you can see which search queries drove specific conversions, something neither tool can show in isolation.

    The integrated view is where the real decisions happen.

    How to Use Search Console Data to Improve Your Content Strategy

    GSC is useful for finding what to create. It’s even more useful for finding what to fix.

    A page with high impressions and low CTR is a clear editorial signal: Google considers you relevant, but your snippet isn’t winning the click. The fix is rarely about the content itself. It’s about the title tag and meta description. Adding a specific year, a number, or a benefit-forward phrase often shifts the click equation meaningfully. Structured data markup for FAQs and reviews can increase clicks by up to 58% in the right categories.

    Content decay shows up differently. A page that used to rank well but is now at position 12-18 with steady impressions tells you the content is aging, not irrelevant. That’s a refresh candidate. Bloggers who update old posts are 2.5x more likely to report strong results compared to those who focus only on publishing new content.

    Use the Country filter to identify regional performance gaps. If a page drives strong impressions in the UK but weak clicks, the problem might be localization, not rankings.

    And don’t skip sitemap submissions. Sites with XML sitemaps get indexed 33% faster, which matters whenever you’re publishing time-sensitive content or launching new product pages.

    How to Fix Crawl Errors Found in Google Search Console

    The Coverage report is where silent technical problems surface.

    “Errors” are unintentional failures: 404s, 5xx server errors, redirect loops. “Excluded” pages are usually intentional (noindex tags, canonical redirects) and don’t need immediate action. The distinction matters because practitioners who treat all excluded URLs as problems end up chasing ghosts.

    Persistent 5xx server errors are the most urgent. Google de-prioritizes unreliable sources fast. If your server is timing out on Googlebot requests even occasionally, that’s a ranking risk that no amount of content optimization can offset.

    Use the URL Inspection tool for individual page debugging. It renders the page exactly as Googlebot sees it, making it possible to identify JavaScript dependencies that are failing to load or resources Googlebot can’t access.

    Pages that meet Core Web Vitals thresholds are 24% less likely to be abandoned by users. A one-second delay in load time correlates with a 7% reduction in conversion rates. CWV isn’t glamorous, but it functions as a tie-breaker when two pages are otherwise equivalent in quality and authority.

    The Traffic Google Search Console Can’t See

    Here’s the structural problem with relying on GSC as your only source of search truth.

    Organic traffic across diverse industries has declined by a median of 10% to 14%, even as total search query volume reaches record highs. That gap isn’t a measurement error. It’s a structural shift: AI search engines and AI Overviews are intercepting a growing share of queries and delivering answers without routing users to external pages.

    GSC has no visibility into this. If your brand appears in a ChatGPT or Perplexity answer 500 times today, your GSC dashboard shows nothing. If AI platforms are misrepresenting your product, positioning you incorrectly, or not citing your content at all, GSC can’t alert you.

    The metric that’s emerging as a leading indicator here isn’t backlinks. It’s brand mentions. Brand mentions across the web correlate with AI search visibility at a coefficient of 0.664, compared to just 0.218 for traditional backlinks. Perplexity, for instance, draws 46.7% of its top citations from Reddit. ChatGPT skews toward Wikipedia, major publications, and high-authority review platforms.

    This is where a tool like Topify closes the gap. Topify tracks how AI platforms, including ChatGPT, Gemini, and Perplexity, are responding to prompts relevant to your brand. Its Source Analysis feature maps exactly which domains and URLs AI engines are citing in your category, so you can identify where your content is missing from the conversation and which third-party sources are worth prioritizing for mentions or contributions.

    For teams already fluent in GSC, Topify functions as the adjacent layer: GSC tells you how Google ranks you, Topify tells you what AI says about you. Both are now necessary for a complete picture of search visibility.

    If you’re ready to see where your brand stands in AI search, you can get started with Topify alongside your existing GSC setup.

    Conclusion

    Google Search Console is still the most authoritative free dataset for understanding how Google processes your site. The Search Performance report, the Coverage diagnostic, and the URL Inspection tool give you more actionable insight than most paid platforms offer for the same data category.

    But the definition of search performance is changing. Ranking #1 on Google and capturing 27.6% to 39.8% of available clicks is meaningfully different from ranking #1 in 2026, when an AI Overview can cut that same position’s CTR by 32% before anyone scrolls down. GSC shows you what happened on Google. Building a complete view of your brand’s search presence now requires tracking what AI says, too.

    Start with the fundamentals: clean up your Coverage report, run the Page 2 keyword workflow, link GSC to GA4, and refresh your highest-impression, lowest-CTR pages. Then extend your measurement framework to cover AI search. That’s the sequence.


    FAQ

    Q: How do I use Google Search Console to analyze website traffic?

    A: Open the Search Performance report and switch between the Query, Page, Country, and Device dimensions. Clicks tell you actual traffic; Impressions tell you exposure. The combination of high impressions with low CTR is your most actionable signal. As of the June 2025 update, you can also run 24-hour comparisons to catch sudden traffic drops faster.

    Q: How do I connect Google Search Console with GA4?

    A: In your GA4 property, go to Admin, then Product Links, then Search Console Links. Select your GSC property and pair it with your web data stream. Once linked, publish the Search Console collection in the GA4 Library. You’ll then be able to see which search queries are driving specific conversions, something neither platform shows on its own.

    Q: How do I find quick-win keywords in Google Search Console?

    A: Filter the Search Performance report by Average Position (greater than 10.9), then sort by Impressions descending. Keywords between positions 11 and 20 are your quick wins: Google already considers your page relevant, and a targeted content refresh can move these rankings to page one, where click-through rates jump roughly 10x.

    Q: What’s the difference between Google Search Console and Google Analytics?

    A: GSC shows how Google processes and displays your site in search results. GA4 shows what users do after they arrive. GSC is server-side and unaffected by ad blockers; GA4 relies on client-side JavaScript and can miss traffic from privacy-conscious users. Use GSC to optimize visibility and rankings, use GA4 to optimize user behavior and conversion paths, and connect both for a complete view.


    Read More

  • Your Brand Is Getting Traffic from ChatGPT. Here’s How to Track and Grow It.

    Your Brand Is Getting Traffic from ChatGPT. Here’s How to Track and Grow It.

    You’re probably already getting traffic from ChatGPT and Perplexity. You just can’t see it.

    Most of it is landing in your GA4 as “Direct” or “Unassigned.” Not because tracking is broken, but because the default setup was never designed for a world where AI platforms send users to websites. The referrer handshake gets stripped before it arrives. The session gets miscategorized. And the visit disappears into a bucket you’re not watching.

    This is the attribution blind spot that’s quietly growing larger every month.

    Here’s what’s actually happening, why it matters, and what you can do about it.


    AI Referral Traffic Is Already in Your GA4. You’re Just Not Seeing It.

    Approximately 70.6% of every AI referral arriving at a website is invisible in Google Analytics 4, classified as “Direct” or “Unassigned.” That number isn’t a rounding error. It’s a structural problem rooted in how modern browsers handle referrer headers.

    When a user clicks a link inside ChatGPT or Perplexity, the browser applies a strict-origin-when-cross-origin policy by default, which now governs over 90% of global web traffic. In practice, this strips the path and query string from the referrer header, leaving GA4 with just the base origin at best, or nothing at all.

    It gets worse at the premium tier. ChatGPT’s paid accounts frequently use the rel="noreferrer" attribute on outbound links, which explicitly blocks any referral information from passing through. These are your highest-intent visitors, the ones who pay for the product, and they’re the most likely to show up as ghosts in your dashboard.

    Native mobile apps compound the problem further. When an AI app opens a link inside a WebView or in-app browser, those environments increasingly strip referrers to comply with cross-app tracking restrictions. As AI discovery shifts toward mobile assistants, the “Direct” bucket will keep growing.

    That’s the gap most brands still can’t see.

    ScenarioWhat GA4 Shows
    HTTPS AI Site → HTTPS Brand SiteReferral (origin only)
    HTTPS AI Site → HTTP Brand SiteDirect / (none)
    Paid ChatGPT account clickDirect / (none)
    Mobile AI app (WebView)Direct / (none)
    User copies and pastes AI recommendationDirect / (none)

    Why AI Search Traffic Behaves Nothing Like Organic Search

    Before setting up tracking, it’s worth understanding what you’re actually measuring, because AI search traffic and traditional organic traffic are fundamentally different products.

    When someone clicks from a Google result, they’re still exploring. They’ve seen a title and a meta description. They’re not sure you’re the answer yet.

    When someone clicks from a Perplexity or Gemini citation, the AI has already synthesized a recommendation on their behalf. The information-gathering phase happened inside the interface. The website visit is the transaction.

    This “pre-qualification effect” shows up directly in the data. Analysis across 101,000 websites and nearly 2 million AI-driven sessions shows that AI referral traffic converts at 1.94% on average, compared to 1.14% for traditional organic search. For sign-up flows, the gap is even wider: AI-referred users convert to sign-ups at 1.66%, versus 0.15% for organic. That’s an 11x difference.

    AI-referred visitors do spend less time on-site and visit fewer pages. That’s not a quality problem. They already have what they need from the AI interface. They came to your site to act, not to browse.

    MetricTraditional Organic SearchAI Referral Traffic
    Avg. Conversion Rate1.14%1.94%
    Sign-up Conversion Rate0.15%1.66%
    Subscription Conversion0.55%1.34%
    Avg. Pages per Session2.521.86
    High-Intent Page Penetration0.13%0.46%

    The volume is still small. AI search traffic accounts for roughly 0.15% to 0.25% of total global internet traffic. But the ROI profile is closer to a paid channel than organic. Treating it as background noise is a missed opportunity.


    How AI Search Engines Actually Send Traffic to Your Website

    Not all AI-driven traffic works the same way. There are three distinct mechanisms, and each requires a different tracking approach.

    Inline citation links are the most direct. Perplexity, Gemini, and increasingly Copilot place numbered or hyperlinked sources directly within the response body. These generate identifiable referral sessions and are the easiest to track.

    Brand mentions without links are where most of the volume hides. ChatGPT frequently recommends brands by name without attaching a URL. The user reads the recommendation, then opens a new tab and searches for the brand name. This shows up in your analytics as branded organic search, not AI traffic, even though the AI was the actual discovery channel.

    Source bibliographies appear at the bottom of AI responses as a “Sources” or “Read More” section. These generate real referral traffic, but the click-through rate is lower than inline citations because the user has to scroll past the answer to find them.

    This creates what researchers call the “Mention-Source Divide.” An AI platform might cite your content for accuracy while recommending a competitor by name. Or it might recommend your brand without ever linking to you. Currently, 73% of AI brand presence consists of “Ghost Citations” where a website is used as a source but the brand name is never explicitly recommended in the answer.

    Understanding which of these three mechanisms is driving your brand matters for how you optimize.


    How to Set Up AI Search Traffic Tracking in GA4

    The goal here is to rescue the identifiable AI referral traffic from the generic “Referral” bucket and give it its own channel. Here’s the setup.

    Step 1: Create a Custom Channel Grouping

    In GA4, go to Admin > Data Display > Channel Groups. Copy the default grouping to preserve your historical data, then create a new channel called “AI Search” or “LLM Traffic.”

    Set the condition to “Source matches regex” and use this pattern:

    chatgpt\.com|chat\.openai\.com|perplexity\.ai|gemini\.google\.com|claude\.ai|copilot\.microsoft\.com|deepseek\.com|grok\.com|x\.ai|openai\.com

    One step that most guides skip: drag the “AI Search” channel to the very top of your channel list. GA4 evaluates rules sequentially. If “Referral” sits above “AI Search,” the AI traffic gets captured by the first matching rule and never reaches your custom category.

    Step 2: Track Google AI Overviews Specifically

    Google AI Overviews append a fragment like #:~:text= to links they serve. GA4 strips these by default. Create a custom dimension for the full page URL to isolate these AI-specific entry points. Brands cited in Google AI Overviews earn 35% more organic clicks than those not cited, even when both rank in the top 10 organically.

    Step 3: Build an AI Referral Segment

    In GA4 Explorations, create a dedicated AI Referral segment. This lets you compare session quality between AI-referred users and traditional organic users, specifically bounce rate, session duration, and conversion rate per channel.

    Step 4: Track Branded Search as a Proxy Signal

    Since GA4 can’t capture the noreferrer traffic, use Google Search Console to monitor branded search volume. When your AI visibility increases, branded search typically follows. A rising correlation between AI mention rate and branded query volume is your indirect attribution signal for unlinked mentions.

    Tracking LayerMethodWhat It Captures
    Direct measurementCustom Channel GroupingIdentifiable AI referrals
    Proxy signalBranded search in GSCUnlinked AI brand mentions
    Technical hygieneServer log analysisBot vs. real user validation
    Deep content spikesDirect traffic segmentationNoreferrer high-intent sessions

    The AI Search Visibility Landscape in 2026: More Platforms Than You Think

    Here’s something worth building into your tracking setup from day one: the AI referral market is no longer a one-platform story.

    ChatGPT’s referral share dropped from 86.7% in January 2025 to 64.5% in January 2026. That’s a 22-point decline in 12 months. Meanwhile, Gemini’s referral traffic to external websites grew 115% between November 2025 and January 2026, a pace 12x faster than earlier in the year, enough to overtake Perplexity in global referral volume.

    Microsoft Copilot grew from 2.1% to 12.8% of referral share over the same period. DeepSeek captured 4.2% of AI traffic share almost immediately after launch.

    AI PlatformJan 2025 Referral ShareJan 2026 Referral Share
    ChatGPT86.7%64.5%
    Google Gemini5.7%21.5%
    Perplexity AI8.6%5.5%
    Microsoft Copilot2.1%12.8%
    Claude (Anthropic)0.6%4.9%
    DeepSeek<1%4.2%

    A strategy that only optimizes for ChatGPT is now ignoring over 35% of the generative traffic market. Your GA4 regex, your content strategy, and your monitoring setup all need to account for this fragmentation.


    Why GEO Visibility Doesn’t Automatically Translate to Traffic (And What CVR Actually Measures)

    This is the insight most brands miss.

    Being mentioned by an AI platform and receiving website traffic from it are two very different things. An AI can recommend your brand dozens of times per day without generating a single trackable session. This happens in zero-click environments, where the AI provides a complete enough answer that the user has no reason to click through.

    The metric that bridges this gap is CVR (Conversion Visibility Rate): the ratio of actual website visits to the number of times a brand was mentioned or cited across a set of prompts. A high visibility score with a low CVR tells you the AI is using your brand to answer questions without sending traffic. A lower visibility score with a strong CVR tells you that when you do get mentioned, your brand positioning drives action.

    Several factors directly influence CVR. First-position recommendations matter most: AI citations that appear in the first 30% of a response receive the majority of clicks. The sentiment context matters too. If an AI consistently frames your brand as a budget option when your actual positioning is premium, users ignore the recommendation even when they see it.

    This is where Topify fills a gap that GA4 can’t. Topify’s CVR metric tracks the efficiency of your AI visibility across ChatGPT, Gemini, Perplexity, DeepSeek, and other major platforms, not just whether you appear, but whether that appearance drives real traffic. Combined with its AI Volume Analytics, which surfaces the high-intent prompts where your brand currently gets no visibility, and Source Analysis, which shows which of your pages AI platforms are actually citing, it gives you a complete picture of why your GEO visibility is or isn’t converting to sessions.

    Most analytics tools tell you how much traffic arrived. Topify tells you how much visibility you left on the table.


    How to Grow Website Traffic Through AI Platform Visibility

    Once tracking is in place, the growth question becomes: what makes AI platforms more likely to cite and recommend your brand with a link?

    Content with higher factual density improves AI visibility by 41%. Pages that lead with verifiable statistics, specific numbers, and expert attributions are more likely to be cited because AI systems use them as reliable evidence. Strict hierarchical heading structure (H1/H2/H3) increases citation likelihood by 2.8x because it maps cleanly to how AI models parse and extract content.

    One structural pattern stands out: “Answer Capsules,” a concise summary of the key point placed in the first 30% of the text, account for 44% of AI citations. If your content buries the answer below the fold, AI platforms are less likely to use it.

    On the technical side, 69% of AI crawlers cannot execute JavaScript. If your content depends on client-side rendering, large portions of it are simply invisible to these systems. Server-side rendering isn’t optional for AI discoverability.

    Three levers worth prioritizing:

    Expand prompt coverage. Most brands are visible for a narrow set of queries. Using AI Volume Analytics (available in Topify’s Pro plan) surfaces the high-volume prompts in your category where competitors are being recommended and you’re not. That’s where the growth surface is.

    Fix the source-mention gap. If Source Analysis shows that AI platforms are citing your pages but not mentioning your brand by name, the content is being used as evidence without you getting credit. Restructuring those pages to make the brand’s role explicit in the answer text fixes this.

    Monitor competitor positioning. AI recommendations shift. A competitor that’s currently ranked second in ChatGPT responses can move to first within weeks if they publish the right content. Topify’s Competitor Monitoring tracks position changes across platforms in real time, so you see the shift before it affects your traffic numbers.


    Conclusion

    AI search traffic is already a real channel. It’s small by volume, but the conversion data is hard to argue with: higher sign-up rates, higher subscription rates, and users who arrive with intent already formed.

    The problem isn’t the traffic. It’s the infrastructure. Most brands are running a 2023 analytics setup in a 2026 discovery environment. The fix is straightforward: custom GA4 channel groupings, branded search monitoring as a proxy signal, and a measurement layer that connects GEO visibility to actual sessions.

    Getting that infrastructure right is the first step. Growing from there requires knowing which prompts drive traffic, which platforms are sending it, and whether your brand is being cited or just mentioned. Those are questions GA4 alone can’t answer.


    FAQ

    How do I track traffic coming from ChatGPT and Gemini? 

    In GA4, create a Custom Channel Grouping using a regex pattern that includes chatgpt\.comopenai\.comgemini\.google\.com, and other AI platform domains. Drag this rule to the top of your channel list so it captures traffic before the generic “Referral” rule does.

    Why are AI platforms becoming a new traffic source? 

    AI search engines use Retrieval-Augmented Generation (RAG) to find and synthesize web content. When they cite sources, they give users a direct path to verify or act on a recommendation. This turns the AI interface into a pre-qualification layer that filters out low-intent users before they ever reach your website.

    How do I measure the conversion rate of AI search traffic? 

    Once AI traffic is isolated in its own GA4 channel, apply it as a filter in your User Acquisition or Ecommerce reports. Compare “Session Conversion Rate” for the AI channel against your organic search baseline. Expect AI-referred traffic to convert at a higher rate with lower pages-per-session.

    What metrics matter most for measuring AI search traffic performance? 

    The three to prioritize are AI Share of Voice (how often you appear vs. competitors across relevant prompts), Citation Rate (how often your appearance includes a clickable link), and CVR (how efficiently your AI visibility translates into actual website sessions).

    How do I attribute revenue to AI search traffic sources? 

    Combine identifiable referral revenue tracked in GA4 with branded search volume data from Google Search Console. Because AI brand mentions without links often result in a branded search, a rising correlation between AI visibility growth and branded query revenue is your primary attribution signal for unlinked discovery.

    How do I track referral traffic from Perplexity and DeepSeek specifically? 

    Add perplexity\.ai and deepseek\.com to your GA4 regex pattern alongside the other AI platform domains. Monitor them as separate dimensions in your Explorations report to see platform-level volume differences. DeepSeek captured 4.2% of global AI referral share within weeks of its major launch, so it’s worth tracking from the start.


    Read More

  • Website Traffic Analysis: The Complete Guide

    Website Traffic Analysis: The Complete Guide

    Your Google Analytics dashboard looks fine. Traffic is up. Engagement is decent. But somewhere between your reports and reality, a growing category of high-intent visitors is slipping through untracked, showing up as “Direct” with no referral context, no source, no campaign. They came from ChatGPT or Perplexity. You’ll never know.

    That’s not a GA4 configuration problem. It’s a structural gap in how website traffic analysis was designed, and in 2026, it’s getting harder to ignore.

    This guide covers the full picture: how to read traditional traffic data well, how to diagnose drops, how to connect analytics to performance, and how to account for the channel your current stack can’t measure.

    The 6 Traffic Sources You Need to Track (One Keeps Growing Invisibly)

    Most teams still operate with a five-channel mental model: Organic Search, Direct, Referral, Social, and Paid. That model was accurate until about two years ago.

    As of Q1 2026, AI-referred traffic accounts for 12% to 18% of total global web referral traffic, up from 5-8% in late 2024. That’s 150-200% year-over-year growth. It’s no longer a rounding error.

    Here’s the problem. AI-referred traffic doesn’t travel cleanly. When a user clicks a link inside ChatGPT’s paid interface, the platform strips the referrer header. GA4 logs the session as “Direct.” The visitor came pre-qualified, already past the evaluation phase, ready to engage. You just have no idea they exist.

    Organic search still drives approximately 46.98% of global web traffic, and it remains the backbone of any sustainable acquisition strategy. But the gap between “search volume” and “clicks” is widening fast. More on that shortly.

    How to Use GA4 for Website Traffic Analysis

    GA4 is more capable than most teams give it credit for, but it rewards specificity. The default reports are a starting point, not a finish line.

    The most common mistake is conflating the User Acquisition and Traffic Acquisition reports. They answer different questions. User Acquisition is scoped to the first session: it tells you how a person originally discovered your site. Traffic Acquisition is session-scoped: it tells you what drove each individual visit, new or returning.

    That distinction matters when you’re measuring attribution. A user who discovered you via organic social, then converted three weeks later through a newsletter click, will show up differently in each report. One credits social. One credits email. Neither is wrong. They’re just answering different questions.

    For most practical traffic analysis, start with Traffic Acquisition. Filter by channel, segment by landing page, and correlate with engagement rate. If you’re measuring the long-term payoff of brand campaigns or awareness content, switch to User Acquisition.

    What GA4 Still Can’t Tell You

    GA4 has a structural attribution problem in the AI era. Research across millions of sessions found that approximately 22% of ChatGPT sessions and 32% of Perplexity sessions are categorized as “(not set)” or absorbed into Direct traffic. The referrer data simply doesn’t transfer.

    This isn’t a bug you can fix with better UTM hygiene. It’s an architectural reality of how major AI platforms handle outbound links.

    How to Read Organic Traffic Data and Find What’s Actually Working

    Google Search Console is the most underused tool in the average analyst’s stack.

    Most teams look at clicks and call it done. The real signal is in the Impressions vs. Clicks ratio. A page with 50,000 monthly impressions and 300 clicks isn’t performing well. It’s ranking for queries where nobody needs to click. That distinction changes your optimization strategy entirely.

    AI Overviews now appear in over 40% of U.S. queries, and when they’re present, the CTR for traditional results drops from a baseline of 15% to 8%. For informational queries, you may be “winning” in impressions while losing in traffic.

    The practical implication: look for pages where you rank in positions 4-10 with solid impressions. Those are your highest-leverage CTR optimization targets. Rewrite the meta title and description to address the specific intent, not just match the keyword.

    For identifying which pages get the most traffic, GA4’s Landing Page report (under Engagement) gives you session volume by entry point. Sort by sessions, then cross-reference with average engagement time. High traffic plus low engagement usually means either wrong audience or misaligned content.

    How to Diagnose a Traffic Drop Before Your Boss Asks

    Traffic drops tend to have three possible causes: algorithm, technical, or content. They rarely announce which one.

    The December 2025 Core Update introduced stricter AI content detection, targeting pages with what Google classified as “generic phrasing patterns” and thin E-E-A-T signals. Sites that dropped 50% or more typically lacked verifiable author credentials, original research, or first-hand experience signals.

    Start with this sequence when diagnosing a drop:

    First, check GSC’s Coverage report for new “Crawled – currently not indexed” pages. If previously indexed content is being excluded, that’s a signal, not a coincidence.

    Second, check Core Web Vitals. Sites with an LCP exceeding 3 seconds experienced 23% more traffic loss than faster competitors in the December 2025 cycle. What looks like a content penalty is sometimes a performance regression from a recent deploy.

    Third, look at whether the drop is query-wide or page-specific. A broad organic decline across dozens of pages suggests an authority or algorithm signal. A drop on a single cluster of pages usually points to content quality or cannibalization.

    Fourth, check for seasonality before escalating. A March traffic dip for a retail brand is rarely newsworthy.

    Document what you find against a 12-month calendar view in GA4. Comparing week-over-week without accounting for seasonal patterns produces a lot of false alarms.

    The Traffic Your Analytics Dashboard Can’t See

    This is the part most website traffic analytics guides skip.

    ChatGPT now processes more than 2.5 billion prompts dailyGoogle AI Overviews reach 2 billion users monthly. A material portion of your potential customers are discovering, evaluating, and selecting brands inside conversational AI interfaces before they ever touch a search result page.

    When that discovery happens and the user clicks through to your site, your GA4 shows “Direct.” There’s no source. No medium. No referral path. The influence of the AI recommendation is invisible in your reporting.

    That invisibility compounds. Users who learn about a brand from ChatGPT often don’t click immediately. They’ll search your brand name on Google later. GA4 attributes that session to “Organic Search,” hiding the original AI influence entirely. This is sometimes called the Branded Search Cascade, and it systematically understates the value of AI-channel visibility.

    Topify was built to solve this specific gap. Rather than crawling SERPs, it probes LLM interfaces directly, tracking brand mentions, recommendation positions, and sentiment across ChatGPT, Gemini, Perplexity, and other major AI platforms. The platform’s Visibility Tracking feature monitors how often your brand appears in AI responses to relevant queries. Its AI Volume Analytics surfaces the actual prompt clusters your target audience is using, based on real AI search behavior rather than estimated keyword volumes.

    For teams that are already good at GA4 and GSC, this is the layer that fills the remaining blind spot. It answers the question your current stack structurally cannot: is your brand being recommended by AI, and what does that look like compared to your competitors?

    How to Connect Traffic Data to Marketing Performance

    Traffic volume is a leading indicator. Revenue is the lagging one. The teams that lose credibility in reporting are the ones who treat the two as the same.

    The practical framework: measure traffic at the channel level, engagement at the page level, and conversion at the funnel level. Each layer has a different owner and a different optimization lever.

    For content specifically, the cleanest way to measure impact is to track organic sessions to a page over the 90 days following publication, then compare against a pre-publication baseline. This controls for seasonality without needing a complex cohort model.

    UTM parameters are non-negotiable for any traffic source you control. Every link in email campaigns, social posts, and paid placements should carry campaign-level tags. Default GA4 groupings for these channels are inconsistent and often wrong.

    B2B companies with structured lead generation processes see 133% more revenue than those without. Most of that gap isn’t channel selection. It’s attribution discipline. Teams that know exactly which content and channel combinations drive pipeline make better investment decisions, full stop.

    The metric worth adopting at the leadership level is Marketing Efficiency Ratio (MER): total revenue divided by total ad spend. Unlike Last-Click ROAS, MER accounts for unmeasurable influence channels like AI discovery and brand awareness content. It gives leadership a denominator that reflects how the modern funnel actually works.

    Website Traffic Analysis Tools: A Practical Comparison

    You don’t need a six-figure analytics stack to do this well. You need the right tools for the right questions.

    GA4 + Google Search Console are the non-negotiable foundation. GA4 covers on-site behavior. GSC covers search visibility and index health. Together, they answer 80% of day-to-day traffic questions. Both are free.

    For competitive traffic analysis, Semrush’s database of 25 billion keywords makes it the standard for identifying content gaps and tracking ranking movements. SimilarWeb is better suited for market share analysis and understanding competitor referral sources at scale. Both have SMB-tier pricing, but enterprise features carry enterprise costs.

    For AI visibility tracking, these tools have limited coverage. That’s where specialized platforms like Topify fill the gap. Traditional SEO tools weren’t designed to probe LLM query interfaces. They measure what happened on SERPs. Topify measures what’s happening inside the AI conversation before the user ever reaches a SERP.

    ToolPrimary Use CaseAI VisibilityCost Profile
    GA4On-site behavior trackingNoneFree
    Google Search ConsoleOrganic search visibilityLimitedFree
    SemrushSEO/PPC tactical executionEmergingSMB-friendly
    SimilarWebMarket share & competitive researchLimitedEnterprise-focused
    TopifyAI-channel visibility & GEOFull coverageAI strategy-first

    For small businesses doing website traffic analysis with a limited budget, start with GA4 and GSC. Add a competitor tool when you have a clear content strategy to validate. Layer in AI visibility tracking when you’re ready to measure the channel that’s growing fastest.

    Conclusion

    Website traffic analysis in 2026 is not fundamentally harder than it was five years ago. Most of the core questions are the same: where are visitors coming from, which pages drive value, what’s causing fluctuations.

    What’s changed is the surface area. AI platforms are now a primary discovery channel for high-intent audiences, and they operate almost entirely outside the visibility of traditional analytics infrastructure. GA4 and GSC remain essential. They just don’t cover everything anymore.

    The teams that will pull ahead are the ones that treat the GA4 “Direct” bucket with appropriate skepticism, build UTM discipline across every controlled channel, and invest in measurement tools that can reach into the AI conversation layer where purchase decisions are increasingly forming.

    Traffic you can’t see is traffic you can’t optimize.

    FAQ

    How to measure website traffic growth over time?

    Use both MoM (month-over-month) and YoY (year-over-year) comparisons in GA4 to control for seasonality. GA4’s Explore feature lets you build cohorts based on first-touch acquisition, which is useful for understanding the long-term value of users acquired in specific time periods rather than just looking at aggregate session counts.

    How to analyze website traffic for free?

    GA4 and Google Search Console cover the fundamentals at no cost. GA4 tracks what users do on your site; GSC tracks how they find it through organic search. For small businesses needing competitive context, Ubersuggest’s free tier or SimilarWeb’s browser extension provides a useful starting point. To track AI-platform traffic, you’ll need a dedicated tool, since neither GA4 nor GSC surfaces LLM referrals reliably.

    How to track website traffic sources?

    GA4’s Traffic Acquisition report maps sessions to default channel groupings using referrer headers. For any traffic source you control, add UTM parameters to every outbound link. For AI-native traffic, implement custom regex filters in GA4 Admin settings to catch identifiable referrals from domains like chatgpt.com or perplexity.ai, and treat unexplained “Direct” uplift as a proxy for AI influence you can’t yet attribute directly.

    How do I use website traffic analysis for SEO optimization?

    Correlate GSC impression data with GA4 engagement data at the page level. High impressions with low CTR typically points to a metadata problem. High CTR with high bounce rate usually means content-to-intent mismatch. In 2026, add an AI Overviews check: if a query triggers an AI Overview in GSC, the traffic potential from ranking alone is significantly lower, and optimizing for that query may mean targeting the AI citation rather than the click.

    How to analyze competitor website traffic?

    SimilarWeb provides panel-based traffic estimates for competitor domains, including referral source breakdowns and audience demographics. Semrush’s Traffic Analytics feature offers keyword-level data and visibility trends. Neither tool gives direct access to a competitor’s GA4 data, so treat estimates as directional signals for benchmarking rather than precise counts.

    Read More

  • Your Blog Has Traffic But No Pipeline. Here’s the Content Marketing Strategy Fix.

    Your Blog Has Traffic But No Pipeline. Here’s the Content Marketing Strategy Fix.

    You’ve published over 100 blog posts. Organic traffic looks solid. But qualified leads are close to zero, and your sales team keeps asking why marketing can’t source more pipeline.

    Here’s what’s actually happening: you have a content production problem disguised as a content quality problem. And in 2026, with AI assistants handling more of the buyer research process, the gap between “publishing content” and “having a strategy” has never been more expensive to ignore.

    54% of marketing leaders describe their content strategy as “advanced.” Only 19.1% can actually track how that content contributes to sales pipeline. That’s not a measurement problem. That’s a structural one.

    Most Content Teams Are Running Without a Map

    There’s a meaningful difference between a content production operation and a content marketing strategy. Most B2B teams have the first. Very few have the second.

    A production-centric model runs on an editorial calendar. Topics are picked by keyword volume, published on schedule, and measured by page views. It feels like progress because output is visible. The problem is that output without intent doesn’t build pipeline.

    A strategy-led model starts from the opposite end: What commercial decision do we need to influence? Which buyer persona needs to move? What does that person need to read at each stage of their journey to get closer to a “yes”? Every piece of content is engineered to move a specific person closer to a specific action.

    The performance gap is stark. Organizations with a documented and consistently executed strategy achieve conversion rates nearly 6x higher than teams running on volume alone.

    That said, only about 29% of B2B marketers view their documented strategy as “extremely effective.” Which means the majority are somewhere in between: they have a strategy on paper, but not one that’s connected to revenue.

    The Buyer Journey Is Your Editorial Strategy Backbone

    80% of the B2B buying journey now happens before a prospect ever speaks to a sales rep. 67-70% of buyers actively prefer a “rep-free” research experience, relying on content, peer reviews, and AI assistants to make decisions independently.

    This changes everything about how inbound marketing content should be structured.

    Most content teams invest heavily in TOFU — broad educational posts that attract traffic but don’t drive decisions. Roughly 90% of blog content in B2B sits at the awareness layer. But buyers engage with 3 to 7 pieces of content before reaching out to sales. If 6 of those 7 touchpoints are “awareness” content from your brand, you’ve missed every conversion window.

    The funnel math is unambiguous:

    Funnel StageIntent LevelContent TypesBenchmark CVR
    TOFUInformationalExplainer blogs, infographics0.3% – 0.6%
    MOFUInvestigatorySolution briefs, webinars, e-books1% – 3%
    BOFUDecisionalComparisons, ROI calculators, case studies5% – 10%+

    Effective blog content strategy doesn’t start by filling the top of the funnel. It starts by asking: do we even have the BOFU assets that let traffic convert? If those don’t exist, more TOFU traffic just means more bounce rate.

    High-performing editorial strategies are built bottom-up, with BOFU assets anchoring the architecture before TOFU content is scaled.

    Topical Authority Beats Volume. Every Time.

    Ranking for isolated keywords is no longer a durable growth strategy. Both Google and generative AI engines now evaluate “topical authority” — the depth and coherence of a brand’s coverage across an interconnected knowledge network.

    The pillar-cluster model is the most effective structure for building this authority. A pillar page covers a broad core topic comprehensively. Cluster pages go deep on specific sub-topics, linked back to the pillar through a deliberate internal linking architecture. The result isn’t just better rankings — it’s a content ecosystem that signals genuine expertise.

    The numbers back this up. Content organized into clusters drives approximately 30% more organic traffic and maintains rankings 2.5x longer than standalone posts. That longevity matters for ROI: evergreen clusters compound value over time rather than fading two weeks after publication.

    For content-led growth, the strategic implication is clear. When a brand covers a subject with 10 to 15 interconnected articles, it becomes the default recommendation — for Google and for AI assistants alike. ChatGPT and Perplexity prioritize sources with “entity authority,” meaning platforms that are recognized as definitive references for specific subject matter.

    This is where content funnel strategy meets AI search optimization. Topical authority isn’t just an SEO play anymore. It’s a prerequisite for being cited at all.

    Content Marketing for B2B: The Thought Leadership Layer

    B2B purchases involve long decision cycles (typically 6 to 18 months), 6 to 10 stakeholders, and high trust costs. Standard inbound marketing content handles awareness and education. But it doesn’t build the kind of credibility that moves a skeptical VP or technical evaluator.

    That’s the job of thought leadership content.

    97% of B2B marketers agree thought leadership is critical to full-funnel success. More specifically, 95% of decision-makers report that strong thought leadership makes them more receptive to sales outreach — even before they’ve had any direct contact with the vendor.

    The mechanism is simple: thought leadership doesn’t sell a product. It frames the buyer’s problem in a way that makes the vendor’s perspective feel indispensable. When a prospect arrives at a sales conversation already aligned with your worldview, the sales cycle can be shortened by up to 30%.

    Original research is 93% more effective at driving leads and building trust than generic commentary. Proprietary data — surveys, benchmarks, original analysis — creates content that can’t be replicated or commoditized. It also happens to be the single most reliable trigger for AI citations.

    One underused application: 47% of marketers stop using thought leadership after the sale. Yet it’s a primary driver of customer retention and expansion. Post-sale content that reinforces the wisdom of the initial purchase reduces churn and accelerates upsell cycles.

    Publishing Consistency Is a Lead Generation Engine

    45% of B2B content marketers cite the inability to scale production as their primary operational challenge. The solution isn’t more headcount. It’s building a content engineering workflow: repeatable processes that integrate AI tools, repurposing frameworks, and clear ownership at every stage.

    The data on publishing frequency is hard to ignore. B2B companies that publish 16 or more blog posts per month generate 4.5x more leads than those publishing 0 to 4 times per month.

    That number isn’t an argument for publishing filler. It’s an argument for building systems that make consistent, high-quality publishing operationally achievable.

    Repurposing is the highest-leverage move for teams with limited budgets. A single well-researched pillar post can generate a LinkedIn article series, an email nurture sequence, a webinar script, and three short-form video scripts — all without starting from zero. Emails informed by published blog content improve open rates by approximately 14%.

    On the topic discovery side, 93.7% of B2B marketers now use AI in some part of their content operations. The most sophisticated teams have moved past AI drafting to AI-assisted discovery. Topify’s AI Volume Analytics surfaces “dark queries” — high-volume topics being asked in conversational AI platforms like ChatGPT and Perplexity that haven’t yet developed significant competition in traditional SERPs. Getting to these topics early means your content calendar is aligned with where buyer attention is actually moving, not where it was 18 months ago.

    Measuring Content Marketing ROI Without Vanity Metrics

    Page views don’t pay salaries. Yet many content teams still report to leadership using metrics that have no reliable connection to revenue.

    The shift to a strategy-led measurement model starts with “content-influenced pipeline” — joining content consumption data to CRM opportunity data to see which specific assets were touched by accounts that eventually closed. It’s not a trivial build, but it’s the only way to credibly demonstrate that content drives business outcomes.

    The core formula: (Closed-Won Revenue Influenced by Content – Total Content Production Cost) / Total Production Cost × 100

    For 2026, three additional metrics have become essential for brands operating in AI search environments:

    Answer Inclusion Rate (AAIR): What percentage of relevant queries result in an AI-generated answer that cites your brand?

    AI Citation Rate: How often does the AI engine link back to your content as an authoritative source — not just mention your brand?

    Conversion Visibility Rate (CVR): What’s the likelihood that an AI citation leads to a high-intent brand interaction (demo request, signup, direct visit)?

    Topify’s Source Analysis and Visibility Tracking layers are built specifically to surface these metrics across ChatGPT, Perplexity, Gemini, and other major AI platforms. The CVR metric in particular closes the loop between GEO performance and commercial outcomes — making it possible to tie AI-search visibility directly to pipeline, not just impressions.

    B2B companies that invest in advanced tracking achieve an average content ROI of 5:1, with top-performing SEO and thought leadership campaigns reaching returns of 700% or higher.

    One Content Plan for SEO Rankings and AI Search Citations

    The emergence of generative search doesn’t replace traditional SEO. It adds a new layer — and that layer has different rules.

    SEO optimizes for a click. GEO optimizes for a citation. These are meaningfully different goals, and they require different content structures.

    FeatureSEO OptimizationGEO Optimization
    GoalClicks to websiteCitations within AI answer
    Primary SignalBacklinks / KeywordsAuthoritative citations / Original data
    Content StructureLong-form, SEO-friendlyConcise, fact-level, citable sections
    Technical NeedCrawlability / SpeedStructured data (Schema.org) / RAG-friendly

    Research from Princeton and Georgia Tech demonstrates that traditional tactics like keyword density perform poorly in generative environments. AI systems prioritize “extractability” — they need content that is factually dense, clearly structured, and citable at the sentence level.

    Practical adjustments that work for both channels: answer the primary query within the first 200 words (satisfies AI’s opening-content bias), structure headers as exact questions, and include verifiable statistics and expert quotes. These changes have been shown to boost AI visibility by up to 40%. Original data points, specifically, increase AI citation likelihood by approximately 30%.

    Topify’s Visibility Tracking monitors brand performance across both Google SERPs and AI platforms simultaneously, allowing content teams to see their share of voice in real time. When a content calendar is built to satisfy both SEO and GEO requirements from the start, the effort compounds across channels rather than being siloed.

    The brands that will dominate the next search cycle aren’t the ones publishing the most. They’re the ones publishing content that’s authoritative enough to earn both a Google ranking and a ChatGPT citation.

    Conclusion

    The traffic-no-pipeline problem is structural, not tactical. Adding more content to a broken system doesn’t fix the system. What changes outcomes is a genuine content marketing strategy: one that maps to buyer stages, builds topical authority, measures pipeline influence, and now extends into AI search visibility.

    If your content is ranking but not converting, start with a full-funnel audit. Identify where MOFU and BOFU assets are missing. Build the pillar-cluster architecture that earns topical authority over time. And make sure your measurement stack can actually tell you which content is closing deals — not just attracting clicks.

    The tools and frameworks exist. The brands pulling ahead are the ones deploying them systematically.


    FAQ

    Q: How do you build a content marketing strategy from scratch?

    A: Start by defining where your brand has a genuine “right to win” — the niche topics where you have real expertise. Then: (1) Map buyer personas to their specific pain points at each funnel stage; (2) Audit existing assets to identify MOFU and BOFU gaps; (3) Build a pillar-cluster map for 3 to 5 core topics; (4) Set up a content engineering workflow for consistent production; (5) Integrate CRM data to track pipeline influence from the first publish.

    Q: What’s the difference between a content marketing strategy and an editorial strategy?

    A: A content marketing strategy is the high-level system — it aligns content effort with business goals, revenue targets, and the buyer journey. It answers “why” and “how much.” An editorial strategy is a subset: it governs topic prioritization, voice, publishing cadence, and format decisions. Think of the content strategy as the architecture, and the editorial strategy as the floor plan.

    Q: How do you measure content marketing ROI without relying on vanity metrics?

    A: Connect content consumption data to CRM opportunity data. Track content-influenced pipeline (deals that touched specific assets), SQL conversion rate by content type, and Customer Acquisition Cost (CAC) by channel. In AI search environments, also track Answer Inclusion Rate, AI Citation Rate, and Conversion Visibility Rate to capture the full picture of how content drives commercial outcomes.

    Q: How does a blog content strategy support AI search visibility (GEO)?

    A: AI engines prioritize extractable, authoritative, and factually dense content. A blog strategy that uses question-based headers, includes original data points, and structures content for “citable sections” is significantly more likely to be referenced in ChatGPT, Perplexity, and Google AI Overviews. Topical authority also matters: brands that cover a subject comprehensively are recognized as “entity authorities” and become default citations for related queries.


    Read More

  • The SEO Blog Writing Playbook That Works for Google and AI Search

    The SEO Blog Writing Playbook That Works for Google and AI Search

    Most blog posts never get found. Not because they’re poorly written, but because they weren’t built to be discovered.

    Ahrefs data consistently shows that roughly 91% of web content receives zero organic traffic. And with AI Overviews now intercepting top-of-funnel queries, organic click-through rates for informational content have dropped by as much as 58%. Writing a good article is no longer enough. You need to engineer content that both Google and AI engines can retrieve, parse, and cite.

    That’s what this guide covers.


    SEO Blog Writing vs. Regular Blog Writing: The Gap That Costs You Rankings

    Good writing and ranking content are not the same thing.

    Regular blog posts prioritize narrative flow and brand voice. They might build community, earn shares, or express perspective. What they typically don’t do is tell search algorithms and AI models exactly what they’re about.

    SEO blog writing is different in intent. Every structural decision, from heading hierarchy to paragraph length, serves a retrieval function. The goal isn’t just for a human to read the piece. It’s for an automated system to extract the right passage at the right moment.

    The gap shows up most clearly in how each approach handles user intent. Informational queries make up roughly 70% of global search volume. A conversational blog post might address the topic. An SEO-optimized post answers the specific question, in the first paragraph, in plain language, before doing anything else.

    That’s not a stylistic choice. It’s an architectural one.

    In 2026, AI models use what researchers call “retrieval-augmented generation” (RAG) to pull content fragments into their responses. If your post doesn’t front-load its core answer with clean structure, it won’t be extracted. It’ll be skipped, even if the underlying argument is stronger than anything that does get cited.


    Blog Post Structure for SEO: The Framework Behind Ranking Content

    Structure is the first signal. Before Google or an AI model reads a single sentence, the heading hierarchy tells them whether this content is worth parsing.

    Research across 10,000+ queries suggests the optimal heading depth for blog posts sits between three and five levels. Too shallow, and retrieval algorithms can’t find enough organizational cues. Too deep, and crawler attention gets diluted across too many structural tokens.

    Here’s what that looks like in practice:

    H1 (Title): Under 60 characters, contains the core keyword, solves a specific problem. Not “A Guide to SEO Writing” but “The SEO Blog Writing Playbook That Works for Google and AI Search.”

    Introduction: Provide a direct answer to the central query within the first 40 to 60 words. This satisfies Google’s NavBoost signals and the prompt-completion requirements of AI models simultaneously.

    H2 subheadings: Phrase these as questions or intent-anchored statements, not topic labels. “How to Structure a Blog Post for SEO” outperforms “Blog Structure” every time.

    Paragraph rhythm: Two to three sentences per paragraph is the baseline. This isn’t just for readability. It’s because AI agents index content at the passage level, and a bloated paragraph often returns a diluted extraction.

    The “modular block” principle applies here: each paragraph should be contextually complete on its own. If an AI engine pulls a single paragraph from a 2,500-word article, that paragraph should still make sense and deliver value. If it can’t stand alone, it probably won’t get cited.


    On-Page SEO for Blogs: What Actually Moves the Needle in 2026

    The old hierarchy of on-page SEO factors has been reshuffled significantly since Google’s August 2025 Core Update.

    Keyword density is now a liability, not an asset. Google’s SpamBrain systems can flag over-optimized content for demotion. What replaced it is entity coverage: does your content mention, define, and connect the concepts that belong in this topic’s semantic neighborhood?

    The highest-weight on-page factors in 2026 look like this:

    Factor2026 Ranking WeightImpact on AI Citations
    Schema Markup (JSON-LD)HighEssential for extraction accuracy in AIO and Perplexity
    Mobile Core Web VitalsHighPrerequisite for Google Discover inclusion
    Internal Linking (Clusters)HighEstablishes topical authority and entity relationships
    Image Alt TextMediumCritical for multimodal retrieval
    Keyword DensityLow / NegativeCan trigger spam demotions if overused

    Schema markup deserves specific attention. Connecting your Article, Person (author), and Organization schema nodes with stable @id identifiers creates a machine-readable knowledge graph. AI systems use this to verify E-E-A-T before deciding whether to cite your content. Without it, you’re asking the model to trust a source it can’t verify.

    Featured snippets remain valuable, but the dynamic has changed. When an AI Overview is present on a search results page, the top organic result’s CTR drops by roughly half. The upside: content cited inside the AI Overview earns 35% more clicks than non-cited competitors on the same page. Winning the citation is the new winning the top spot.

    To earn those citations, use direct answer formatting: state the question explicitly as a subheading, then answer it in one to two clean sentences immediately below. That’s the exact format AI agents are trained to extract.


    How to Use Keywords Naturally in SEO Blog Writing

    Keyword stuffing is dead. But keyword avoidance isn’t the answer either.

    The shift is from frequency to semantic coverage. Research on long-tail keyword distribution shows that nearly 74% of keywords receive fewer than 10 searches per month. The bulk of valuable traffic lives in conversational, intent-specific queries, not high-volume head terms.

    That changes the writing strategy.

    Instead of repeating a target keyword five times per 500 words, the goal is to cover the topic’s full semantic neighborhood. A post about “sustainable investment” that never mentions ESG criteria, carbon disclosure, or green bonds signals topical thinness to both Google and AI models. They expect related concepts to appear naturally in expert-level content.

    Three techniques for natural keyword integration:

    1. Term definition at first use. Define complex or technical terms when they first appear. This aids AI comprehension and signals genuine expertise.

    2. Entity linking. Link to authoritative external sources (academic institutions, government sites, established publications) at relevant points. Research cited by Princeton University found that this type of authoritative citation increases generative search visibility by over 30%.

    3. Cross-query coverage. AI engines often break down complex user queries into multiple sub-queries before synthesizing a response. If your article answers the main question and several adjacent ones, it’s more likely to be selected for synthesis. One post, multiple related questions, clean structural separation between them.

    What you’re not doing: mentioning the primary keyword in every other paragraph, forcing LSI terms into sentences that don’t need them, or writing for a keyword density percentage instead of a reader.


    Writing Blog Posts That Rank on Google and AI Search Simultaneously

    This is where most content strategies still have a blind spot.

    Traditional SEO optimizes for PageRank logic: backlinks, domain authority, crawlability. AI search visibility runs on different logic: answer inclusion rate, citation frequency, and content freshness. The mistake is assuming these are the same problem with the same solution.

    They’re not. But they’re not incompatible either.

    Analysis of 6.8 million AI citations shows that different platforms have distinct sourcing preferences. Google’s AI Overviews favor brand-owned content, LinkedIn, and structured web pages. ChatGPT gravitates toward Wikipedia, Reddit, and major news outlets. Perplexity prioritizes niche expertise: G2, Gartner, industry blogs.

    That has direct implications for content strategy:

    AI PlatformMost Cited Source Types
    Google Gemini (AIO)Brand websites, LinkedIn, Quora, Reddit, YouTube
    ChatGPT (OpenAI)Wikipedia, Reddit, Forbes, Business Insider
    PerplexityG2, Gartner, PCMag, Industry Blogs

    A blog post optimized purely for Google domain authority won’t automatically earn Perplexity citations. And vice versa. The hedge is content that satisfies cross-platform trust signals: original data, expert attribution, authoritative external links, and structured formatting.

    Content freshness is a compounding factor. Research shows 65% of AI citations occur on content updated within the last 12 months. A post written in 2023 and never touched is losing citation ground every month, even if it still ranks in Google’s top ten. Build a refresh cycle into your editorial calendar.

    One more thing worth knowing: most AI crawlers, including OAI-SearchBot and PerplexityBot, can’t execute JavaScript. If your blog runs on client-side rendering, these crawlers may never see your content at all. Server-side rendering isn’t optional for AI visibility.


    The SEO Blog Writing Checklist: From Draft to Published (and Beyond)

    The process doesn’t end at publish. That’s the outdated model.

    Before you write:

    • Map search intent: what specific answer does the searcher want, and how do they want it structured?
    • Audit your brand’s current share of model: is your site already being cited for related topics by ChatGPT or Gemini?
    • Identify which sources AI engines currently cite for your target keyword. Competitors? Wikipedia? Niche blogs? That tells you what you’re actually competing against.

    While you write:

    • Front-load the direct answer in the H1 and the first H2
    • Include at least 5 to 10 specific data points per major article
    • Add 2 expert quotes with clear attribution
    • Implement JSON-LD schema connecting Article, Author, and Organization nodes
    • Keep paragraphs to 2 to 3 sentences; no paragraph should require more than one reading to parse

    After you publish:

    • Link the new post from 3 to 5 high-authority internal pages immediately
    • Check server logs for OAI-SearchBot and PerplexityBot to confirm crawler access
    • Move beyond rank tracking: measure citation frequency across LLMs, not just Google position
    • Schedule a 6-month content refresh to maintain citation eligibility

    The last point matters more than most teams realize. Organic rankings can hold steady while AI citation rates erode quietly. You need different metrics to catch that.


    How Topify Turns SEO Blog Writing into a Measurable Growth Channel

    Writing the content is one side of the equation. Knowing whether it’s actually being found by AI is the other.

    That’s the gap most brands still operate in the dark on.

    Topify is built to close it. The platform tracks brand visibility across ChatGPT, Gemini, Perplexity, and other major AI engines using seven core metrics: visibility, sentiment, position, volume, mentions, intent, and CVR (Conversion Visibility Rate). Instead of guessing whether a blog post is earning AI citations, you can see it directly.

    Two features are especially relevant for content teams:

    Source Analysis shows which third-party domains AI platforms are currently citing in responses related to your target topics. That’s the competitive intelligence most content strategies are missing. You can see whether AI is citing a competitor’s white paper, a Reddit thread, or a niche industry blog, and then adjust your content to become the stronger source. It’s not guesswork. It’s reverse-engineering the citation graph.

    Visibility Tracking quantifies how a published post performs across AI platforms over time. If a piece earns strong Google rankings but low AI citation rates, that’s a specific signal: the content may need structural adjustments, fresher data, or additional schema implementation.

    For teams that want to outsource the production side, Topify’s content writing service delivers GEO-native articles built to rank on both Google and AI search from day one. The Basic plan at $3,999/month includes 60 high-quality articles. The Business plan at $4,999/month adds Source Analysis, dark query discovery, and multi-engine visibility tracking alongside 60 articles per month.

    The team behind the platform includes a Google White-Hat SEO champion with 10-plus years of experience scaling sites to 1M+ organic visitors, an LLM researcher from Stanford with publications at NeurIPS, AAAI, and ICLR, and a growth operator who has scaled over 100 companies from zero to $20M in revenue. The methodology isn’t theoretical.


    Conclusion

    SEO blog writing in 2026 is a two-front discipline. You’re writing for Google’s entity graphs and for AI engines’ synthesis logic at the same time. The structural requirements overlap significantly, but the measurement frameworks don’t.

    The fundamentals haven’t changed: answer the question clearly, support claims with data, build topical authority through internal linking, and keep technical hygiene tight. What has changed is the visibility layer. Ranking in Google’s top ten no longer means your content is actually reaching users in the AI search era.

    Track citation frequency, not just position. Refresh content on a defined cycle. And audit which sources AI platforms currently cite for your target topics before you write, not after.

    That’s the gap between content that exists and content that gets found.


    FAQ

    How to write a blog post that ranks on Google in 2026?

    Prioritize information gain and E-E-A-T. Google’s current systems reward original research, first-hand expertise, and fast-loading mobile pages. Use semantic clusters and clear heading hierarchies rather than keyword repetition. The key signal is whether your content adds something that doesn’t already exist at the top of the results page.

    What’s the difference between SEO blog writing and regular blog writing?

    Regular blog writing focuses on narrative and voice without technical structure. SEO blog writing is engineered for retrieval: structured data via Schema markup, intent-mapped headers, semantic LSI coverage, and direct-answer formatting in the introduction. The intent is for the content to be parsed and cited by automated systems, not just read by humans.

    How to write blog posts that rank in AI search results?

    Lead with a direct answer in the first 40 to 60 words. Include 5 to 10 specific data points and at least 2 expert quotes with attribution. Use tables and lists that AI agents can extract easily. Implement connected JSON-LD schema and link to authoritative external sources. Content freshness is also a major factor: 65% of AI citations go to content updated within the last 12 months.

    How to measure the SEO performance of your blog posts?

    Traditional traffic metrics are increasingly insufficient. Add Answer Inclusion Rate (AAIR), AI Share of Voice, and citation frequency to your measurement stack. Platforms like Topify’s Visibility Tracking can show how often and in what context your content is cited across ChatGPT, Perplexity, and Google AI Overviews.

    How to write blog introductions that improve SEO?

    Use the inverted pyramid: provide a direct answer to the query within the first two sentences. Don’t warm up with context or statistics. The first sentence should tell the reader (and the AI crawler) exactly what this post is about and why it matters. Save the supporting detail for the body.


    Read More