Blog

  • How to Use G2 to Pick the Right AEO Tool

    How to Use G2 to Pick the Right AEO Tool

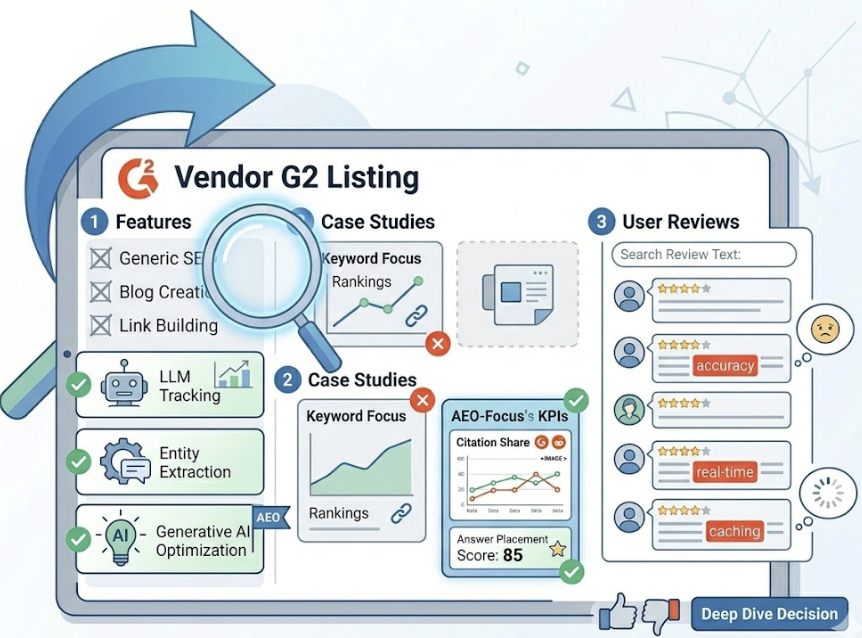
    G2’s Answer Engine Optimization category didn’t exist before March 2025. Since then, it’s grown by 2,000%. That’s not a trend. That’s a category being invented in real time.

    The problem is that a category growing that fast attracts two kinds of tools: ones that genuinely track how AI engines recommend brands, and ones that repackaged their SEO dashboards and added “AI” to the tagline. G2’s listing criteria filter out the obvious fakes. But they don’t tell you which of the remaining tools actually fits your team.

    That’s what this framework is for. Four steps, starting with the filter most buyers skip entirely.

    G2 Won’t List an AEO Tool Unless It Does These 4 Things

    Before anything else, it helps to understand what G2 actually checks before approving a product for the AEO category. These aren’t optional features. They’re the entry requirements.

    AI Visibility Tracking monitors where and how often your brand appears in AI-generated responses across LLMs and AI search engines. This isn’t rank tracking. It’s about capturing probabilistic, non-linear outputs, and distinguishing between a “mention” (your name appears in a narrative) and a “citation” (the AI attributes a source or links to your domain). Citations are what actually drive referral traffic.

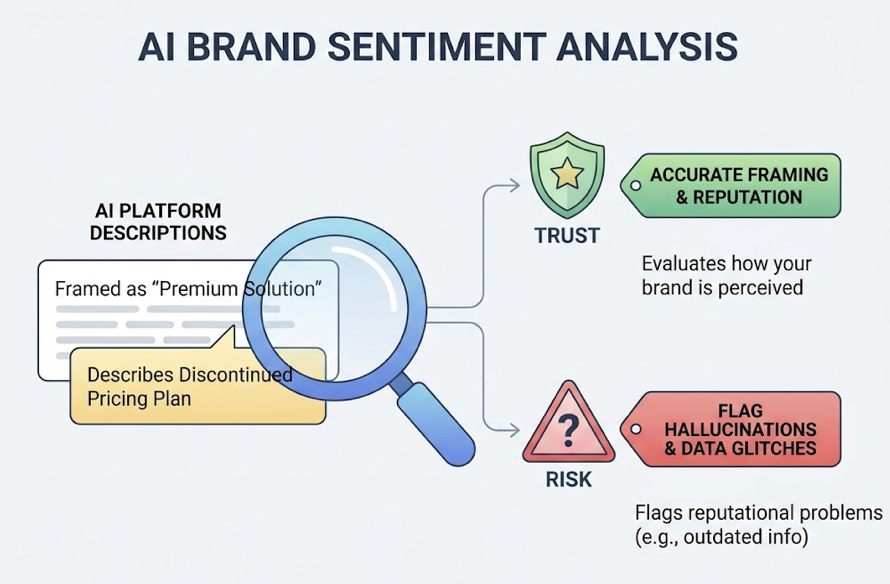
    AI Brand Sentiment Analysis evaluates how AI platforms describe your brand. Whether you’re being framed as a “premium solution” or a “budget alternative” matters, especially in finance and healthcare where trust is part of the product. This feature also flags hallucinations: an AI confidently describing a pricing plan you discontinued two years ago is a reputation problem, not just a data glitch.
    LLM Ranking Insights explain why an AI chose to cite one brand over another. This moves the focus from keywords to conversational intents, which research shows are phrased differently than Google searches in over 80% of cases. These insights help teams find “answer gaps”: questions where competitors are winning recommendations and you’re invisible.

    Competitor Benchmarking puts your share of voice in context. In AI answers, a single synthesized response can replace a full page of search results. Knowing your relative position across ChatGPT, Perplexity, and Gemini is the strategic baseline for any media or content budget decision.

    All four are table stakes. The question is how deep each tool goes on each one.

    CapabilityPractical ApplicationWhat to Verify in the Trial
    AI Visibility TrackingYour SaaS isn’t appearing in “best CRM” lists in PerplexityMention vs. citation distinction
    AI Brand Sentiment AnalysisGemini is describing a pricing plan you no longer offerSentiment polarity + hallucination flagging
    LLM Ranking InsightsChatGPT prioritizes your docs over your marketing blogAnswer gap identification
    Competitor BenchmarkingYou own 45% of mentions in your category in GPT-4oSource-level citation tracing

    Stop Looking at Star Ratings Until You’ve Done This First

    Most buyers open G2, sort by rating, and start reading reviews. That’s backwards.

    A 4.7-star rating from 200 enterprise users tells you almost nothing if you’re a 12-person marketing team. The aggregate score blends feedback from teams with completely different workflows, budgets, and technical expectations.

    G2’s segment filters exist for exactly this reason. Use them before you touch the star ratings.

    Small Business (under 50 employees) typically means no dedicated AEO staff and limited time for setup. The right G2 filter here isn’t “Most Popular.” It’s the Ease of Setup and Ease of Use scores within the Small Business segment. A tool that takes three weeks to configure properly isn’t a tool for a five-person team, regardless of how good its enterprise benchmarking is.

    Mid-Market (51 to 1,000 employees) companies are in the scaling middle: formal teams, multi-regional operations, and a need for integrations with existing SEO or CRM stacks. For this segment, the G2 Relationship Index is the most predictive metric. It measures support quality and ease of doing business with the vendor. Mid-market teams don’t have the procurement muscle to escalate support tickets the way enterprises do. Vendor responsiveness matters more than it appears in a feature list.

    Enterprise (1,001+ employees) procurement runs on compliance. SOC 2 Type II, SSO support, and the ability to process tens of thousands of prompts across global markets aren’t nice-to-haves. They’re blockers. G2’s Enterprise Business category filter requires a minimum of 10 reviews from enterprise-level users before a product qualifies, which is a meaningful signal of genuine adoption at scale.

    SegmentWhat to Filter ByDeal-Breaker Requirement
    Small BusinessEase of Setup scoreNo-code onboarding, fast “aha” moment
    Mid-MarketRelationship IndexFlexible seats, reliable support SLA
    EnterpriseImplementation IndexSOC 2 Type II, SSO, high prompt volume

    The Pricing Trap That Catches Most Buyers Mid-Budget

    The base subscription price is the least useful number in an AEO tool evaluation.

    Here’s why. Traditional SEO platforms typically charge per user. AEO-native tools charge per tracked prompt or per AI answer analysis. These are fundamentally different cost structures, and mixing them up leads to budget surprises.

    Per-user models are predictable, but they scale poorly when four departments need access: marketing, PR, content, and product. Shared logins become a security risk. Per-prompt models are better aligned with actual value, but a team tracking 50 prompts across six AI engines is effectively tracking 300 prompts, since some tools bill per engine, not per query.

    Don’t guess. Read the G2 reviews with these three cost signals in mind.

    Credit multiplication: Does the tool charge once per prompt or once per engine per prompt? This is rarely stated clearly in pricing pages but comes up constantly in mid-tier reviews.

    Add-on gating: Sentiment analysis and Gemini coverage are frequently locked behind higher tiers. A tool that looks affordable at the Basic plan can double in price once you add the capabilities you actually need.

    Data latency costs: A tool refreshing data weekly might seem like a budget win. It isn’t. If AI is hallucinating incorrect information about your brand for seven days before you find out, that’s a reputation cost that doesn’t appear on an invoice.

    For teams under $100/month, entry-level plans from smaller players can work if the use case is narrow. At the $100 to $500/month range, the tradeoff is between multi-engine coverage depth and execution features. Topify’s Basic plan sits in this range at $99/month with ChatGPT, Perplexity, and AI Overviews tracking included, plus 9,000 AI answer analyses per month, which is more than sufficient for most growing marketing teams.

    Not Every Team Needs All Four Capabilities in Year One

    Buying a tool with four core capabilities doesn’t mean your team will use all four effectively. Implementation complexity and team bandwidth matter.

    AI Visibility Tracking has the lowest implementation complexity and the highest immediate ROI. It’s the right starting point for any brand that doesn’t yet have a baseline understanding of where they appear in AI recommendations. SaaS and e-commerce teams benefit most, particularly for “Best [category] for [persona]” queries, which research shows are the most influential for B2B shortlisting decisions.
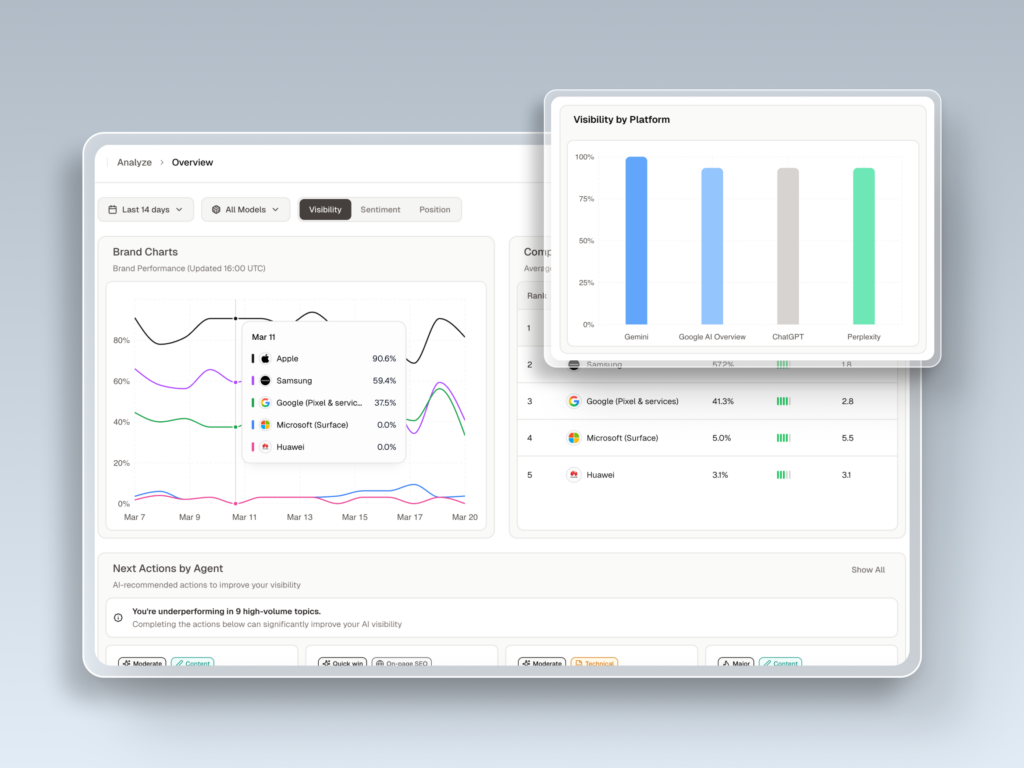
    Brand Sentiment Analysis becomes worth the effort when reputation management is an active priority: post-launch, post-crisis, or in regulated industries. If you’re not actively monitoring and correcting AI narratives about your brand, you’re essentially outsourcing your brand positioning to a probabilistic model.

    LLM Ranking Insights are powerful and expensive to act on. The data tells you why an AI prefers a competitor’s content. Acting on it means rewriting content, updating schema, and restructuring documentation. If your team doesn’t have the bandwidth to execute on 20 content changes a month, prioritize tools that offer built-in content generation or automated schema deployment rather than raw ranking data alone.

    Competitor Benchmarking is where the “surface feature trap” is most common. A share-of-voice chart looks convincing in a slide deck. The feature that actually creates strategic value is the ability to trace which specific URLs a competitor is being cited from. Which third-party review sites, Reddit threads, or documentation pages is the AI treating as authoritative sources for them? That’s the intelligence that informs a real content gap strategy.

    CapabilityBest Use CaseComplexityTime to Value
    AI Visibility TrackingEstablishing a baselineLowDays
    Brand SentimentReputation managementMedium1-2 weeks
    LLM Ranking InsightsContent optimizationHigh1-3 months
    Competitor BenchmarkingStrategic planningMedium2-4 weeks

    A 4.8-Star Rating Can’t Tell You If a Tool Tracks DeepSeek

    G2 ratings are lagging indicators. They reflect how a tool performed for users who left reviews, which may have been six months ago, before the latest round of LLM updates.

    That’s not a criticism of G2. It’s a structural limitation of review platforms. The only way to verify current performance is a structured trial with a clear evaluation plan.

    Here’s a 7-day framework that works.

    Day 1: Manually run 10 high-intent prompts through ChatGPT, Perplexity, and Gemini. Record which domains are cited and what the sentiment is. This is your independent baseline.

    Day 2: Onboard the tool and input the same 10 prompts. Compare its reported data against your Day 1 manual findings. Gaps here are your first signal of data reliability.

    Day 3: Change a meta description or schema tag on a key page. Check how long it takes for the tool to detect and reflect that change. Weekly refresh cycles are a problem in a market where AI model updates can shift citation landscapes in 48 hours.

    Day 4: Use the benchmarking feature to identify a specific source a competitor is being cited from. Verify independently that the source exists and that the tool’s reasoning makes sense.

    Day 5: Run prompts with known negative associations or common hallucination triggers in your industry. Test whether sentiment flagging catches them.

    Day 6: Test the API or data export. Ask support a specific technical question about their data retrieval methodology, specifically whether they use live browser rendering or API snapshots. Browser-rendered tools almost always provide more accurate real-world data.

    Day 7: Build a mini-ROI case. If the trial uncovered three actionable answer gaps, estimate the lead value of closing them. That calculation is what gets budget approved.

    Topify’s free trial is designed for exactly this kind of evaluation. The Basic plan includes up to 9,000 AI answer analyses per month, which gives enough data volume to run meaningful comparisons rather than relying on a sample size of 50 prompts. The 7-metric framework it tracks, covering Visibility, Sentiment, Position, Volume, Mentions, Intent, and CVR (Conversion Visibility Rate), is worth mapping directly to your Day 1 manual audit. The CVR metric in particular connects AI visibility to downstream conversion probability, which is the number most marketing managers need to justify the spend to a CFO.

    Use the trial to cross-verify whatever G2 shortlist you’ve built. If a tool’s reported data consistently diverges from your manual spot checks, that divergence will scale.

    What G2 Reviews Miss (And Where to Find It Anyway)

    G2 reviews are excellent for gauging support quality and user satisfaction. They’re not reliable for surfacing technical architecture gaps. Three blind spots come up repeatedly in AEO tool evaluations.

    New platform support: 47% of AI search users switch between two or more platforms regularly. A tool that covers ChatGPT well but only does shallow polling on DeepSeek or Grok isn’t a complete picture. The hidden signal in reviews: look for mentions of “reasoning traces” or “chain-of-thought analysis.” That language indicates the tool can actually see the selection logic newer models use, not just the output.

    Data refresh frequency: A clean dashboard can hide a stale dataset. If a tool relies on static API caches rather than live browser rendering, you might be looking at citation data that shifted 24 hours ago. Search reviews for the words “latency,” “refresh,” “missed,” or “delayed.” If users mention that manual checks showed different results, that’s a refresh problem, not a UI problem.

    Actionability depth: The most common post-purchase regret in AEO is discovering that a tool functions as an intelligence center but doesn’t connect to execution. Five-star reviews often praise dashboard clarity. A year later, teams abandon the tool because it doesn’t integrate with their CMS. Look for reviews that mention “one-click execution” or “agentic workflows” as signals that the tool can deploy changes, not just report them.

    These three gaps won’t appear in a vendor’s feature page. They show up in six-month-old reviews from users who’ve hit them.

    Conclusion

    G2’s AEO category is a useful filter, not a buying decision. It tells you which tools have met a minimum capability bar. It doesn’t tell you which one fits a team of 8 versus a team of 800, or which pricing model won’t surprise you in month three.

    The framework here does the work G2 can’t: segment first, then pricing structure, then capability matching, then trial verification. That sequence eliminates tools before you spend time reading reviews that aren’t relevant to your situation.

    The trial is the final step, not an afterthought. Run it with a structured plan, use Topify to cross-verify your shortlist against real AI answer data, and build the ROI case before the trial ends. That’s how you go from a G2 shortlist to a procurement decision you can defend.

    FAQ

    Q: Is “AEO tool” and “GEO tool” the same thing on G2?

    Largely yes. G2 uses “AEO” (Answer Engine Optimization) as the official category label, but many vendors use “GEO” (Generative Engine Optimization) interchangeably. The practical distinction: AEO traditionally focused on featured snippets and voice assistants, while GEO focuses on generative outputs from ChatGPT, Perplexity, and similar platforms. On G2, they live in the same category.

    Q: How often does G2 update the AEO category rankings?

    G2 publishes major Grid Reports quarterly (Winter, Spring, Summer, Fall). However, the real-time G2 Score and Popularity metrics on category pages are updated daily as new reviews and market presence data come in.

    Q: Can a small team (under 10 people) realistically use an AEO tool?

    Yes, and small teams often get a better proportional return. They can’t compete with enterprise backlink budgets, but AEO provides visibility through structured, high-intent content, which doesn’t require headcount to scale. The key is prioritizing tools with fast setup times and high-intent prompt tracking rather than full enterprise reporting suites.

    Q: What’s the fastest way to compare two shortlisted tools?

    Ask both vendors directly about their data retrieval methodology: live browser rendering versus API snapshots. Beyond that, the G2 side-by-side comparison tool is useful, but the real test is running both trials simultaneously against the same 10 prompts and comparing the outputs against your own manual checks.
    Read More

  • G2 AEO Tool Report 2026: What 248 Tools Reveal

    G2 AEO Tool Report 2026: What 248 Tools Reveal

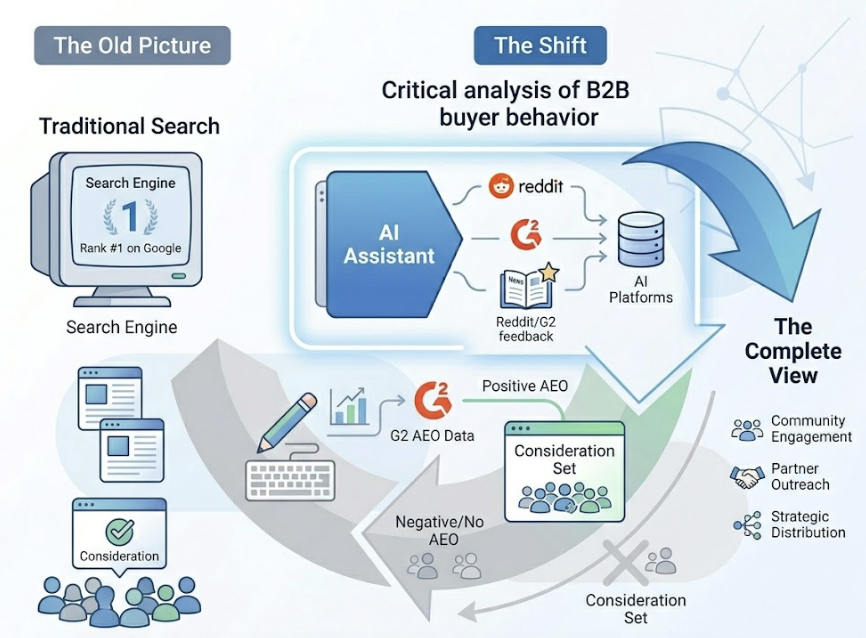
    Half of all B2B software buyers no longer start their research on Google.

    According to a March 2026 survey of 1,076 B2B software decision-makers, 51% now initiate vendor research inside an AI chatbot — up from 29% just eleven months prior. That’s not a slow drift. That’s a structural break.

    G2 recognized this shift early. In March 2025, it formalized Answer Engine Optimization (AEO) as an official software category. Fourteen months later, 248 tools are competing inside it. This report breaks down what that ecosystem actually looks like, why buyer behavior has shifted so decisively, and what it means for how you should be thinking about AI search visibility in 2026.

    51% Didn’t Start on Google. Here’s What That Actually Means.

    The number is striking enough on its own. But the underlying driver is what makes this a durable change, not a novelty effect.

    Fifty-three percent of buyers say that research conducted via AI is significantly more productive than traditional search, up from 36% seven months ago. When a behavior shift is driven by productivity gains, it tends to stick. Buyers aren’t using ChatGPT because it’s new. They’re using it because it saves time.

    The downstream consequence is a “zero-click” reality. Research indicates zero-click searches now account for nearly 60% of all queries, and as high as 93% in Google’s AI Mode. A buyer asks ChatGPT which CRM to evaluate. ChatGPT names three vendors. The buyer never visits a search engine. That exchange happens entirely outside your organic SEO reach.

    There’s also a shortlist disruption happening that most marketing teams haven’t fully priced in. Sixty-nine percent of buyers indicated they chose a different software vendor than initially planned based on AI guidance. One-third purchased from a vendor they were previously unfamiliar with. Brand moats built on name recognition are weakening. Technical relevance and peer-validated authority are replacing them.

    G2’s AEO Category Has 248 Tools. Most Teams Are Using the Wrong Layer.

    The rapid expansion of G2’s AEO category — over 2,000% demand growth since launch — has created a market that looks more crowded than it is confusing. The 248 tools aren’t really competing with each other across the board. They occupy four distinct functional layers.

    Layer 1: Brand Mention and Share of Voice Monitoring. These are entry-level tools that track how often a brand name appears in AI-generated answers across a predefined prompt set. They’re useful for establishing a visibility baseline. They’re not useful for understanding why your brand appears or how to improve it.

    Layer 2: Citation and URL-Level Analysis. This is where operational-grade AEO work happens. These tools move beyond mentions to identify the specific URLs and domains the AI is actually citing. A mention builds recall. A citation builds authority. Knowing which competitor pages are being cited — and why — is what allows teams to close citation gaps with targeted content.

    Layer 3: Multilingual and Global AI Search Visibility. As DeepSeek, Qwen, and Doubao gain market share in non-Western markets, Layer 3 tools track brand presence across AI ecosystems in different languages and regions. For global brands, this layer isn’t optional.

    Layer 4: Enterprise Risk and Hallucination Detection. The most advanced layer monitors for AI “hallucinations” — cases where a model makes inaccurate or fabricated claims about a brand. In a world where 64% of buyers encounter inaccurate AI recommendations often, Layer 4 tools are increasingly critical for regulated industries like healthcare and finance.

    Most B2B SaaS teams should be focused on Layer 2 first. The gap between “we appear in some AI answers” and “we appear in the right AI answers for the right reasons” lives in citation-level data.

    Why 74% of B2B Buyers Default to ChatGPT

    ChatGPT’s dominance in B2B research isn’t just about market share. It’s about how the model communicates.

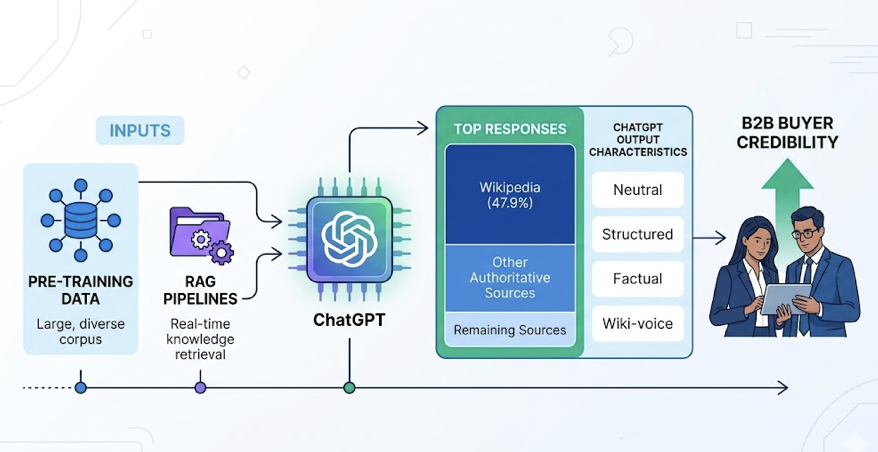
    ChatGPT now reaches over 800 million weekly active users and accounts for 87.4% of all AI-driven referral traffic. Its retrieval combines pre-training data with RAG pipelines that strongly favor authoritative, “Wiki-voice” content — neutral, structured, and factual. Wikipedia alone appears in 47.9% of its top responses. For B2B buyers, this neutrality reads as credibility.

    The trust signal is measurable. Eighty-five percent of buyers report thinking more highly of a vendor when an AI chatbot mentions them in a recommendation. Eighty-three percent feel more confident in their final purchase decision when AI was part of their research process.

    On the flip side, Perplexity operates differently. It searches the live web by default and provides inline citations for every claim, making it the platform where “statistical freshness” determines visibility. Gemini integrates Google’s Knowledge Graph and YouTube signals, and its 1 million token context window makes it especially powerful for deep research on complex B2B decisions.

    Each platform has a distinct trust architecture. That’s the part most AEO strategies ignore.

    What the G2 Grid Doesn’t Tell You About These 248 Tools

    G2’s standard scoring framework measures ease of use, customer support quality, and market presence. These are useful proxies for software quality in general. They’re less useful for evaluating AEO tools specifically.

    Here’s the thing: G2 doesn’t score whether a tool itself is being cited by AI. That gap matters more than it sounds. An AEO tool that monitors your AI visibility but isn’t authoritative enough to appear in AI recommendations has a credibility problem built into its own use case.

    G2 scores also don’t capture cross-platform coverage depth. A tool that tracks ChatGPT only gives you 87.4% of the AI referral picture — and misses entirely the emerging platforms where early positioning is cheapest. The evaluation dimensions that actually matter for AEO tools are: prompt coverage breadth, citation attribution accuracy, data freshness frequency, and whether there’s an execution layer or just a dashboard.

    That last point separates monitoring tools from optimization tools. The “Actionability Gap” — the difference between a tool that reports your AI visibility and one that helps you improve it — is the most underappreciated dimension in the current G2 AEO grid.

    The 7-Metric Framework Every AEO Team Should Track

    The analysis of 248 tools converges on a framework of seven core metrics for quantifying AI visibility. Traditional SEO KPIs like organic CTR are losing predictive power. These replace them.

    1. AI Visibility Rate. The percentage of tracked prompts where your brand is cited or mentioned. Industry leaders typically sit above 30%, though this benchmark varies by vertical. Healthcare AI Overviews, for example, trigger at 48.7%.

    2. Answer Placement Score. Position matters. A primary recommendation that appears first in a ChatGPT response carries fundamentally different weight than a “you might also consider” mention at the end. APS weights mentions by their narrative position in the AI’s response.

    3. Sentiment Polarity Score. Visibility without positive framing is a liability. NLP-based sentiment analysis tracks whether AI describes your brand in a way that drives conversions — or quietly undercuts them. A brand with high visibility but a sentiment score suggesting “expensive but error-prone” has a citation gap problem, not a content volume problem.

    4. Source Citation Share. Roughly 85% of AI citations come from third-party sources, not brand-owned domains. This metric shows which external sites — Reddit, G2 reviews, industry publications — are serving as the “trust neighborhoods” the AI uses to validate your brand.

    5. Feature Association Coverage. Does the AI associate your brand with the value propositions you actually want to own? If your CRM is only cited in “lowest cost” conversations but never in “enterprise scalability” ones, there’s a misalignment between brand strategy and AI-learned perception.

    6. Prompt Coverage. AEO tracks prompts, not keywords. A prompt averages 23 words vs. 4 for a keyword. Full-funnel prompt coverage means your brand appears across discovery (“What is…”), evaluation (“Best for…”), and comparison (“Brand X vs. Brand Y”) queries.

    7. Conversion Visibility Rate (CVR). Despite low click-through rates overall, traffic arriving from AI platforms converts at 4.4 times the rate of traditional organic users. CVR predicts the probability that an AI response leads to a brand interaction.

    Most teams track one or two of these. The brands pulling ahead in 2026 are tracking all seven.

    The Monitoring Layer Is Where Most B2B Teams Underinvest

    Content optimization tools attract most of the budget. Monitoring tools get treated as optional add-ons. That’s backwards.

    You can publish optimized content all quarter and have no way of knowing whether it changed your AI citation rate, improved your sentiment score, or shifted your answer placement. Without measurement, optimization is guesswork dressed as strategy.

    The monitoring layer also catches something most content tools miss: negative drift. AI models update their training and retrieval patterns continuously. A brand that was positively positioned six months ago may have slipped without any change in content output. Only active monitoring catches that before it costs you pipeline.

    Topify is built around this exact logic. The platform tracks all seven metrics outlined above — visibility, sentiment, position, volume, mentions, intent, and CVR — across ChatGPT, Gemini, Perplexity, DeepSeek, Doubao, and Qwen. The cross-platform coverage is what separates a monitoring strategy from a single-platform snapshot.

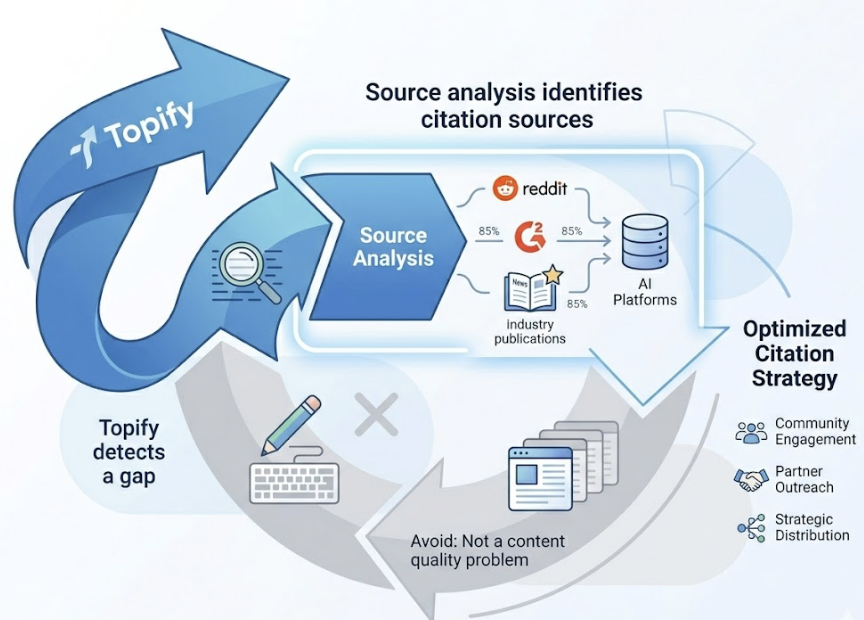
    The Source Analysis feature specifically addresses the 85% third-party citation reality. Rather than guessing which external content is driving AI recommendations, Topify maps the exact domains and URLs the AI is citing, then surfaces gaps where competitors are being cited and you’re not. That’s the data that informs where to publish, not just what to publish.

    How Topify Sits in the G2 AEO Ecosystem

    In the G2 AEO category taxonomy, Topify operates squarely in Layer 2 with selective Layer 3 capabilities. The platform’s technical approach uses browser-based simulation to replicate real user queries, capturing “hidden” citations that API-based tools often miss — a meaningful distinction when citation attribution accuracy determines whether your optimization effort is pointed at the right target.

    The pricing structure aligns with how most mid-market SaaS teams actually buy tools. The Basic plan starts at $99/month and covers 100 prompts and 9,000 AI answer analyses across four projects. The Pro plan at $199/month scales to 250 prompts and 22,500 analyses. For teams that have historically budgeted for SEO tools in the $150-$300/month range, the entry point is comparable. The difference is that AEO monitoring is measuring a channel where 51% of your buyers now start their research.

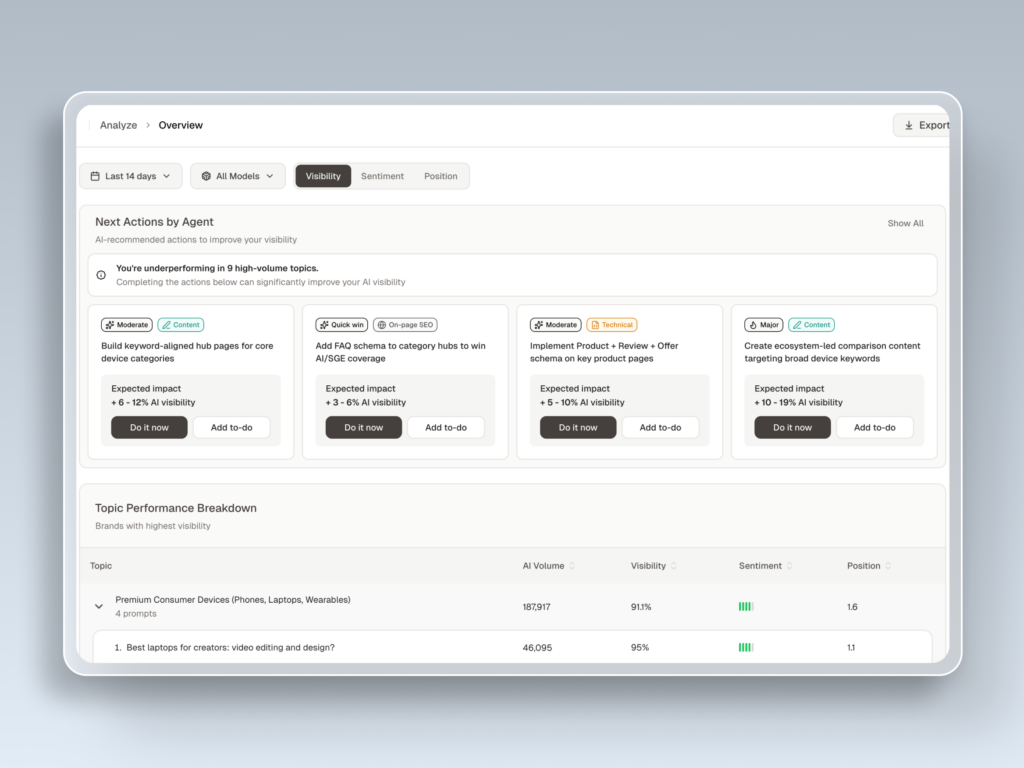
    The “One-Click Agent Execution” layer sets it apart from pure monitoring tools. Once the data identifies a citation gap — say, a competitor is being cited for “AI-native CRM scalability” on three domains you’re not present on — Topify’s agent can propose and deploy a content strategy to close that gap without manual workflow orchestration.

    For agencies managing multiple B2B brands, the multi-project structure matters. Each client’s visibility profile, competitive position, and citation gap analysis sits in a separate project, allowing the same 7-metric framework to be applied consistently across accounts.

    The structural reality the G2 data confirms is this: AI visibility is not a marketing experiment. It’s an infrastructure decision. The brands that treat it that way in 2026 will be harder to displace in 2027 — not because of brand budget, but because citation authority compounds in the same way backlink authority once did.

    Conclusion

    The G2 AEO category didn’t exist eighteen months ago. It now has 248 tools and over 2,000% demand growth because the buyer journey rewired itself faster than most marketing stacks could respond.

    The data is unambiguous: 51% of B2B buyers start in AI, 69% change their shortlist based on AI guidance, and 33% buy from vendors they’d never heard of before an AI mentioned them. Content strategy, SEO investment, and brand spend that don’t account for AI citation behavior are increasingly disconnected from where decisions are actually being made.

    The 7-metric framework isn’t a new dashboard to fill. It’s the measurement infrastructure that makes the rest of your content and brand investment legible in a world where machines are synthesizing your market position before any human reads your website.

    Start with the monitoring layer. Understand which layer of the G2 AEO grid your current tooling covers — and which layers it doesn’t. The gap between what your AI visibility looks like today and what it needs to look like to compete in the Answer Economy is measurable. That’s the first step.

    FAQ

    What is an AEO tool? 

    An AEO (Answer Engine Optimization) tool helps brands track and improve their visibility within AI-generated answers from platforms like ChatGPT, Perplexity, and Gemini. Unlike traditional SEO tools that track keyword rankings on search engine results pages, AEO tools measure citation frequency, sentiment, answer placement, and source attribution in AI responses.

    How is AEO different from SEO? 

    SEO optimizes for search engine ranking pages (SERPs). AEO optimizes for how, where, and whether an AI model cites your brand in its answers. The core distinction is the measurement unit: SEO tracks keyword positions, AEO tracks prompt coverage, citation share, and answer placement across AI platforms. With 51% of B2B buyers now starting research in AI chatbots, both disciplines are necessary — but they require different tools and content strategies.

    What does G2’s AEO category include? 

    G2 formalized the AEO software category in March 2025. It currently indexes 248 tools divided into four functional layers: brand mention monitoring, citation and URL-level analysis, multilingual and global AI search visibility, and enterprise risk and hallucination detection. The category has grown over 2,000% in demand since launch.

    Which AEO tools work best for B2B SaaS brands? 

    Mid-market B2B SaaS teams typically need Layer 2 tools that go beyond basic mention tracking to provide citation-level attribution and content gap analysis. Platforms that track the full 7-metric framework — visibility, sentiment, position, volume, mentions, intent, and CVR — across multiple AI engines are most appropriate for growth-focused teams.

    How do I know if my brand is visible in AI search? 

    Run your 10 most important buying-stage prompts (e.g., “best [category] tools for [use case]”) through ChatGPT, Perplexity, and Gemini manually. Note whether your brand appears, how it’s described, and what sources are cited. That manual baseline is step one. An AEO monitoring platform automates this across hundreds of prompts and surfaces competitive gaps you wouldn’t catch manually.
    123

    Read More

  • G2 AEO Tool Reviews: What High Scores Actually Hide

    G2 AEO Tool Reviews: What High Scores Actually Hide

    You open G2, search “AEO tool,” and see a row of 4.6, 4.7, 4.8 stars. Every vendor looks confident. Every screenshot looks polished.

    Here’s the thing: those scores tell you almost nothing about whether the tool actually works.

    G2’s rating system was built to evaluate SaaS products where “good experience” and “good performance” largely overlap. For AEO tools, they don’t. The metrics that drive high scores on G2 — ease of use, onboarding smoothness, customer support speed — have almost no correlation with the technical capability that matters most: whether the data keeps up with how fast LLMs change.

    This guide will show you how to read G2 AEO tool reviews like someone who’s been burned before.

    Why G2 Scores for AEO Tools Are Structurally Misleading

    G2’s satisfaction score is weighted heavily toward three dimensions: Ease of Use, Meets Requirements, and Quality of Support. All three are subjective experience metrics. None of them measure data freshness, sampling accuracy, or LLM engine coverage.

    A tool can have a customer support team that responds in under two hours, an onboarding flow that takes 15 minutes, and a dashboard that looks like it belongs in a design award portfolio. It can also have data that’s four days stale. On G2, that tool scores 4.7.

    What makes this worse is timing. Most G2 reviews are written within the first 30 to 60 days of use — the “honeymoon period,” when users are still impressed by the interface and haven’t yet tried to act on the data. The reviews that surface a tool’s real technical limits tend to come later, get fewer upvotes, and get buried.

    A high G2 score tells you the onboarding was smooth. It doesn’t tell you if the data is current.

    There’s also a structural advantage for legacy players. G2’s Market Presence score rewards company size, employee count, and social media activity. That means traditional SEO platforms with large sales teams and established brand recognition tend to sit in the “Leader” quadrant, even when their AEO features are bolted-on modules with no dedicated architecture underneath.

    The “Cons” Section Is the Only Part Worth Reading

    Users write marketing copy in the “Pros” section. They write the truth in the “Cons” section.

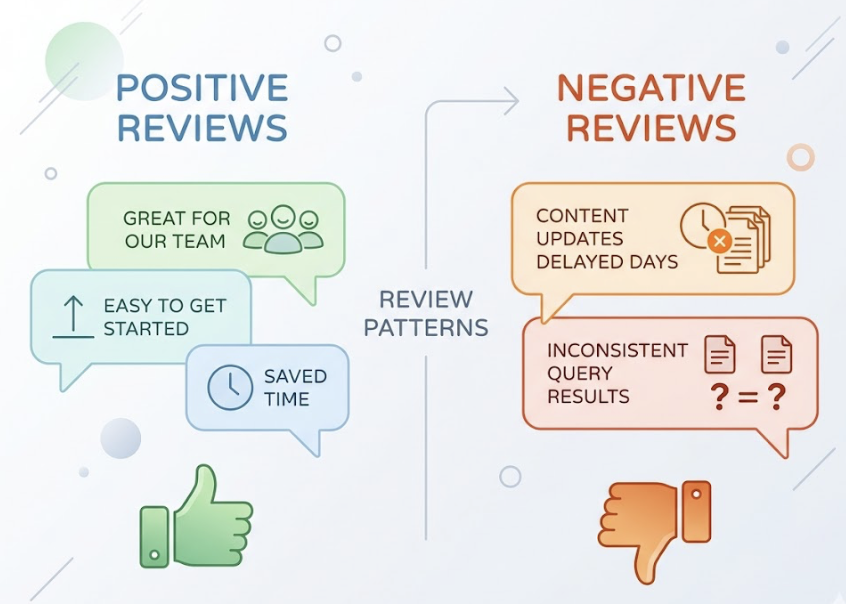
    This isn’t cynicism — it’s a consistent pattern across thousands of software reviews. Positive reviews use phrases like “great for our team” or “easy to get started.” Negative reviews describe specific failures: “took three days to reflect our content update” or “results are completely different when I run the same query twice.”

    Three red-flag phrases appear consistently in G2 AEO tool reviews, and each one points to a specific underlying problem:

    Red FlagWhat It Actually MeansBusiness Risk
    “data delay” / “slow to update”Crawl frequency is lower than LLM RAG update cyclesBrand misses real-time window to correct AI errors
    “complex interface” / “steep learning curve”Product was built for SEO, not AEO workflowsTeams abandon the tool or miss key AEO metrics buried in SEO dashboards
    “results vary” / “accuracy inconsistency”Unstable sampling strategy, no validation for non-deterministic outputsCan’t establish a reliable visibility baseline; market share miscalculation

    When you see these phrases clustered in a tool’s cons section, you’re not looking at minor UX complaints. You’re looking at architectural problems.

    What “Data Delay” Actually Costs You

    In AEO tracking, stale data isn’t just inconvenient.

    It leads to wrong decisions.

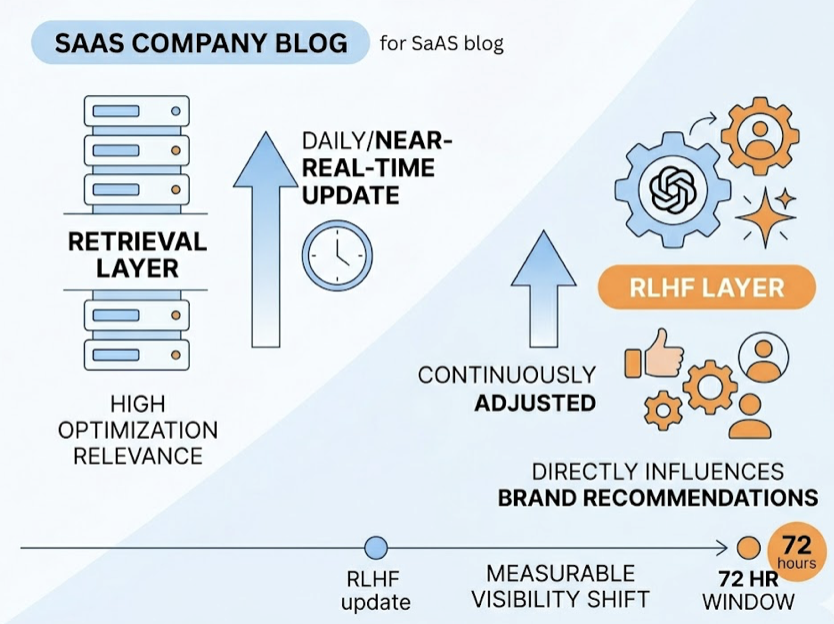
    LLMs don’t update on a weekly schedule. The retrieval layer — the part most relevant to AEO optimization — updates daily or near-real-time. The RLHF layer, which directly influences how often a brand gets recommended, is continuously adjusted. Research indicates that after a single RLHF update to a model like GPT-4 or Gemini, a brand’s visibility can shift measurably within 72 hours.

    If your tracking tool refreshes data once a week, you’re looking at a seven-day lag in a market where the competitive landscape can shift in three. You might spend resources fixing a content problem that the model already resolved — or miss a new citation space a competitor just occupied.

    The worst version of this is what practitioners sometimes call “archaeology data”: tools that rely on static API caches and present week-old snapshots as current performance. It’s a technical shortcut that saves the vendor compute costs and costs you accurate decisions.

    Topify‘s Visibility Tracking uses real-time browser rendering rather than static caches, which means the platform captures actual AI responses as users experience them — not approximations from a database that hasn’t been touched since Tuesday.

    “Interface Complexity” Is Usually a Product Definition Problem

    When G2 reviewers say an AEO tool is “hard to navigate” or “overwhelming,” the common assumption is that it’s a UX issue. Usually it isn’t.

    AEO and SEO are not the same workflow. Traditional SEO tools are designed around keyword rankings and click-through rates — the goal is to move users toward a web page. AEO’s core logic is different: you’re optimizing how AI synthesizes brand information into a generated answer. The success metric isn’t a ranking position. It’s citation influence.

    When an SEO platform adds AEO as a feature module, users end up navigating a system designed for “blue-link search” while trying to find data about “zero-click citations.” The interface feels complex because the underlying architecture was never redesigned for the new task.

    A practical test: search the reviews for phrases like “setup took” or “hard to configure.” If those phrases appear alongside descriptions of manually mapping citation sources or configuring custom crawl rules, the product is offloading its technical limitations onto the user. Good AEO-native tools handle that complexity automatically.

    Topify’s One-Click Execution is an example of the other approach: you define the goal in plain English, the AI agent builds and deploys the strategy. The interface complexity disappears because the system was designed around how AEO workflows actually run.

    How to Read a G2 AEO Tool Review in Under 3 Minutes

    Here’s a practical framework. It filters out about 90% of the noise.

    Step 1 — Go straight to the cons (first 30 seconds). Skip all 5-star reviews. Sort by lowest rating. Look for whether negative reviews cluster around data accuracy or delays, not just feature requests.

    Step 2 — Run three keyword searches (30 seconds). Use Ctrl+F in the review section. Search: delay, accuracy, update. If these terms appear repeatedly in negative reviews, the product has a reliability problem at the infrastructure level.

    Step 3 — Check the review dates (30 seconds). In the AEO space, six months is a long time. A glowing review written before GPT-4o or Gemini 1.5 launched may reflect a tool that no longer functions the same way. Prioritize reviews from the last 90 days for anything related to technical performance.

    Step 4 — Look at reviewer job titles (30 seconds). Operations managers and data analysts write reviews based on what breaks during actual configuration. Marketing coordinators write reviews based on whether the dashboard looks good. The former is more useful.

    Step 5 — Filter for verified purchasers (30 seconds). Unverified reviews are easy to game. Short reviews with high ratings and no specific details should be discounted regardless of score.

    What G2 Reviews Won’t Tell You (And Where to Fill the Gap)

    G2 reviews have a structural blind spot: they can’t capture what users don’t know to ask about.

    Most buyers don’t interrogate a tool’s sampling methodology. They don’t check whether the platform uses distributed browser rendering or a single-IP API call. They don’t ask whether the tool distinguishes between a brand “mention” and a genuine AI “recommendation” — which are meaningfully different signals for optimization decisions.

    Platform coverage depth is another gap. A vendor’s G2 page might list “ChatGPT, Gemini, Perplexity” as supported engines. The fine print, which rarely appears in reviews, is whether those integrations rely on the public API (which gives you a limited, non-representative sample) or actual simulated user queries across regional nodes.

    For Perplexity specifically, BrandMentions offers granular tracking of how brands appear in Perplexity’s real-time search layer, including whether those mentions convert into meaningful referral traffic. That kind of engine-specific depth complements a full-platform tracker and fills the gaps that G2 reviews systematically miss.

    Before committing to any tool, request the technical documentation. Look specifically for answers to: What is the data refresh interval? Is data sourced from real-time browser rendering or static API caches? How many query samples are run per prompt per engine?

    If a vendor can’t answer those questions directly, the G2 score doesn’t matter.

    Topify on G2: What the Real Feedback Shows

    Topify is an AI-native AEO platform built by former OpenAI researchers and Google SEO practitioners. Its G2 feedback reflects the difference in approach.

    Users consistently highlight the platform’s multi-engine coverage — real simultaneous monitoring across ChatGPT, Gemini, Perplexity, DeepSeek, Grok, Doubao, and Qwen — and its ability to distinguish between brand mentions and positive recommendations, which most tools treat as equivalent. Experienced SEO leads note it as one of the few platforms that tracks seven distinct metrics (visibility, sentiment, position, volume, mentions, intent, and CVR) rather than providing a single aggregated score that obscures what’s actually changing.

    The cited accuracy range of 95-98% on citation tracking reflects the platform’s use of real-time browser rendering rather than cached data — which directly addresses the data delay complaints that appear most often in competitor reviews.

    On cost: Topify’s Basic plan starts at $99/month, which is significantly lower than legacy enterprise platforms that charge $499/month or more for slower, less granular data. The value gap is measurable.

    If you want to see how Topify’s G2 reviews hold up against the framework in this article, the Topify G2 Reviews page has the full set of verified user feedback. There’s also a 7-day trial if you’d rather test the data quality yourself before reading anyone else’s opinion.

    Conclusion

    A high G2 score for an AEO tool means the onboarding is clean, the support team is responsive, and the interface made a good first impression.

    It doesn’t mean the data is current. It doesn’t mean the sampling is accurate. It doesn’t mean the platform was designed for AEO rather than retrofitted from SEO.

    The signal is in the cons. The real question is whether the negative reviews cluster around data delay, accuracy inconsistency, or interface complexity — because those three patterns point to the same underlying issue: the tool can’t keep pace with how fast LLMs actually change.

    Read the cons first. Search for the red flags. Check the dates. Then ask the vendor the three technical questions G2 never will.


    FAQ

    What does “AEO tool” mean on G2?

    G2 doesn’t yet have a standalone top-level category for AEO. These tools are typically listed under “SEO Software,” “AI Search,” or “Digital PR Tracking.” When searching, use specific function terms like “citation tracking” or “AI visibility” rather than “AEO” alone to surface the most relevant results.

    How recent do G2 reviews need to be to stay relevant for AEO tools?

    Given how fast LLMs iterate, reviews older than 90 days carry limited technical weight. Six months or more is essentially historical data. A positive review written before a major model update reflects a version of the tool that may no longer behave the same way. For accuracy and data freshness assessments, prioritize the most recent reviews.

    Can I rely on G2 star ratings to compare AEO tools head-to-head?

    No. Star ratings are heavily influenced by subjective experience metrics like customer support and onboarding quality. Two tools can have the same star rating with completely different data architectures. Use the 3-minute review framework in this article and supplement with direct vendor questions about refresh frequency, sampling method, and engine coverage depth.


    Read More

  • What Is an AEO Tool? The No-Jargon Marketer’s Guide

    What Is an AEO Tool? The No-Jargon Marketer’s Guide

    Your keyword rankings are solid. Your domain authority took years to build. Then a potential customer opens ChatGPT, types “what’s the best [your category] tool for my team,” and gets a list of five recommendations. Your brand isn’t on it. And your current analytics have no idea that conversation even happened.

    That’s the gap AEO tools are built to close.

    AEO Isn’t SEO with a New Name

    AEO stands for Answer Engine Optimization. It’s the practice of making sure your brand shows up, gets cited, and gets recommended when AI platforms like ChatGPT, Perplexity, and Gemini answer questions relevant to your category.

    The distinction matters. SEO optimizes for a Google ranking. AEO optimizes for inclusion in an AI-generated answer. Those are two different outcomes, measured on two different platforms, driven by two different signals.

    A brand can hold the #1 position on Google for a high-intent keyword and still be completely absent from the AI response for the exact same query. This isn’t a bug. It’s how generative engines work. Understanding AI search visibility as a separate discipline from traditional rankings is the starting point for everything that follows.

    What an AEO Tool Actually Does

    An AEO tool monitors what happens before a user ever reaches your website. Specifically, it tracks whether your brand appears in AI-generated responses, how you’re described when you do appear, and which sources the AI used to form that answer.

    Most traditional analytics start at the click. AEO tools start earlier.

    Think of it across three layers. First, Visibility: does your brand name show up when AI answers relevant questions? Second, Sentiment: when it does appear, is the framing positive, neutral, or quietly negative? Third, Source Attribution: is the AI pulling from your content, your competitors’ content, or third-party platforms like Reddit and G2?

    AI agents and AEO work together in this framework. The agent retrieves sources, synthesizes them, and delivers a verdict. An AEO tool shows you whether your brand made that shortlist, and if not, why.

    AEO Tool vs. SEO Tool: A Side-by-Side Look

    DimensionSEO ToolAEO Tool
    What it tracksRankings, backlinks, trafficAI mentions, citations, sentiment
    Target platformGoogle, BingChatGPT, Perplexity, Gemini
    OutputKeyword positionBrand visibility in AI answers
    Optimization goalRank higherGet cited more often
    Core metricImpressions, CTRMention rate, Citation rate

    The Numbers That Explain Why Marketers Are Paying Attention

    This isn’t a future trend. It’s already showing up in traffic data.

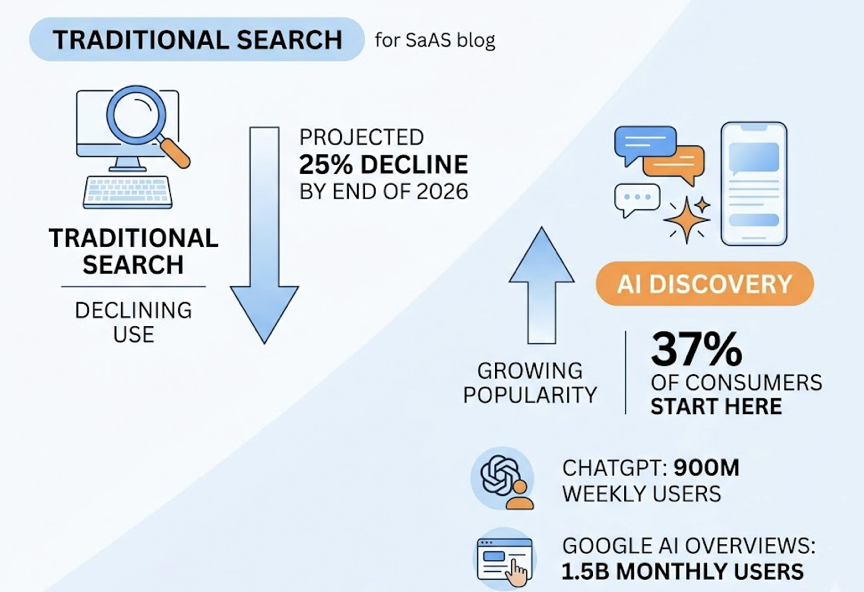
    37% of consumers now start their product discovery journeys with AI tools rather than traditional search engines. ChatGPT has reached 900 million weekly active users. Google AI Overviews reaches 1.5 billion monthly users globally. Traditional search volume is projected to decline by approximately 25% by the end of 2026.

    The conversion numbers make the case even more directly. Visitors referred from AI platforms convert at 4.4x to 5x the rate of standard organic search visitors. In B2B SaaS, AI-referred conversion rates have reached as high as 14.2%.

    That last number deserves its own sentence.

    The explanation is structural. By the time a user asks ChatGPT for a recommendation, the AI has already done the top-of-funnel and mid-funnel research for them. They arrive pre-qualified. The trade-off is that 93% of AI search sessions end without any click to an external website, meaning if you’re not named in the answer, you don’t exist for that user. Forrester data shows B2B marketing teams have already seen 20-30% declines in web traffic tied to AI-native discovery.

    Understanding how AI search marketing works and how to measure it is quickly becoming a baseline expectation, not a niche skill.

    5 Things a Good AEO Tool Should Track

    Not all AEO tools measure the same things. Before evaluating any platform, it helps to know which signals actually matter.

    Mention Rate is the percentage of relevant queries where your brand name appears in the AI’s actual response text. This is the most direct measure of whether AI platforms are recommending you.

    Citation Rate tracks how often your domain is referenced as a source in AI responses, even when the brand name isn’t mentioned in the answer itself. This distinction matters because a tool might cite your content 182 times in a month without ever saying your brand name. That pattern, sometimes called a “ghost citation,” means your data is trusted but your brand hasn’t earned a direct recommendation yet.

    AI Share of Voice compares your mention rate against a defined set of competitors. In a typical AI response, three to six brands are named. You’re either in that group or you’re not. There’s no position eight here.

    Sentiment Score measures how the AI frames your brand when it does mention you. A high score means the AI positions you as a recommended leader. A low one means you’re more likely described as a cautionary alternative. Keyword research built for GEO and AEO can surface the topic clusters where your framing needs work.

    Prompt Coverage identifies which questions your brand shows up for, and equally, which high-volume AI prompts you’re absent from entirely. Research shows that 95% of the sub-queries AI models generate internally have zero recorded search volume in traditional tools like Ahrefs. AEO tools surface these uncontested opportunities before anyone else is optimizing for them.

    What Makes It Harder: The AI Visibility Gap

    Here’s something worth understanding before you start optimizing.

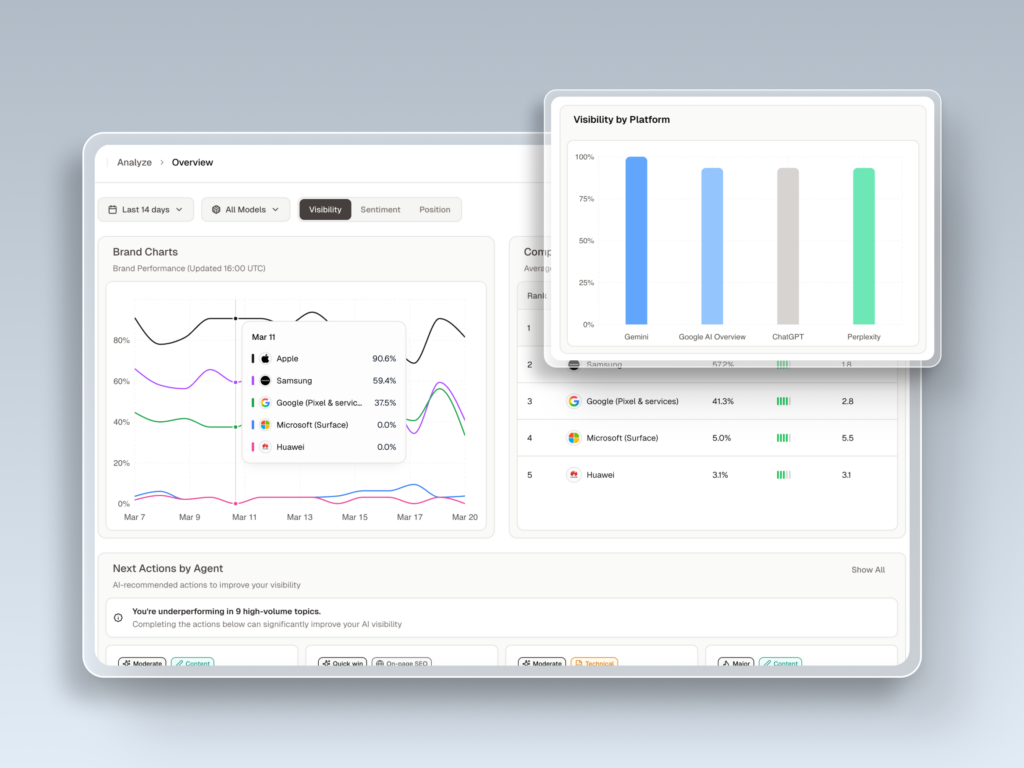
    Different AI platforms don’t agree with each other. There’s less than an 11% overlap in the domains cited by ChatGPT versus Perplexity. Being well-cited on one platform doesn’t transfer to others automatically. Cross-platform tracking isn’t a premium feature. It’s the baseline.

    AI platforms also favor freshness in a specific way. Content updated within the last 90 days is 2.3x more likely to be cited than older material. This isn’t about changing a publication date. It’s about content that reflects current positioning, current product features, and current context.

    The implication is direct: AEO isn’t a one-time audit. It’s a continuous monitoring function.

    Where Topify Fits Into the AEO Picture

    For marketing teams that need to track AEO systematically across multiple platforms, Topify treats AI search visibility as a structured, measurable channel rather than a one-off diagnostic.

    The platform monitors seven metrics across ChatGPT, Gemini, Perplexity, DeepSeek, and other major AI engines: visibility, sentiment, position, volume, mentions, intent, and CVR (Conversion Visibility Rate). Together, these give a marketing team a working picture of how AI systems describe and recommend their brand, not just on one platform, but across the ones their audience actually uses.

    The Source Analysis feature is especially relevant for AEO work. It reverse-engineers which third-party URLs the AI is citing for a given topic, so a content team can identify exactly which domains they need to appear on to earn a citation. That’s a materially different workflow from traditional link-building.

    Topify’s AI Volume Analytics surfaces high-frequency prompts being used on ChatGPT and Perplexity that have no recorded volume in conventional keyword tools. For brands that want to build content targeting the AI’s internal reasoning process, that prompt data is the starting point, not an afterthought.

    The GEO agent layer takes it one step further: rather than just showing you what’s missing, it proposes and can execute optimization strategies with a single click. For teams managing multiple brands or clients, that changes the labor math.

    Trusted by 50+ enterprises and startups, Topify is built for LLM-era visibility from the ground up, not retrofitted from a legacy SEO platform.

    How to Get Started with AEO Optimization

    The entry point doesn’t need to be complex. Here’s a practical framework.

    Start with a baseline audit. Pick your top 15-20 high-intent questions and test them across ChatGPT, Gemini, and Perplexity. Document where you’re mentioned, where you’re cited but not named, and where you’re absent entirely. That three-way breakdown tells you what kind of problem you’re actually solving.

    Identify your real AI competitors. The brands the AI recommends in your category are often not the same ones ranking on Google. This is a consistent finding for brands running their first AEO audit. It changes which content gaps matter most.

    Prioritize by prompt volume. AEO tools with AI Volume Analytics show you which specific questions your audience is asking AI platforms. Start with high-volume prompts where you’re currently absent. That’s where the conversion opportunity is largest.

    From there, content structure matters more than content volume. Research from Princeton found that adding expert quotes to existing content improves AI visibility by 41%, and incorporating specific statistics boosts it by 31-37%. These are repeatable improvements to content you’ve already published.

    Setting up a consistent AI answer monitoring system lets you track whether those updates are actually moving your mention rate, rather than optimizing blind. Update your content at least every 90 days and treat your mention rate the same way you’d treat a keyword ranking: something that shifts, drifts, and requires active management.

    Get started with Topify to run your first cross-platform AEO audit.

    Conclusion

    Your SEO rankings measure how Google sees your content. They say nothing about what ChatGPT, Perplexity, or Gemini recommends when someone asks a question you should be answering.

    AEO tools bridge that gap. They tell you whether you’re in the answer, how you’re described when you are, which sources the AI trusts over yours, and which high-volume prompts you’re completely missing. That’s the diagnostic layer traditional analytics can’t provide.

    As traditional search volume continues its decline and AI-native discovery becomes the default for high-intent research, brands with a clear picture of their AI visibility will have a structural advantage. The ones flying blind on this won’t find out what they’ve missed until the traffic data catches up a year later.


    FAQ

    Q: What does AEO stand for? A: AEO stands for Answer Engine Optimization. It’s the practice of optimizing your brand’s content and entity presence to appear in the synthesized answers generated by AI platforms like ChatGPT, Perplexity, and Gemini, rather than just in traditional search results.

    Q: Is an AEO tool the same as a GEO tool? A: They overlap significantly but aren’t identical. AEO focuses on being included in direct AI answers and zero-click environments like featured snippets and AI Overviews. GEO (Generative Engine Optimization) refers specifically to how LLMs synthesize information and how to ensure your brand is cited as a trusted authority during that generation process. Many platforms, including Topify, cover both layers in a single dashboard.

    Q: Do I need an AEO tool if my SEO is already strong? A: Strong SEO doesn’t automatically translate to AI visibility. A brand can rank #1 on Google for a keyword and be entirely absent from the AI answer for the exact same query. Google prioritizes authority and relevance for rankings. AI engines prioritize structural clarity, entity consistency, and third-party citation patterns. The two systems are separate, and you need visibility into both.

    Q: Which AI platforms should an AEO tool cover? A: At minimum, a useful AEO tool should cover ChatGPT, Google Gemini, and Perplexity, which together account for the majority of consumer AI search behavior in 2026. Regional platforms like DeepSeek matter for brands with international audiences. Given that there’s less than 11% overlap in what ChatGPT and Perplexity cite, single-platform tracking leaves most of the picture invisible.


    Read More

  • G2 AEO Tools Compared: Topify vs Profound vs AirOps vs Otterly

    G2 AEO Tools Compared: Topify vs Profound vs AirOps vs Otterly

    G2 now lists 248 products in the AEO category. That number grew from just 7 tools in early 2025, a jump of over 2,000% in under a year. If you’ve tried to shortlist options on the platform recently, you already know the problem: the category is too crowded to evaluate by browsing.

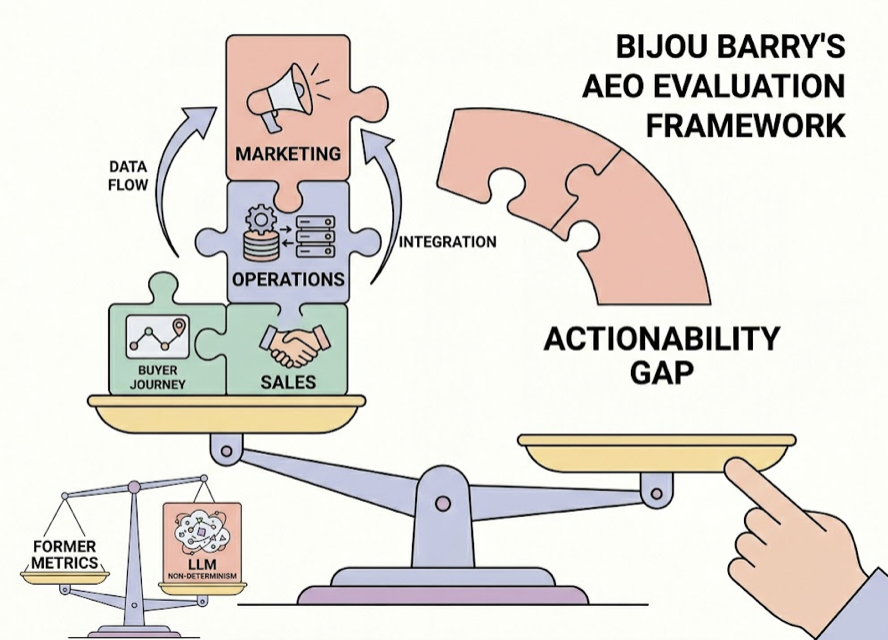
    Here’s the shortcut most buyers miss. G2’s AI Principal Analyst, Bijou Barry, has already mapped out how to evaluate this category. Her framework breaks AEO tools into three buyer dimensions: Marketing (category positioning and content visibility), Operations (integrating AEO data into the AI tool stack), and Sales (understanding how AI influences the buyer discovery journey). The majority of the 248 listed tools cover only one or two of these dimensions, which creates what Barry calls an “actionability gap.”

    This comparison runs four of the most actively reviewed tools through that same framework: Topify, Profound, AirOps, and Otterly.AI. The goal isn’t to declare a winner. It’s to match each tool to the team type it actually serves.

    What G2’s Analyst Framework Actually Measures

    Barry’s three dimensions aren’t about features. They’re about where in your organization the data needs to land.

    The Marketing dimension is about category share. Which prompts trigger your brand? How often does your brand appear versus competitors across ChatGPT, Gemini, and Perplexity? This matters because only 11% of cited domains appear consistently across both ChatGPT and Perplexity for identical queries, meaning fragmented tracking gives you an incomplete picture.

    The Operations dimension is about closing the loop. Seeing that your brand is invisible is one thing. Having a system that moves from that insight to a content fix, without manual re-routing through spreadsheets and Jira tickets, is another entirely.

    The Sales dimension is the least covered. AI models are increasingly acting as pre-sales agents, handling initial feature comparisons before a buyer ever requests a demo. Sales teams need metrics that connect AI recommendations to actual pipeline influence, not just mention counts.

    Most tools do the first dimension reasonably well. Few address all three.

    The 4 Tools at a Glance

    ToolG2 ScorePrimary UsersBarry DimensionsExecution Layer
    Topify5.0Growth teams, marketing agenciesMarketing, Ops, SalesOne-click AI agent
    Profound4.6Fortune 500, regulated industriesMarketing, SalesNone (data export only)
    AirOps4.6Content ops, enterprise teamsMarketing, OpsWorkflow automation
    Otterly.AI4.9SMBs, solo marketersMarketing onlyNone

    Two patterns stand out immediately. Otterly leads on satisfaction score but covers only one dimension. Topify is the only tool that addresses all three while also providing an execution layer.

    Marketing Dimension: Tracking Category Visibility

    This is where all four tools compete most directly.

    Topify tracks brand performance through a 7-metric framework: Visibility, Volume, Position, Sentiment, Mentions, Intent, and CVR. The platform runs this across 10+ AI platforms simultaneously, including ChatGPT, Gemini, Perplexity, DeepSeek, Doubao, and Qwen. Its “Answer Placement Score” weights citations by their narrative position, a brand mentioned as the first recommendation carries more authority than a footnote, and tracks accordingly. Topify also reverse-engineers competitor citations to identify which source URLs AI engines are prioritizing in their responses.

    Profound is the deepest research tool in this group. Its dataset covers over 400 million real user conversations, allowing teams to do high-resolution prompt-level research. It normalizes results across 10+ platforms and provides strong “Share of Voice” and “Citation Share” reporting. The catch is that Profound operates as a pure data output system. Marketing teams typically export insights into separate content management tools, which creates a bottleneck in high-velocity environments.

    Otterly.AI earns its 4.9/5 G2 rating by making the first dimension genuinely easy. At $29/month entry pricing, it monitors brand mentions across ChatGPT, Perplexity, and Google AI Overviews with setup measured in minutes. That said, it monitors the final AI output but doesn’t analyze the underlying retrieval mechanisms that built those answers. You’ll know that you were cited, not why.

    AirOps approaches marketing visibility through content performance. Its “Visibility Score” unifies AI search and SEO performance at the page level, showing which blog posts and landing pages are being picked up as citation sources. It’s less built for competitive tracking and more for teams that want to see their own content’s indexing performance.

    For teams that need to understand category positioning at scale, Topify and Profound lead. Topify adds the execution layer; Profound adds the research depth.

    Operations Dimension: From Insight to Action

    This is where the field narrows sharply.

    Topify built its operations capability around the “actionability gap” directly. Its One-Click Agent Execution lets teams identify a visibility gap and deploy optimized content to close it within the same platform. No separate briefing process. No manual handoff. The system uses direct browser capture rather than API snapshots, targeting 95-98% citation accuracy, which means operations teams aren’t reacting to stale data.

    AirOps is the strongest alternative for content operations specifically. Pages not updated quarterly are three times more likely to lose citations, and AirOps is built to solve exactly that problem. It routes underperforming pages into automated refresh cycles and connects insight data directly to bulk content production. The trade-off is setup time, often a month to implement effectively, plus significant ongoing maintenance.

    Profound provides deep technical diagnostics via Agent Analytics, which tracks AI crawler behavior through CDN logs. But it doesn’t act on those insights natively. Operations teams use it as a high-resolution lens and then manually translate reports into execution tasks elsewhere.

    Otterly.AI has no meaningful integration or execution capability. Its primary export is a Google Looker Studio connector, limited to higher-tier plans. For teams that need automated AEO responses or CMS integration, Otterly’s monitoring-only approach hits a ceiling quickly.

    If your operations team’s bottleneck is moving from data to deployment, Topify is the cleaner path. AirOps is a strong second for teams that define operations as content production at scale.

    Sales Dimension: Does AI Influence Your Pipeline?

    Only two tools in this comparison engage with the sales dimension at all.

    Topify is built around Conversion Visibility Rate (CVR) as a core metric. CVR estimates the likelihood that an AI-generated answer will drive a user toward a brand interaction. The underlying data makes this worth paying attention to: AI-referred search converts at a rate 803% higher than traditional organic search (14.2% vs 2.8%). Topify’s Position Tracking and Sentiment Polarity analysis add further sales context, ensuring teams can validate whether AI models are associating the brand with its correct value propositions during the decision stage. Sales leaders get a metric that justifies AEO investment in quarterly reviews.

    Profound maps the sales dimension through “Conversation Intent” data and “Query Fanouts” analysis. This lets teams trace how a single prompt, say “best CRM for healthcare,” breaks into a chain of sub-queries that map the buyer’s reasoning journey. The “Brand Relevant Prompts” feature identifies which AI conversations are already mentioning competitors. It’s powerful research, but Profound doesn’t connect these intent signals to actual conversion numbers natively. The link to pipeline impact is analytical, not quantitative.

    AirOps can track AI-attributed signups but lacks intent volume analysis or qualitative sentiment scoring for sales contexts. Otterly has no capability in this dimension.

    For sales and growth teams that need to show AI’s actual impact on pipeline, Topify is the only tool in this group with a native metric designed for that conversation.

    The Full Comparison: All Three Dimensions Scored

    CapabilityTopifyProfoundAirOpsOtterly
    Multi-engine monitoring10+ platforms10+ platforms30+ platforms4-6 platforms
    Barry: Marketing dimension✓ Full✓ Full✓ Partial✓ Basic
    Barry: Ops dimension✓ FullPartial (no execution)✓ Full✗
    Barry: Sales dimension✓ CVR + PositionPartial (intent data)✗✗
    Execution layerOne-click AI agentNoneWorkflow automationNone
    Data collection methodDirect browser captureRendered capture + APIPrompt-based pollingAPI snapshot
    Entry pricing$99/mo$99/mo$199/mo$29/mo
    G2 satisfaction score5.04.64.64.9

    The pattern across all three dimensions is consistent. Topify and AirOps are the two tools that offer both monitoring and execution. The key difference is focus: Topify optimizes for cross-functional coverage and agentic deployment, AirOps optimizes for content production governance at enterprise scale.

    Which Tool Fits Your Team

    Start with Otterly if your team’s primary need is proving to clients or leadership that AI mentions exist. At $29/month, it’s the fastest path to a monitoring baseline. You’ll outgrow it if you need to understand or act on what you’re seeing.

    Choose AirOps if your operations team manages a large content library and the main bottleneck is refresh velocity. AirOps connects insight to production in a way no other tool in this group matches, but plan for a real implementation investment.

    Use Profound if you’re in a Fortune 500 environment with procurement cycles and need audit-grade research data (400M+ prompts, SOC 2, HIPAA compliance). It’s the strongest research platform in the category. Pair it with an execution tool if you need to act on the data inside your organization.

    Pick Topify if your team needs to cover all three buyer dimensions without stitching together multiple platforms. Its G2-reviewed feature set spans visibility tracking, automated deployment, and CVR-based sales impact in a single framework. It’s particularly well suited for growth teams and agencies that report on AEO performance across functions and need to show direct business impact.

    The case for a unified platform is practical. Every tool you add to the stack creates a translation cost: exporting data, briefing another team, waiting for execution, checking if it worked. Tools that close that loop internally tend to generate faster returns.

    Conclusion

    G2’s 248-product AEO category is mostly first-generation monitoring tools. They’ll tell you whether you were mentioned. Most won’t tell you why, and almost none will help you fix it.

    Bijou Barry’s three-dimension framework cuts through that noise effectively. Marketing, Operations, and Sales are genuinely different problems, and the tool that covers all three while providing an execution layer is a short list of one in this comparison.

    If you’re starting the evaluation process, Topify’s page shows how its feature set maps across all three dimensions, with user reviews organized by team type.

    Frequently Asked Questions

    What does AEO mean in G2’s software category? 

    Answer Engine Optimization (AEO), also referred to as Generative Engine Optimization (GEO), covers tools that improve a brand’s visibility and positioning within AI-powered search engines and LLM chatbots. G2 requires qualifying tools to offer AI visibility tracking, sentiment analysis, LLM ranking insights, and competitor benchmarking.

    How is Topify different from Profound on G2? 

    Topify combines a 7-metric visibility framework with one-click agentic content deployment, covering all three of G2’s buyer dimensions. Profound is a deep research platform with over 400 million real prompt data points and strong enterprise compliance credentials, but it doesn’t include a native execution layer. Teams that need insights acted on automatically will find Topify’s integrated approach more practical.

    Can AirOps be used for answer engine optimization? 

    Yes, with a specific use case. AirOps connects AI search visibility data to bulk content production workflows, making it a strong choice for teams managing large content libraries. It covers G2’s Marketing and Operations dimensions but doesn’t address the Sales dimension or provide real-time agentic deployment.

    Is Otterly listed on G2? 

    Yes. Otterly.AI holds a 4.9/5 satisfaction score in the AEO category and is widely used by agencies and small businesses. Its $29/month entry tier is among the most accessible in the category. It covers G2’s Marketing dimension only.

    Which G2 AEO tool covers both monitoring and execution? 

    Topify and AirOps both offer monitoring plus execution. Topify uses a one-click AI agent for rapid optimization across all three buyer dimensions. AirOps uses workflow automation specifically for large-scale content operations. For teams that need Sales dimension coverage alongside the other two, Topify is currently the only option in this comparison.

    Read More

  • 5 Things G2 Won’t Tell You About AEO Tools

    5 Things G2 Won’t Tell You About AEO Tools

    G2 ranks AEO tools by satisfaction and market presence. Neither score tells you whether the tool can handle what LLMs actually do.

    You opened G2. You filtered by “Answer Engine Optimization.” You sorted by highest rated.

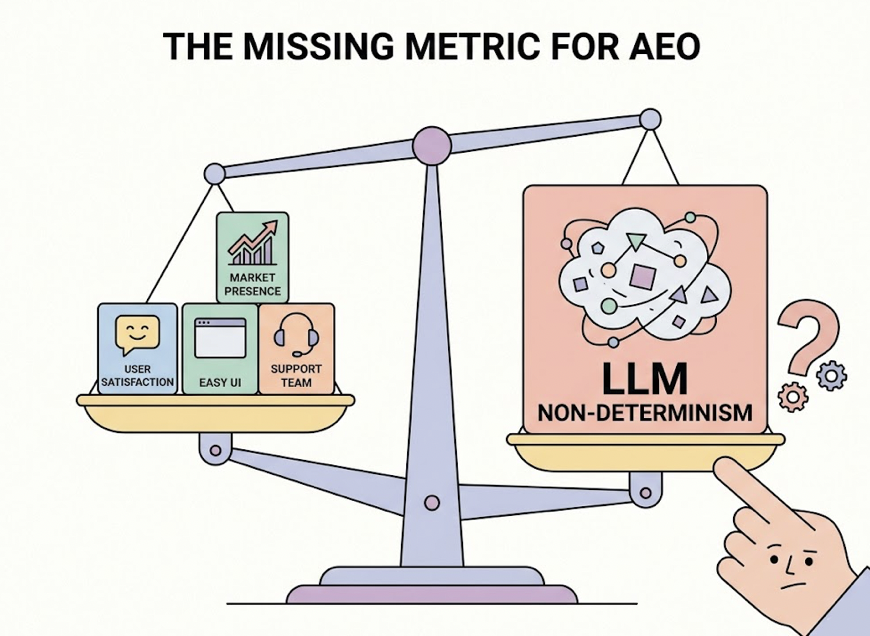
    That’s a reasonable starting point. But here’s the thing: the two dimensions G2 uses to rank software — user satisfaction and market presence — were designed to evaluate CRMs and project management tools. They measure how easy the UI is, how responsive the support team is, and how big the company is. None of that tells you whether a tool can handle the one thing that makes AEO fundamentally different from every other software category: LLM non-determinism.

    Run the same query twice, 30 seconds apart. You may get different brand citations, different positions, different sentiment. Tools that rely on API caches or static snapshots will systematically undercount this variance. And they’ll do it in a way that looks fine on a dashboard.

    That’s the gap G2 scores can’t show you.

    Here’s a five-part framework that does.


    Why G2 Scores Are a Starting Point, Not a Verdict

    G2’s Satisfaction score is built on review breadth, recency, and net promoter ratings. Its Market Presence score factors in employee count, revenue, and social footprint. Both are legitimate signals for evaluating a project management tool or a CRM.

    For AEO tools, they miss the point.

    A tool with a polished UI and 24/7 live chat support can score in the top 10% on G2 while its underlying crawler fails to bypass LLM rate limits. A legacy SEO platform with 10,000 employees can dominate the Leaders quadrant after bolting a thin AI monitoring layer onto a five-year-old architecture.

    High satisfaction doesn’t mean accurate data.

    G2’s review cycle also updates quarterly. AI model weights can shift after any single API call. That speed gap — human review cadence vs. model inference updates — means G2 scores are always looking backward in a category that punishes lag.

    Use G2 to build your shortlist. Then run it through the five checks below.


    Check #1 — Does It Re-Run Queries Live, or Pull From a Cache?

    This is the most important question you can ask any AEO vendor.

    LLMs are non-deterministic by design. Even when Temperature is set to 0 — theoretically a deterministic greedy decoding mode — production API calls still produce variable outputs. The reasons are technical: floating-point rounding differences across parallel GPU threads, Mixture-of-Experts routing logic that shifts under continuous batching, and dynamic inference optimizations like prefix caching that change execution context from one call to the next.

    The practical consequence: accuracy rates for the same prompt can vary by up to 15% across runs. In extreme cases, the gap between best and worst performance reaches 70%.

    A tool that runs one query and caches the result for a week is showing you a single probability event, not your brand’s actual visibility distribution.

    Professional-grade platforms handle this with live re-runs: multiple independent queries across time windows and batching environments for the same prompt. The output isn’t a binary “mentioned / not mentioned.” It’s a probability distribution. That’s Visibility Tracking done correctly.

    When you’re in a vendor demo, ask one question: “For a single prompt, how many independent queries do you run? How do you model variance across runs?” If the answer is vague, the data quality probably is too.


    Check #2 — How Many AI Platforms Does It Actually Cover?

    Most tools that score well on G2 were built when “AI search” meant Google AI Overviews. That’s an understandable origin, but the market has fragmented significantly since then.

    As of early 2026, ChatGPT holds somewhere between 60% and 77% of AI-driven search and discovery traffic. Google Gemini sits at roughly 15%, Microsoft Copilot at 12.5%, and Perplexity at 5.4%. Claude AI is at 5.0% but growing faster than most — up 14% quarter over quarter.

    A tool that only monitors Google AIO leaves you blind to the conversations happening in ChatGPT. That’s three out of four AI interactions you’re not seeing.

    Each platform also retrieves and cites information differently. Perplexity operates more like an AI-native search engine, relying on real-time web crawling and explicit inline citations — which is why tracking tools like Brandmentions have built dedicated Perplexity monitoring features. Google AIO correlates closely with traditional organic ranking signals. ChatGPT draws on training data, RAG retrieval, and browsing — a completely different influence model.

    You can’t optimize across platforms you can’t see.

    Topify tracks across 7+ AI platforms including ChatGPT, Gemini, Perplexity, Claude, DeepSeek, Grok, and others. For a brand with any international or multi-channel presence, that coverage isn’t a nice-to-have. It’s risk mitigation.


    Check #3 — Can It Measure Position, Not Just Presence?

    “Your brand appeared in 50% of AI answers this month.”

    That sounds positive. But if your brand appeared last in a five-item list every single time, that number is misleading you.

    Research into Answer Placement Scores (APS) shows that the first recommendation in an AI-generated list carries a weight of 1.0. The second position drops to roughly 0.6. By the third position and beyond, weight falls below 0.3 — which in a conversational context is functionally invisible. AI answers don’t come with a “see all results” button.

    Mention count without position is noise dressed up as data.

    There’s a second layer that matters equally: sentiment. AI doesn’t just list brands — it characterizes them. Being described as “a budget-friendly option with limited enterprise features” and being described as “the most reliable choice for compliance-heavy teams” are both citations. They produce opposite outcomes for your pipeline.

    Advanced platforms combine position tracking with sentiment polarity analysis, identifying not just where your brand appears but how it’s described — and whether those descriptions align with your positioning. Topify’s Competitor Monitoring surfaces both: where you rank relative to competitors on specific prompts, and when AI characterizations shift in tone.

    That’s the difference between brand monitoring and brand intelligence.


    Check #4 — Does the Data Update Daily, or Weekly?

    Google AI Overview trigger rates jumped from 25% to over 60% in 2025. For informational and educational queries, that shift drove a 61% decline in traditional organic click-through rates. The landscape isn’t just changing — it’s changing faster than most marketing teams can track.

    Three forces drive AI recommendation volatility: model provider weight updates (like OpenAI system prompt changes), real-time RAG retrieval pulling in newly published competitor content, and the compounding effect of third-party citation signals accumulating over time.

    A weekly report can’t catch any of that in time to act.

    Weekly-cadence tools are post-mortems. By the time the report lands, the ranking shift that pushed your brand out of the top position happened four days ago. A competitor published new structured content, AI picked it up within hours, and you’re already behind.

    Daily monitoring with meaningful analysis volume is what makes AEO actionable. Topify’s Basic plan supports up to 9,000 AI answer analyses per month — enough to run core prompts multiple times daily and build a visibility curve instead of a weekly snapshot. That curve is what lets a team catch a ranking drop within 24 hours of the triggering event, not after the next report cycle.

    Speed of insight is a structural advantage. Tools that can’t offer it cost you more than their subscription price.


    Check #5 — Does It Tell You What to Do Next?

    Most G2-ranked AEO tools are reporting tools. They surface data. Then they hand you a dashboard and leave the execution entirely to your team.

    Here’s what that actually looks like in practice: your team sees a visibility gap, manually re-analyzes keyword intent, rewrites content in an answer-first structure, updates the CMS, and then needs to build third-party citations on Reddit, LinkedIn, and Quora to generate the signal AI models actually prioritize. Each of those steps introduces lag. Each step is where strategies stall.

    Data without execution is just a more expensive form of anxiety.

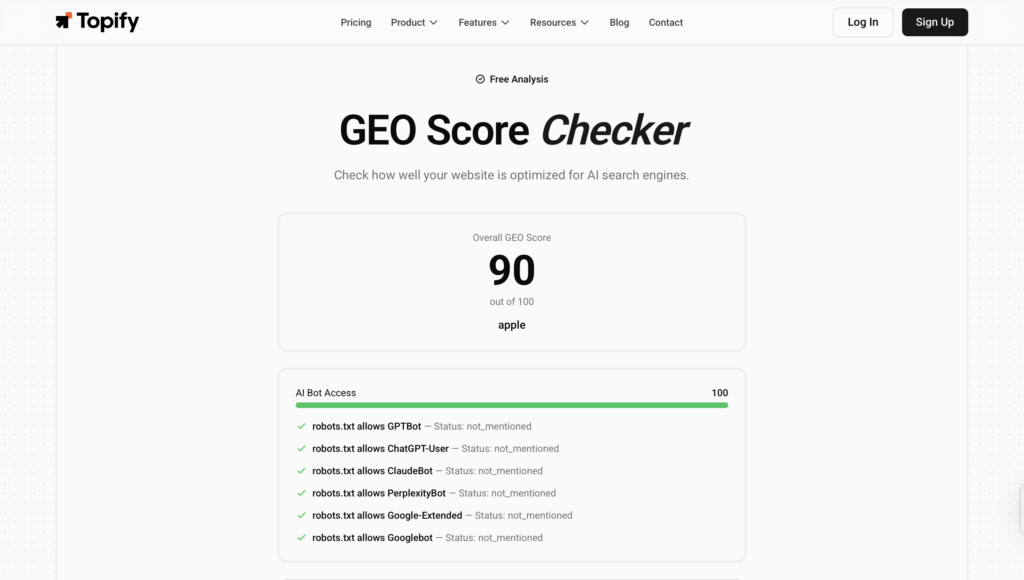
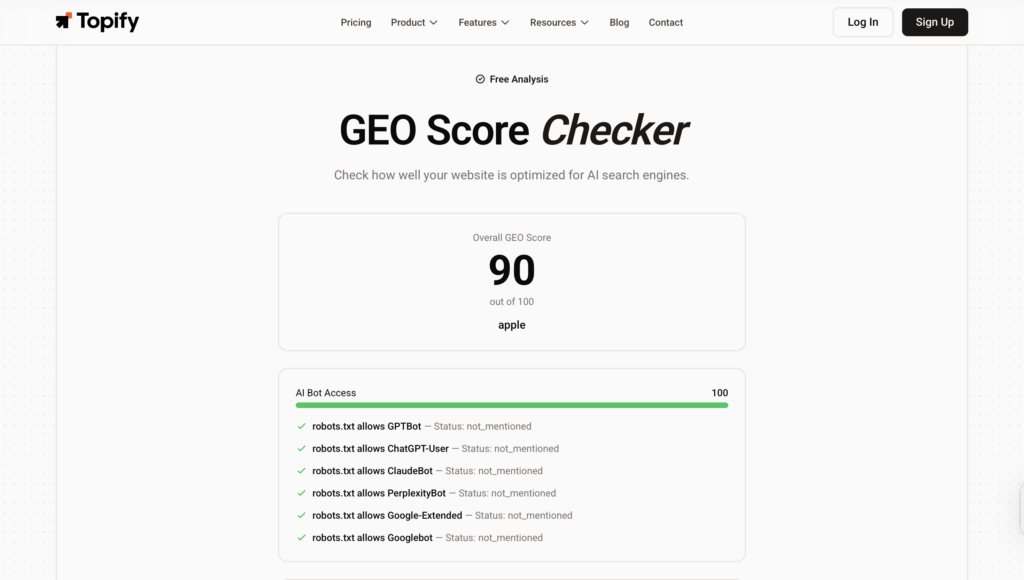
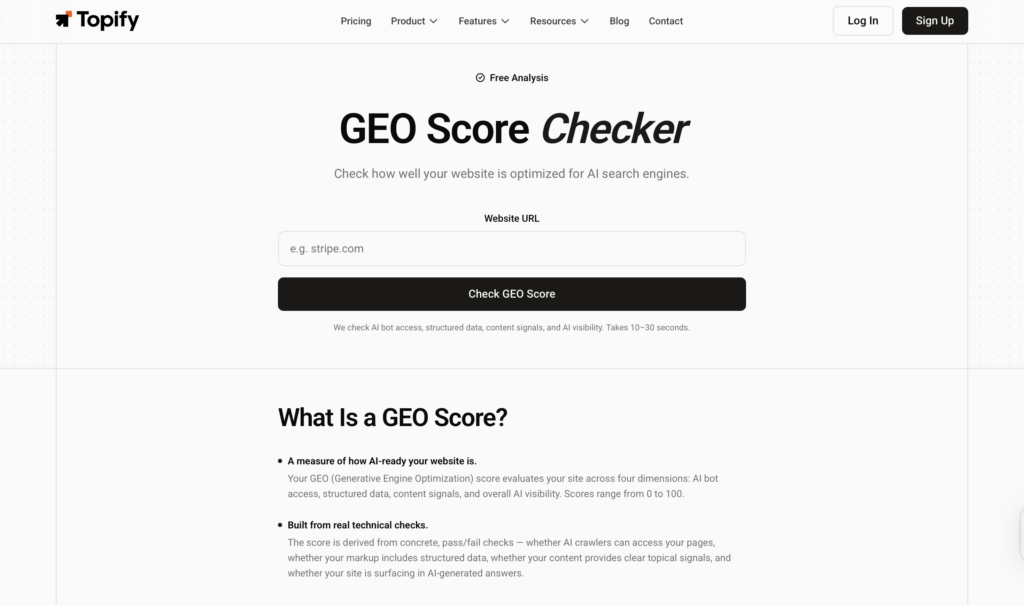
    The next category of AEO platforms closes that loop. Topify’s GEO Score Checker evaluates existing pages against specific AI platform retrieval preferences in real time. Its One-Click Execution takes those insights and deploys optimized content — structured answers, schema markup, entity signals — directly through CMS integrations, without a manual rebuild workflow.

    Most tools stop at data. That’s where the real work begins.

    That gap between reporting and executing is the clearest product-generation difference in the AEO market right now. It’s also the one you’ll never spot on a G2 listing page.


    How to Use This Framework on G2 Right Now

    G2 is still a useful discovery funnel. The problem isn’t where you start — it’s where you stop.

    When you’re on a vendor’s G2 listing page, look past the star rating and check for these signals: does the feature list mention “LLM tracking,” “entity extraction,” or “generative AI optimization” specifically — not just generic “SEO”? Do their customer case studies reference AEO-specific KPIs like Citation Share or Answer Placement Score, or are they still talking about keyword rankings and backlinks? Search the review text for words like “accuracy,” “real-time,” and “caching” — user frustration about data lag often shows up there before it shows up in the aggregate score.

    In a demo or trial, three questions will tell you everything:

    Ask how they handle LLM non-determinism: do they run multiple queries per prompt, and what’s their variance modeling methodology? Ask whether they can distinguish between a positive brand mention with no link and a negative mention with a link in terms of sentiment scoring. Ask whether they have a direct path from insight to content deployment — not just a report, but an execution workflow.

    Here’s how the five dimensions stack up across tool types:

    Evaluation DimensionTopifyTypical G2 High-Scorer
    Data CollectionLive multi-run queries, variance modeledAPI cache or static snapshot
    Platform Coverage7+ platforms including DeepSeek, GrokUsually Google AIO or one other
    Measurement DepthAPS position + sentiment + entity associationBasic mention count
    Update FrequencyDaily monitoring, 9,000+ analyses/moWeekly or monthly reports
    Execution CapabilityGEO Score + one-click CMS deploymentReport only, manual follow-through

    Conclusion

    G2 is where you discover tools. It’s not where you evaluate them.

    AEO is a category where the underlying technology runs on probabilistic systems that change faster than human review cycles can track. The tools that look good on a satisfaction survey may be the same ones feeding you cached snapshots from a week ago and calling it a visibility score.

    The five checks above aren’t exhaustive. But they force the right conversations — about data collection methodology, platform coverage, position granularity, update cadence, and execution capability. Those are the questions that separate a dashboard from a platform that actually moves your brand in AI answers.

    See it work, then test it on your own brand. Explore how Topify handles these exact dimensions on the platform, or run your own brand through the GEO Score Checker for free before committing to anything.


    FAQ

    Q1: What does AEO mean on G2? 

    On G2, AEO (Answer Engine Optimization) typically sits within the SEO or AI marketing software categories. It refers to tools that help brands get cited directly by AI assistants like ChatGPT and Gemini, and AI search engines like Perplexity and Google AI Overviews, rather than just ranking in traditional blue-link results.

    Q2: How is AEO different from traditional SEO tools? 

    Traditional SEO optimizes for clicks on indexed links. AEO optimizes for citations and mentions in AI-generated answers. The signals that matter are different: entity authority, structured content readability, answer-first formatting, and third-party citation signals — not just keyword density or backlink count.

    Q3: What’s the most important feature to check in an AEO tool? 

    Data collection robustness. If a tool can’t demonstrate how it handles LLM output variance — ideally through live multi-run query execution — then the visibility numbers it produces aren’t reliable. After that, execution capability: a tool that only reports without offering an optimization workflow shifts the labor cost to your team without reducing it.

    Q4: Can I trust G2 ratings for AEO tools? 

    Partially. G2 is a useful discovery layer and reflects genuine user satisfaction around UI and support quality. What it doesn’t capture is algorithmic depth, real-time data accuracy, or the technical ability to handle non-deterministic AI outputs. Most reviewers on G2 are evaluating AEO tools through a traditional SEO lens, which means the ratings reflect a different set of priorities than what the category actually requires.


    Read More

  • Why G2 AEO Tools Grew 2,000% in a Year

    Why G2 AEO Tools Grew 2,000% in a Year

    March 2025: seven products listed in a brand-new G2 category called Answer Engine Optimization. January 2026: more than 150. That’s a 2,000%+ expansion in under ten months — faster than almost any software category G2 has tracked in its AI parent group.

    The vendor side of this story is easy to explain. The buyer side is why it matters to your brand.

    7 Products in March 2025. 150+ G2 AEO Tools by Early 2026.

    G2’s AEO category launched quietly. At the time, it met the platform’s minimum listing threshold — six products with ten or more reviews each, plus at least 150 total reviews across the category — but barely. A handful of early tools were targeting a problem most marketing teams hadn’t put on their annual planning radar.

    Ten months later, the category had over 150 products. For context: most enterprise software categories need three to five years to reach that kind of density on G2.

    That growth carried enough momentum to generate a G2 Grid report by Winter 2026, followed by a Spring 2026 Grid shortly after. In G2’s system, a Grid report is a credibility signal — it means the category has passed the threshold from experimental to benchmarkable.

    The page view data reinforces it. According to G2 Data Solutions, the AEO category’s page views ranked first among all AI parent categories on G2 in Q4 2025, climbing 62% compared to the previous quarter. That means buyer interest isn’t slowing after the initial spike. It’s still accelerating.

    The Real Signal Isn’t Vendor Count — It’s How Buyers Changed

    Here’s the thing: software categories don’t grow 2,000% because vendors decided to build new products. They grow because buyers started spending money.

    According to G2’s research, 50% of B2B software buyers now start their purchasing process with an AI chatbot rather than a traditional Google search. Among those, 74% prefer ChatGPT as their primary research tool.

    That behavior shift is the underlying driver behind every number in the G2 AEO category. When half your potential buyers are opening an AI assistant instead of a search engine, your ranking on Google’s page one stops being the whole picture. What the AI says about you — or doesn’t say — determines whether you enter the consideration set at all.

    Emily Greathouse, G2’s Director of Market Research, framed the stakes precisely: the modern buyer’s decision journey is being compressed by AI, and winning the AI’s answer matters more than winning the click.

    That’s not a prediction. It’s already reflected in how buyers report their research behavior.

    AEO Went From “Watch List” to “Budget Line” in Under a Year

    Twelve months ago, most marketing teams listed AEO as something to observe. Now it’s appearing in Q1 planning decks as a distinct budget category.

    The shift happened because the data became concrete enough to justify spend. B2B buyers consume an average of 13.4 pieces of content before they contact a sales rep. Two-thirds of that decision journey is self-directed, with AI assistants increasingly acting as the primary research layer. The brand that appears consistently and accurately in AI answers has already shaped the buyer’s shortlist before a single discovery call takes place.

    One benchmark gaining traction in enterprise marketing circles is the “15% rule” — allocating at least 15% of total search budget to AEO. Research suggests that investments below this threshold typically don’t generate sustained citation growth. Teams that have crossed it report a 38% reduction in cost per lead and a 2.4x increase in meeting bookings, according to Salesforce’s 2026 State of Marketing report. In a year when overall marketing budgets tightened, those efficiency numbers drove AI tool spend up nearly threefold in 18 months.

    Budget decisions are lagging indicators. The fact that AEO is appearing as a budget line now tells you the underlying behavior shift happened earlier.

    Before you benchmark your spend, it’s worth establishing where your brand currently stands in AI answers. Topify’s GEO Score Checker gives you a baseline read across major AI platforms in minutes — useful data before any planning conversation.

    What the G2 Grid Reveals About the AEO Tool Market Right Now

    Most buyers use the G2 Grid to find “who’s established” in a category. That’s useful. But in a category this young, the Grid reveals something more specific: which tools close the loop between data and action, and which ones stop at reporting.

    The AEO category has bifurcated into two distinct product types. First: monitoring tools that surface AI visibility metrics but leave the fix to your team. Second: full-stack platforms that connect the insight to the execution — identifying why your brand is missing from AI answers and deploying content to address it.

    That distinction doesn’t show up in feature lists. It shows up in satisfaction scores and user retention. On the G2 Spring 2026 AEO Grid, the platforms with the highest satisfaction ratings are consistently the ones in the second category.

    G2 also functions as a data source for the AI systems themselves. The platform holds roughly 22.4% share of voice across AI-generated software recommendations, and on Perplexity specifically, G2 accounts for 75% of citations from review-type platforms. AI systems treat G2 profiles as structured, machine-readable evidence — not just user testimonials. Reviews that include specific use cases, measurable outcomes, and technical detail carry more citation weight than general sentiment.

    That means a brand’s G2 presence isn’t just a social proof asset anymore. It’s part of the AI visibility stack.

    Topify on G2 Spring 2026: What the Data Backs Up

    Topify sits in the small group of platforms that combine measurement with execution rather than treating them as separate workflows. The team behind it includes founding researchers from OpenAI, Stanford LLM authors with 2,000+ citations, and a Google SEO champion who scaled Fortune 500 traffic from zero to a million organic visits, which shapes how the product handles both the AI side and the search side.

    The coverage layer is broader than most tools in the category. Topify tracks brand visibility across ChatGPT, Gemini, Perplexity, Claude, and other major AI platforms — which matters because your buyers aren’t all using the same AI assistant, and gaps in coverage become blind spots in your data.

    The analytics framework tracks seven KPIs: visibility, sentiment, position, volume, mentions, intent, and CVR (Conversion Visibility Rate). That last metric estimates the probability that an AI answer is actually directing a buyer toward your brand — which is the number most marketing dashboards are currently missing. Visibility tells you if you’re being mentioned. CVR starts to tell you whether it’s converting.

    Topify’s source analysis feature works in the opposite direction: it reverse-engineers the exact URLs that AI platforms cite when recommending brands in your category. For content teams, that data directly answers the question of what to build next. You’re not guessing which content fills the citation gap — you’re seeing which domains are being pulled and why yours isn’t among them.

    You can explore Topify’s platform and features on the official site, or start a 7-day free trial to pull your own brand’s AI visibility baseline before your next planning cycle.

    How to Pick a G2 AEO Tool Before the Category Gets Noisier

    With 150+ products in the category and new entrants arriving monthly, selection pressure is real. Most tools share surface-level feature parity — dashboards, visibility scores, platform mentions. The differences that actually matter show up in three areas.

    Platform coverage. Single-platform tools are common and inexpensive. But if your buyers are distributed across ChatGPT, Gemini, and Perplexity, a tool that only monitors one of them isn’t showing you a complete picture. Coverage gaps become strategy gaps.

    Metric depth. Visibility percentage is a floor, not a ceiling. Look for tools that track position relative to competitors, sentiment accuracy over time, and source citation analysis. These are the signals that connect AI mentions to actual pipeline behavior.

    Execution capability. Data without a clear path to action is a reporting exercise. The platforms with the strongest G2 satisfaction scores in the AEO category are consistently the ones that help you act on what you find — not just document it.

    Here’s how the two main tool types stack up across these dimensions:

    CapabilityMonitoring-only toolsFull-stack AEO platforms
    Multi-platform AI trackingOften single-platformChatGPT, Gemini, Perplexity + others
    Competitor benchmarkingLimitedReal-time, multi-platform
    Source citation analysisRarely includedYes
    Content gap identificationNoYes
    Agent-based executionNoYes (e.g. Topify)
    Entry price$49–$79/mo$99–$499/mo

    One practical filter: use the High Performer quadrant on the G2 Spring 2026 Grid as your starting point, not just the Leaders. In a category this young, satisfaction scores are a more reliable signal than market presence scores. High Performers have strong user validation but may not have scaled distribution yet — for a newer category, that’s often where the better product lives.

    Conclusion

    The 2,000% growth in G2’s AEO category isn’t a forecast about where marketing is heading. It’s a data point about where buyers already are.

    When half of B2B software buyers start their research with an AI chatbot, your position in those AI answers directly affects whether you make the initial shortlist. The G2 Spring 2026 AEO Grid gives you a peer-reviewed starting point for evaluating which platforms are worth testing. Use it alongside a current baseline of your own AI visibility — you need both to make an informed decision.

    The brands that ran this audit twelve months ago are already ahead. The window before it becomes table stakes is closing.

    FAQ

    What is the G2 AEO tool category? 

    The Answer Engine Optimization (AEO) category on G2 groups tools designed to help brands improve their visibility in AI-generated answers across platforms like ChatGPT, Gemini, and Perplexity. The category launched in March 2025 with 7 products and grew to 150+ by early 2026, making it one of the fastest-growing software categories on the platform.

    How is AEO different from SEO? 

    SEO optimizes for search engine rankings — getting your pages to rank in Google’s results. AEO optimizes for AI-generated answers, which means ensuring that large language models cite, reference, and recommend your brand when buyers ask research questions. The mechanics differ: AI systems prioritize structured content, semantic consistency across third-party sources, and citation density over traditional backlink signals and keyword density.

    What should I look for when evaluating a G2 AEO tool? 

    Prioritize platform coverage (does it track ChatGPT, Gemini, and Perplexity, not just one), metric depth (visibility percentage is a starting point — look for sentiment, competitive position, and source citation analysis), and execution capability (can it help you act on the data, or does it only report it?). On the G2 Spring 2026 Grid, start with the High Performer quadrant for the strongest satisfaction signals in an early-stage category.

    Why is G2 specifically important for AEO strategy? 

    G2 holds approximately 22.4% share of voice in AI-generated software recommendations and accounts for 75% of review-platform citations on Perplexity. AI systems treat structured G2 profiles as credible, machine-readable evidence. That means reviews containing specific use cases and measurable outcomes carry citation weight in AI answers — making G2 presence a direct input to AEO performance, not just a social proof channel.

    Read More

  • GEO Score Checker: Which Free Tool Actually Fixes You

    GEO Score Checker: Which Free Tool Actually Fixes You

    You run a free GEO score checker. Your brand scores a 42.

    Now what?

    That’s the moment most tools abandon you. You’ve got a number, a vague sense of underperformance, and zero clarity on what to actually change. The score isn’t the problem. The missing roadmap is.

    This comparison breaks down the leading free GEO tools across four dimensions that matter: what they detect, whether they tell you what to fix, whether they track changes over time, and whether they show you what your competitors are doing differently.

    Your GEO Score Is 42. Here’s Why That Tells You Almost Nothing

    A score of 42 doesn’t tell you why you’re invisible to AI.

    There are at least three distinct root causes behind a low GEO score, and each one requires a completely different fix:

    The technical parsing gap. Your content might be authoritative, but structured in a way that AI crawlers and RAG systems can’t extract effectively. Heavy JavaScript, missing heading hierarchy, no FAQ schema.

    The authority deficit. Your site looks great, but AI models verify “truth” through third-party signals. If you’re not mentioned on Reddit, G2, or industry publications, the model has no external validation to cite.

    The semantic mismatch. You’re optimizing for keywords with high traditional search volume, but those aren’t the conversational prompts people actually type into ChatGPT or Perplexity.

    A score of 42 could mean any of these three things. Or all of them at once. A tool that only shows the number gives you nothing to act on.

    What a GEO Score Actually Measures

    The most useful GEO scoring frameworks evaluate at least five dimensions simultaneously:

    DimensionWhat It MeasuresWhy It Matters
    Visibility (Presence Rate)How often your brand appears across AI responses for tracked promptsDetermines whether you enter the model’s consideration set at all
    SentimentEmotional tone and framing when the AI describes your brandAffects recommendation probability and long-term model trust
    PositionYour rank order in AI-generated comparison listsAI summaries give disproportionate depth to the top 3 results
    Source CredibilityAuthority of third-party domains that cite your brandModels prioritize publisher consensus and community validation
    Structural IntegrityH-tags, FAQ schema, tables that enable easy data extractionFundamental for RAG systems to “clip” relevant information

    Research by Aggarwal et al. found that the strongest GEO improvements come from adding statistics and expert quotations to content, not from keyword variations. Traditional SEO tactics like keyword stuffing have negligible impact on AI visibility. The ranking logic has fundamentally shifted.

    That’s why a single composite score, without dimension-level breakdown, is a diagnostic dead-end.

    The Blind Spots Most Free GEO Tools Share

    The surge in free checkers has made GEO scoring accessible. It’s also created a new kind of problem.

    The one-platform bias. Many free tools only test ChatGPT. But ChatGPT, Perplexity, Gemini, and Claude don’t “read the same internet.” Perplexity, for instance, pulls heavily from Reddit, which accounts for 46.7% of its top citations. A brand that appears consistently in ChatGPT responses may be completely absent on Perplexity. A score based on one model is a partial picture at best.

    Output without advice. Most tools give you a total score and stop there. If your Sentiment Score is 50 out of 100, you need to know which specific third-party source is dragging it down. Without that, you’re left guessing between a PR campaign, a schema fix, or a content rewrite.

    The snapshot problem. Research shows that only about 30% of brands maintain consistent visibility across multiple regenerations of the same query. Model drift and stochastic variation in token generation mean a score captured in the morning can be meaningless by afternoon. A single-point snapshot isn’t a strategy input.

    These aren’t minor gaps. They’re the reason teams spend weeks debating where to start while their competitors keep picking up citations.

    Free GEO Tools, Compared Across Four Dimensions

    Here’s how the leading tools stack up on the criteria that actually matter for decision-making:

    ToolMulti-Platform CoverageFix RecommendationsCompetitor CitationsContinuous Tracking
    HubSpot AEO GraderChatGPT, Gemini, PerplexityGeneral written interpretationLimitedNo
    Mangools AI Search Grader8+ models (incl. Claude, Llama)Low, focus on visibility scoresBasic ranking comparisonNo
    Geoptie GEO AuditMulti-engine readinessHigh, 6-dimension breakdownNo direct trackingNo
    Frase GEO Score CheckerChatGPT, Perplexity, ClaudeSpecific (citability, key takeaways)NoNo
    Topify GEO Score CheckerFull ecosystem (incl. DeepSeek, Doubao)Prioritized action feedDeep, source URL analysisYes

    Each tool occupies a different niche. HubSpot’s AEO Grader works well for a one-time “board-ready” overview of how AI characterizes your brand, whether as a market leader or a traditional player. Mangools functions as the rank tracker of the AI era: broad model coverage, simple visibility signals, no execution layer. Geoptie offers the most technically thorough free audit for structural readiness, though it doesn’t track changes or surface competitor data. Frase focuses specifically on URL-level citability, useful for optimizing individual pieces of content.

    The pattern across all four: they diagnose. They don’t prescribe.

    What Topify’s GEO Score Checker Does Differently

    The core gap in most free tools is what happens after the score. Topify’s GEO Score Checker is built around closing that gap specifically.

    It starts with broader coverage. The tool evaluates brand visibility across ChatGPT, Gemini, Perplexity, DeepSeek, Doubao, and other major AI platforms. That matters because a visibility gap on one platform and not another usually points to a specific type of fix, whether that’s structured data, third-party mentions, or content format.

    The more significant difference is the action layer. When Topify detects a gap, it doesn’t just flag it. Its Source Analysis identifies the exact URLs and domains AI platforms are citing when they answer queries in your category. For a B2B SaaS brand, this might reveal that 85% of citations come from Reddit, G2, and industry publications, not from brand-owned content. That’s not a content quality problem. It’s a citation network problem, and it calls for a specific outreach strategy, not more blog posts.

    The platform tracks changes over time. Every content update or new citation feeds back into the visibility metrics, so you can see whether a specific fix actually moved the score before deciding to scale it. The optimization loop is closed, not open-ended.

    Topify’s seven-metric framework (visibility, mentions, sentiment, position, volume, intent, and CVR) connects AI search data to downstream revenue signals. That’s the bridge most free tools don’t build.

    Scores without a fix roadmap are just noise.

    The Right Tool Depends on Where You’re Trying to Go

    Not every team needs an execution platform. Here’s a straightforward way to think about the decision:

    If you want situational awareness: Any free tool gives you a baseline. HubSpot or Mangools work fine for understanding where you stand before a strategy conversation or a leadership review.

    If you’re trying to move the number: You need something that tells you which fix produces the fastest score improvement, tracks whether it worked, and shows you what competitors are doing to earn the citations you’re missing. Free snapshot tools can’t do that.

    The gap between these two scenarios is the difference between knowing your brand scores a 42 and knowing that fixing your schema on three specific pages would push you past a competitor who’s currently getting cited for 68% of the queries in your category.

    Who Gets the Most Value from Topify’s GEO Score Checker

    B2B SaaS brands where AI search is already influencing pipeline. Buyers are using ChatGPT and Perplexity to evaluate software before they ever visit a vendor site. Topify helps SaaS teams maintain a coherent semantic footprint across feature pages, comparison content, and documentation, so AI systems understand exactly what the product does and who it’s built for.

    Marketing and SEO agencies managing multiple clients. Daily prompt testing across dozens of models doesn’t scale manually. Topify’s multi-project management and one-click execution give agencies a way to deliver measurable AI visibility improvements without adding headcount.

    SEO teams transitioning from traditional search. Teams moving from “ten blue links” to “AI citations” need a tool that bridges both worlds. Topify integrates technical signals like schema and crawlability with AI-native signals like sentiment and source citation patterns, which means one platform instead of a fragmented stack.

    FAQ

    What is a GEO score and how is it calculated? A GEO score measures how visible and trustworthy a brand is within AI-generated answers. Most professional tools calculate it as a weighted average across visibility (frequency of appearance), sentiment (tone of description), position (rank in AI-generated lists), and source credibility (authority of cited URLs).

    Are there any truly free GEO score checkers? Yes. HubSpot AEO Grader, Geoptie GEO Audit, Mangools AI Search Grader, and Frase all offer free tiers that work well for baseline audits. Topify also offers a free GEO Score Checker at topify.ai/tools/geo-score-checker with prioritized fix recommendations, which goes further than the purely diagnostic tools.

    How often should I check my GEO score? More often than most teams think. Research suggests only about 30% of brands maintain consistent AI visibility across multiple regenerations of the same query, due to model drift. A practical cadence: weekly for top-priority prompts, monthly for citation trends and sentiment shifts, quarterly to connect GEO metrics to pipeline and branded search lift.

    What’s the difference between a GEO score and an SEO score? SEO scores measure demand capture through backlink volume, crawlability, and link rankings. GEO scores measure demand influence: how likely an AI is to cite your content based on its factual density, authoritative tone, and structural clarity. Different signals, different optimization strategies.

    Can a GEO tool tell me which fixes to prioritize? Most diagnostic tools, like HubSpot or Mangools, can tell you your score is low but can’t tell you what to change first. Tools with an execution layer, like Topify, analyze visibility gaps against competitor citation data to surface a prioritized action feed, showing exactly which changes move the score fastest.

    Conclusion

    A GEO score is the start of a conversation, not the end of one. The question isn’t whether your score is 42. It’s whether your tool can tell you what to do about it, in what order, and how to verify it worked.

    Free tools are genuinely useful for establishing a baseline or building the case for a GEO investment. But if you’re tasked with actually improving AI search visibility, you need something that closes the loop between data and execution.

    Topify’s GEO Score Checker is worth starting with, specifically because it doesn’t stop at the number.

    Read More

  • Your GEO Score Is Useless Without This 5-Step Workflow

    Your GEO Score Is Useless Without This 5-Step Workflow

    Most brands run a GEO score check and stop there.

    They see a number, screenshot it, maybe share it in a Slack channel, and then… nothing. No action, no follow-through, no visible change in how often AI systems actually recommend them.

    That’s the gap most brands still can’t see. A GEO score isn’t a result. It’s a starting point. And without a structured workflow to act on it, the score is just a data point collecting dust.

    This guide walks through the five-step process that turns a GEO score into real AI citations — the kind that show up in ChatGPT, Gemini, and Perplexity responses when your ideal customers are making decisions.

    Step 1. Run Your GEO Score Check Before You Touch Anything Else

    The single most common mistake in GEO programs is optimizing without a baseline. Teams start producing content, updating schema, and chasing citations — all before they know where they actually stand.

    In a stochastic environment like large language models, that’s expensive guesswork.

    A GEO score check establishes the baseline your entire optimization strategy depends on. It measures how likely your brand is to be cited and recommended by platforms like ChatGPT, Gemini, and Perplexity — not as a single number, but as a weighted composite across six technical and qualitative dimensions:

    AI Bot Access is the binary foundation. If your robots.txt blocks crawlers like GPTBot, OAI-SearchBot, ClaudeBot, or PerplexityBot, you’re invisible to the retrieval-augmented generation (RAG) systems powering real-time AI search. Everything else in your GEO strategy becomes irrelevant.

    Structured Data measures your JSON-LD schema implementation. Schema acts as a machine-readable identity card — it helps AI engines resolve entities and understand relationships without relying on natural language interpretation.

    Visibility tracks how often your brand appears in responses for a set of high-intent industry prompts. This is your Share of Model: the percentage of relevant AI answers where your brand gets a mention.

    Sentiment evaluates how AI characterizes your brand when it does mention you. “Leading solution” and “budget alternative” are both citations — but one drives purchase intent and one doesn’t.

    Position measures where you appear in the generated answer. A first-position mention carries 32% higher purchase intent than a fourth-position mention, according to generative search research.

    Source Coverage tracks the diversity of third-party platforms citing you. AI models are 6.5 times more likely to recommend a brand when multiple independent sources — Reddit, Wikipedia, industry publications — corroborate its authority.

    Without this baseline, marketing teams can’t distinguish between a temporary model fluctuation and a systemic failure in their content strategy. The Topify GEO Score Checker runs this diagnostic across all six dimensions and surfaces exactly where the gap is.

    Step 2. Your GEO Score Masks More Than It Reveals — Find the Weak Dimension

    An aggregate score of 88/100 sounds like “excellent.” It’s often not.

    A brand can score well in technical SEO and AI bot access while remaining invisible for every high-intent buying prompt. The overall number smooths over the specific dimension that’s actually dragging performance. That’s where teams waste months optimizing the wrong things.

    The diagnostic work in Step 2 is about peeling back the aggregate to find the single weakest dimension. Each dimension has a different failure pattern:

    DimensionWhat It SignalsHow to Spot It
    SentimentAI describes your brand negatively or neutrallyHigh visibility, low conversion; AI frames you as “expensive” or “complex”
    PositionFrequent mentions, but always at the bottom of listsCitations exist, but competitors are named first every time
    Source CoverageAI only pulls from your own domainZero citations from Reddit, news media, or third-party review sites
    CVRPresent for informational queries, absent for decision-stage promptsMentioned in “what is X” answers, not in “best X for Y” answers

    The recommendation here is counterintuitive: don’t try to fix everything at once. In an LLM environment, shifting too many variables simultaneously makes it impossible to attribute improvements to specific actions. Pick the single most underperforming dimension and run a targeted remediation before touching anything else.

    Step 3. Don’t Optimize Blindly — Build a Prompt-Specific Action Plan

    GEO optimization is not about producing more content.

    It’s about producing content that satisfies the specific retrieval requirements of the engines. Once you’ve identified your weak dimension from Step 2, the response needs to be targeted — not generic.

    Different weaknesses require fundamentally different fixes:

    Source Coverage deficit: If AI engines only cite your own domain, you have a third-party validation problem. AI systems use something functionally similar to consensus scoring. The fix is earned media and digital PR — securing mentions on Reddit, industry publications, and third-party listicles. Off-site signals are often more effective than any on-page change.

    Sentiment deficit: If you’re described as “known for complex setup” or “better for enterprise,” the action plan involves publishing content that directly counters that narrative with evidence. Case studies with specific metrics. Review platform signals from G2 or Trustpilot. AI models synthesize these sources when forming their characterizations.

    Position deficit: Research shows that 44.2% of AI citations come from the first 30% of a page’s content. To move from trailing mention to top recommendation, content must lead with a 40-60 word direct answer to the prompt — not a long intro that buries the key information.

    The execution gap is where most teams stall. Identifying the fix is one thing. Deploying it across multiple content properties, updating schema, coordinating between writers and developers — that’s where timelines slip by weeks.

    Topify’s One-Click Agent addresses this directly. Define your goal in plain language, review the proposed strategy, and deploy with a single click. The agent handles monitoring, gap detection, content formulation, and direct publishing to your CMS — without requiring manual coordination across teams.

    Step 4. Track AI Citations — Not Just Rankings

    Here’s what traditional SEO metrics miss entirely: a page can rank #1 on Google and never get cited by ChatGPT.

    Ranking and citation are different signals. Generative engines don’t pull from the top of a search index — they pull from content that satisfies the structural requirements of retrieval-augmented generation. A page that ranks well but lacks factual depth, structured data, or third-party corroboration is invisible in AI answers.

    That’s why AI citation frequency is the North Star metric for the modern search marketer — not rankings, not impressions.

    Citations are the mechanism that preserves the revenue pathway in a zero-click world. While a mention builds awareness, a clickable citation is what drives high-converting referral traffic. Research shows that content incorporating authoritative citations, direct quotes, and relevant statistics achieves 30-40% higher visibility in generative engine responses.

    Different platforms also have different citation behaviors:

    PlatformCitation PatternWhat to Prioritize
    ChatGPT3-5 sources; favors high-authority editorial sitesEncyclopedic, factual depth
    Perplexity5-12 sources; heavy focus on recency and original dataMonthly updates and data-dense reports
    Google AIOFavors answer-first snippets from top rankingsTechnical SEO foundation + direct answers
    GeminiTrusts institutional sources (.gov, .edu) over UGCExpert authorship and credentials

    Tracking these citation patterns manually across four platforms is not realistic for any marketing team. Topify’s AI Visibility Tracker queries actual AI platforms and reads real-time responses to determine your Share of Voice. It identifies the specific trigger keywords that cause an AI to mention your brand — and detects the visibility gaps where you should be present but currently aren’t.

    That’s the data that informs every decision in the next step.

    Step 5. Iteration Is the Product — Set a 30-Day Feedback Cadence

    AI search is not a set-and-forget environment. LLMs update constantly. Search indices are dynamic. Content cited yesterday may be ignored by next week.

    Freshness is a primary citation signal. Pages updated within the last 14 days are cited 2.3 times more frequently than pages untouched for 60 or more days. After 90 days without updates, citation rates typically plateau at 40% of their initial peak.

    Update CadenceCitation Probability
    Continuous (Monthly)100% baseline maintained
    One-Time Optimization-60% decay within 3 months
    Biannual RefreshSignificant visibility gaps

    The implication is clear: GEO is an ongoing system, not a campaign. The brands winning AI citations aren’t the ones who ran the best one-time optimization. They’re the ones who built a repeatable monthly cadence.

    A 30-day feedback loop looks like this: re-run your GEO score on Day 1 to capture any shifts. Spend Days 2-5 analyzing new weak dimensions or emerging competitor threats. Use Days 6-10 to execute — update content, add statistics, refresh expert quotes. Then monitor recovery metrics through the rest of the cycle and prepare for the next iteration.

    Topify’s AI Agent automates the execution layer of this loop. It continuously monitors your brand’s presence, identifies when citation rates drop, and proactively deploys fixes without requiring a manual trigger. You define the goals; the system handles the cadence.

    Why Most Teams Get Stuck After Step 1

    The gap between brands winning at GEO and those falling behind isn’t usually a matter of effort. It’s a matter of integration.

    Most marketing teams run three separate workflows: a tracking tool, a strategy planning process, and a content execution platform. These rarely talk to each other. When AI citation rates drop, the delay between identifying the problem and deploying a fix can stretch to weeks — and in an environment with a strong recency bias, that delay is expensive.

    That’s the structural problem Topify was built to solve.

    ApproachResultKey Weakness
    Score OnlyTemporary awareness of declineNo mechanism for fast recovery; manual work blocks progress
    Fragmented ExecutionInconsistent visibility across enginesHigh coordination costs; updates lag citation decay
    Topify Closed-LoopSustained citation leadershipRequires commitment to an automated, iterative workflow

    Topify is the only platform that unifies AI search tracking, GEO optimization strategy, and content execution in a single system. From running your first GEO score check to publishing optimized content and monitoring real-time citation changes, the entire workflow runs in one place — without coordination overhead.

    That closed-loop structure is what separates brands that maintain AI visibility from those who constantly play catch-up.

    Conclusion

    A GEO score tells you where you stand. It doesn’t tell you what to do next — and that’s the gap most brands don’t close.

    The five-step workflow here — baseline check, weak dimension diagnosis, targeted action plan, citation tracking, and continuous iteration — is what turns a number into a system. Each step feeds the next. And each cycle of the loop compounds on the one before it.

    In a world where 90% of B2B buyers use AI tools at some point in their purchasing journey, and AI-referred visitors convert at up to 4.4 times the rate of traditional organic visitors, the brands that build this system now are establishing a durable advantage. The ones that don’t will keep wondering why their score looks fine but no one’s citing them.

    FAQ

    What is a GEO score and how is it calculated? 

    A GEO score measures a website’s readiness for AI search engines. It’s calculated using a weighted methodology across six dimensions: AI Citability (25%), Brand Authority (20%), Content E-E-A-T (20%), Technical SEO (15%), Schema Markup (10%), and Platform Readiness (10%).

    How often should I check my GEO score? 

    Weekly for high-competition industries; monthly at a minimum for others. Citation frequency drops significantly after 30 days without updates, so a monthly check is the baseline for maintaining visibility.

    What is a good GEO score? 

    A score of 70 or above is considered good. Scores of 85 or above indicate that AI engines likely treat your brand as a primary source of authority for relevant prompts.

    Can I improve my AI citations without changing my website? 

    Yes. Off-site signals carry significant weight. Increasing your Source Coverage by securing mentions on Reddit, Wikipedia, and authoritative third-party media is often more effective than on-page changes alone.

    How long does it take to see results after GEO optimization? 

    Changes targeting real-time engines like Perplexity can appear within hours or days. For indexed engines like ChatGPT or Google AI Overviews, meaningful improvement typically takes 3 to 8 weeks.

    Read More

  • GEO Score Benchmarks 2026: How Does Your Site Stack Up?

    GEO Score Benchmarks 2026: How Does Your Site Stack Up?

    You ran the GEO Score check. Got a 54. Now what?

    A number without context isn’t a metric, it’s noise. The only way to know whether 54 means you’re ahead of the curve or quietly falling behind is to compare it against what’s actually happening in your industry. That’s what this benchmark report is for.

    What Your GEO Score Is Actually Measuring

    Before the numbers, a quick clarification: a GEO score measures your site’s content-level readiness to be ingested and cited by AI engines. It’s not a real-time tracker of whether ChatGPT mentioned you this morning. Think of it as an audit of your structural health, not a live performance report.

    The score pulls from four core dimensions:

    AI bot access checks whether crawlers like GPTBot, ClaudeBot, and PerplexityBot can actually reach your content. Many legacy sites unknowingly block these agents via outdated robots.txt files, or serve JavaScript-rendered pages that AI crawlers can’t parse.

    Content clarity measures how well your pages are broken into self-contained, fact-dense blocks. AI engines don’t consume full pages. They retrieve chunks. A page that reads as one long wall of text has low “extractability” regardless of how well-written it is.

    Authority signals track E-E-A-T indicators: verifiable statistics, original research, expert attribution. Princeton University research found that adding statistics can drive a 37% increase in AI visibility, while citing authoritative sources can lead to a 115% boost for lower-ranked pages.

    Citation-friendliness assesses structured data presence, specifically JSON-LD schema, FAQPage markup, and whether the site has deployed an llms.txt file to guide AI crawlers toward priority content.

    The 2026 GEO Score Scale

    Score RangeStatusWhat It Means
    0–39Foundational DeficiencyCritical technical gaps; AI crawlers blocked or content unparseable
    40–60Industry AverageMost sites land here; basic SEO present but not AI-optimized
    61–74Conscious OptimizationActive GEO attempts; inconsistent schema and structure
    75–84High AI ReadinessStrong E-E-A-T signals; frequent FAQ schema; RAG-friendly content
    85+EliteProactively designed for AI; dominant entity authority; systemic schema

    A score above 70 is considered good. Above 85 is where the leaders actually live.

    To get your baseline, the Topify GEO Score Checker runs a standardized technical audit across all four pillars and maps results to actionable recommendations.

    GEO Score Benchmarks by Industry in 2026

    Here’s where the data gets useful. Performance varies significantly by sector, and the gap between average and leading brands tells you exactly what’s winnable.

    B2B SaaS: Technical Depth, FAQ Gaps

    MetricBenchmark
    Average GEO Score52–58
    Leading Brand Score72–80+
    AI Referral Share2.80% (highest tracked)
    Primary GapsTechnical doc structure, FAQ coverage, schema completeness

    B2B SaaS companies start with an advantage: high-density informational content, which is exactly what AI engines prefer. The problem is that most of that content is written for humans scanning a features page, not for AI systems retrieving a specific answer chunk.

    The brands sitting at 72+ have restructured their help centers and technical documentation to mirror conversational prompts. One common pattern: using sameAs links in schema to anchor product entities to GitHub, G2, or LinkedIn, creating a “consensus signal” that AI engines use to verify brand claims.

    The most common gap at the average band (52–58)? FAQ content that answers generic questions instead of the specific, comparison-oriented questions your buyers are actually asking AI assistants.

    E-commerce: Thin Pages, Weak UGC Signals

    MetricBenchmark
    Average GEO Score44–52
    Leading Brand Score68–76
    AI Overview Presence6.80%
    Primary GapsThin product descriptions, no comparative data, weak UGC

    E-commerce has the steepest hill to climb. Most product pages are built for visual browsing. AI agents do attribute-based retrieval. Those aren’t the same task.

    Pages scoring below 61 are rarely considered by AI agents for purchase recommendations. Leading brands like Walmart and Amazon maintain high scores by combining massive user-generated content with detailed product attribute schemas. The gap for smaller retailers is specific: they don’t explain their product’s relationship to competitors. AI engines struggle to cite a product page that doesn’t tell them why to recommend it over alternatives.

    Comparison-oriented content, “X vs. Y” pages, detailed attribute breakdowns, verified review data, is what separates a 52 from a 72 in this sector.

    Media and Publishing: The Citation Architecture Problem

    MetricBenchmark
    Average GEO Score58–65
    Leading Brand Score80–88
    Primary GapsUnstructured citations, poor AI summary friendliness

    Publishers start with a natural advantage: content density. That’s why their average scores are higher than most other sectors. But they’re increasingly penalized for what might be called disorganized citation architecture.

    The primary differentiator for leading publishers is the “Bottom Line Up Front” (BLUF) writing structure. AI engines prioritize pages where the first 60 words directly answer the primary question. Many editorial teams write in the opposite direction: context, background, then the point.

    The other issue is a dual-optimization trap. Teams are trying to hold traditional SEO rankings while simultaneously improving AI citation probability, and without a unified framework, both suffer.

    Local Services: The Knowledge Graph Crisis

    MetricBenchmark
    Average GEO Score38–48
    Leading Brand Score60–70
    AI Overview Presence4.40% (lowest across sectors)
    Primary GapsNo structured data, thin content, missing Local Knowledge Graph signals

    Local services, legal, medical, home maintenance, consistently hold the lowest GEO scores in 2026. AI assistants frequently avoid citing local providers because their information (pricing, availability, specific expertise) isn’t provided in a verifiable, structured format.

    That’s a fixable problem. Leading local brands have built what you might call “Knowledge Hubs”: pages dedicated to answering specific, non-transactional questions rooted in their market. Think “Why does tap water taste different in [City]?” rather than “Hire us for water treatment.” These pages establish local authority in AI training data in a way that a service page never will.

    What Brands Scoring 85+ Are Actually Doing

    Getting above 85 isn’t a volume game. It’s a structure game. These brands have stopped thinking about “writing more content” and started thinking about their site as a data layer for the generative web.

    Systemic schema markup. Average sites use basic Article schema. Elite brands implement deeply nested JSON-LD across Organization, FAQPage, HowTo, and WebApplication schemas. The sameAs attribute links brand entities to Wikipedia, Wikidata, and Crunchbase, creating external verification that AI engines treat as a credibility signal.

    FAQ content designed for extraction. Pages with FAQPage schema see a 3.1x higher AI citation rate compared to equivalent pages without it. The format that works: a “Question-Answer-Evidence” (QAE) structure where every answer stays under 100 words, making it easy for an LLM to chunk and synthesize without losing the core claim.

    Proactive third-party authority building. Elite-scoring brands don’t rely only on their own domains. They know AI models weight earned media more heavily than owned content. Perplexity in particular draws heavily from Reddit. A substantive mention in a trusted community can serve as a 2.1x multiplier for AI citation probability. Publishing original data matters too: unique statistics can boost AI visibility by up to 40%.

    Your Score Is a Snapshot. Your Strategy Needs More.

    Here’s the part most GEO score reports skip: a high score doesn’t guarantee you’re actually getting cited.

    The GEO score measures citability, meaning the content is formatted correctly for retrieval. Actual citations in AI answers depend on external authority, recency, and how your “information gain” compares to competitors at that specific moment. A brand can have an 85+ score and still see low citation rates if a rival has higher information density on the same topic.

    AI engines are also non-deterministic. The same prompt can produce different citations at different times. That’s why the score serves as a baseline, but real-time citation tracking is the strategy.

    Tracking your GEO score in isolation can also create a blind spot: your score might climb from 50 to 70, but if the industry average moves to 75 in the same window, you’ve lost relative ground while feeling like you improved. That’s the case for placing your score inside a competitive context.

    Topify’s competitor benchmarking tracks Share of Voice across ChatGPT, Gemini, and Perplexity, so you can see not just your absolute score, but how your citation frequency compares to the top brands in your category. The score tells you if you’re ready. The competitive data tells you if you’re winning.

    How to Close the Gap: A 3-Step Framework

    Step 1: Detect your current baseline. Start with a full technical audit using the Topify GEO Score Checker. Map where you sit against the industry benchmarks above. The audit should also surface a “Citation Gap Analysis” showing which prompts are sending users to competitors instead of you.

    Step 2: Restructure for retrieval. This is less about adding keywords, more about increasing factual density. Rewrite the opening 60–100 words of key pages to lead with a direct answer (BLUF optimization). Deploy FAQPage and Organization schema with sameAs links. Use sequential H2-H3-H4 heading structures to help AI engines understand your semantic hierarchy.

    Step 3: Track and iterate. AI citation data decays. Research suggests it drops to roughly 40% of its initial level within 90 days. That means a one-time optimization isn’t a strategy. Weekly monitoring of how content updates influence visibility across platforms, combined with ongoing prompt research, keeps you from falling back below your industry benchmark after a single algorithm shift.

    Conclusion

    Most brands are scoring somewhere between 40 and 60. That’s not a failure, it’s where the industry currently sits. But the gap between 54 and 75+ is real, and it’s not bridged by writing more. It’s bridged by structuring differently: tighter schema, BLUF formatting, FAQ content designed for extraction, and third-party authority signals that give AI engines a reason to trust your content over a competitor’s.

    The score is the starting line. Use the Topify GEO Score Checker to find your baseline, then move from static readiness into active citation tracking with Topify’s competitive benchmarking to see where you actually stand in your industry’s AI search landscape.

    FAQ

    Q: What is a good GEO score in 2026? 

    A: A score above 70 is considered good, meaning your site is well-optimized and likely to be cited by AI engines. A score above 85 is excellent and characteristic of brands that have systematically designed their content for AI retrieval.

    Q: How often should I check my GEO score? 

    A: At minimum, run a full audit monthly. High-priority pages should be reviewed weekly, since AI model updates and competitor content changes can shift citation patterns quickly. Citation data tends to decay significantly within 90 days of any optimization.

    Q: Does a high GEO score guarantee AI citation? 

    A: No. A high score means your content is formatted correctly for retrieval. Actual citations depend on external authority, content recency, and how your information compares to competitors on a given topic. Real-time tracking is required to measure actual citation performance.

    Q: Which industry has the lowest average GEO score? 

    A: Local services currently holds the lowest average (38–48), largely due to widespread lack of structured data and thin content that doesn’t provide the localized, verifiable signals AI engines need to confidently recommend a provider.

    Read More