The first thing most brands do when they hear about agentic SEO is type their own name into ChatGPT. That’s the wrong starting point.
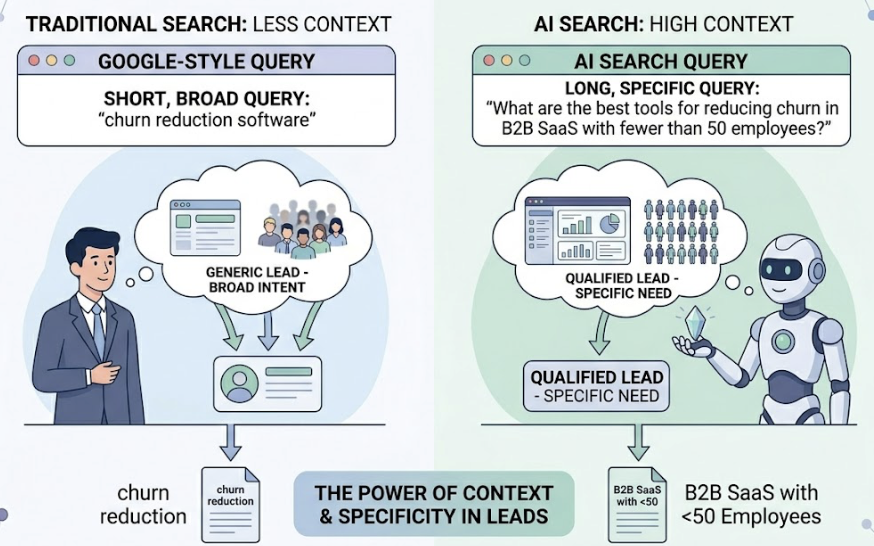
Searching your brand name tells you almost nothing about how you’re actually performing. The real question is: when a buyer prompts an AI agent with “what’s the best tool for [your category],” does your brand appear? And if it does, where does it rank, and how does the AI describe you?
Most brands have no idea. This guide walks through a repeatable, step-by-step process for building real visibility tracking across AI agents, so you stop guessing and start seeing the full picture.
Your Brand Might Already Be Invisible to AI Agents
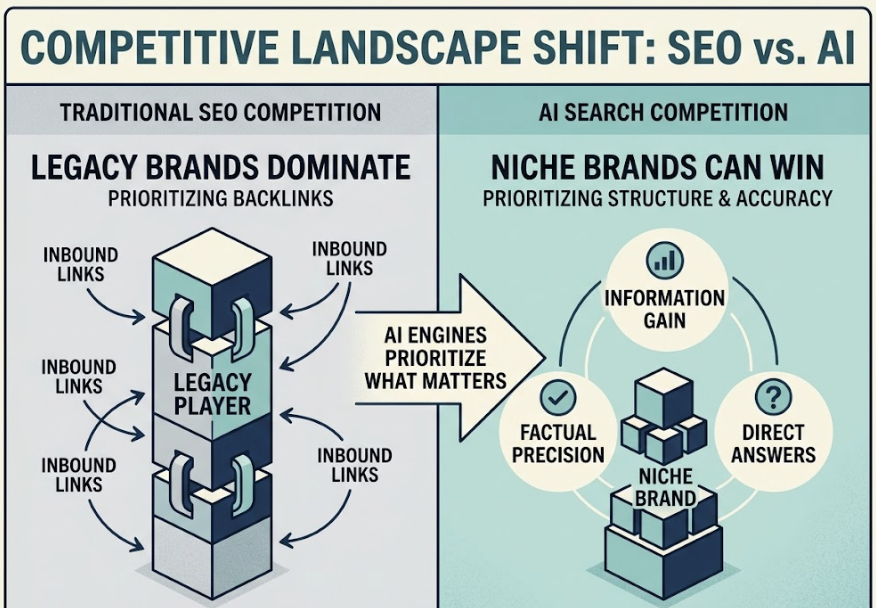
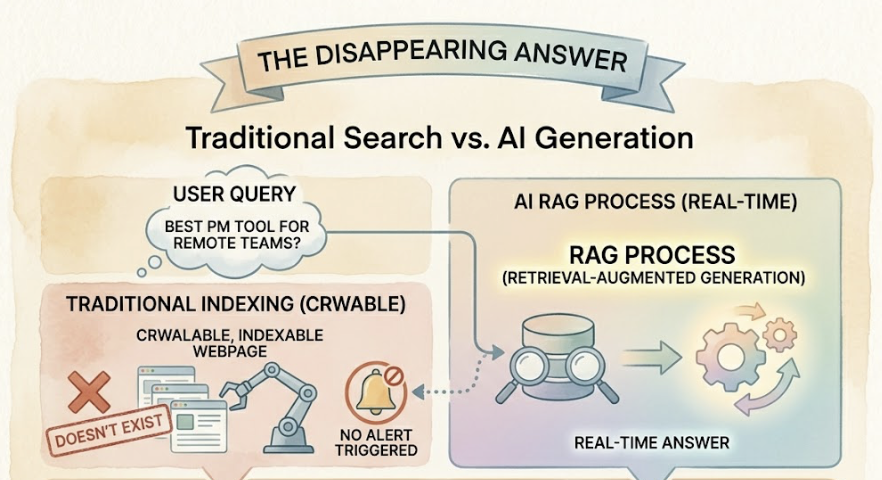
Traditional SEO tells you how you rank in a list of blue links. Agentic SEO asks a different question entirely.
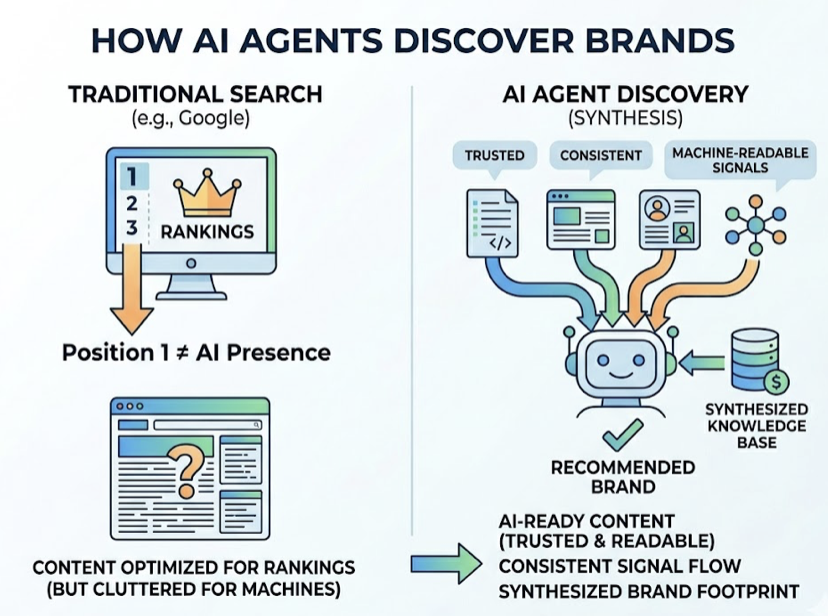
AI agents don’t pull from search rankings. They synthesize from trusted, consistent, machine-readable signals across a brand’s entire digital footprint. A brand can sit at position one in Google and still be absent from every AI-generated recommendation because the two systems operate on fundamentally different logic.
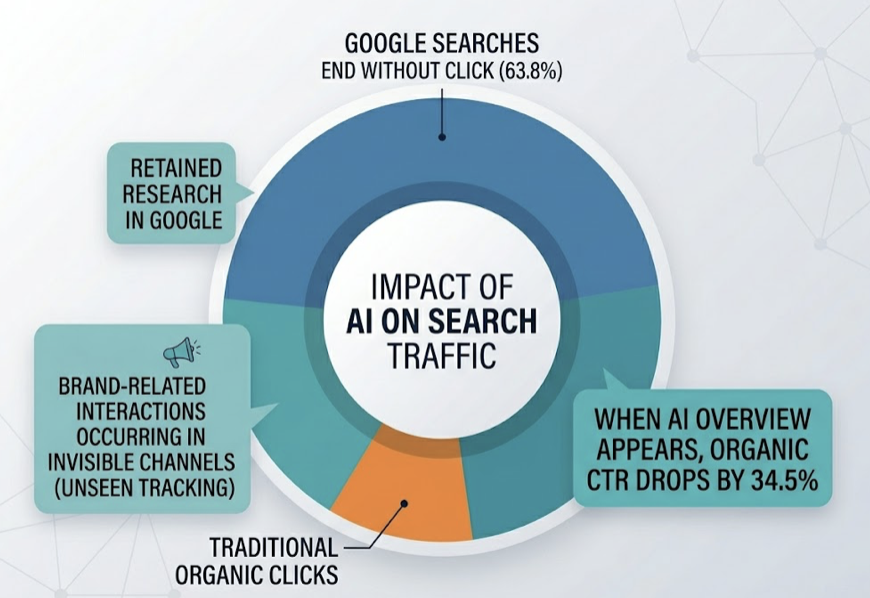
The gap is larger than most teams expect. Research shows AI models currently misrepresent 60% of brands, stating incorrect prices, discontinued features, or fabricated claims. Meanwhile, 93% of AI search sessions end without a website click, meaning the AI’s recommendation is the decision point, not a gateway to one.
That’s the problem agentic SEO tracking is built to close.
What “Tracking Visibility” Actually Means in Agentic SEO
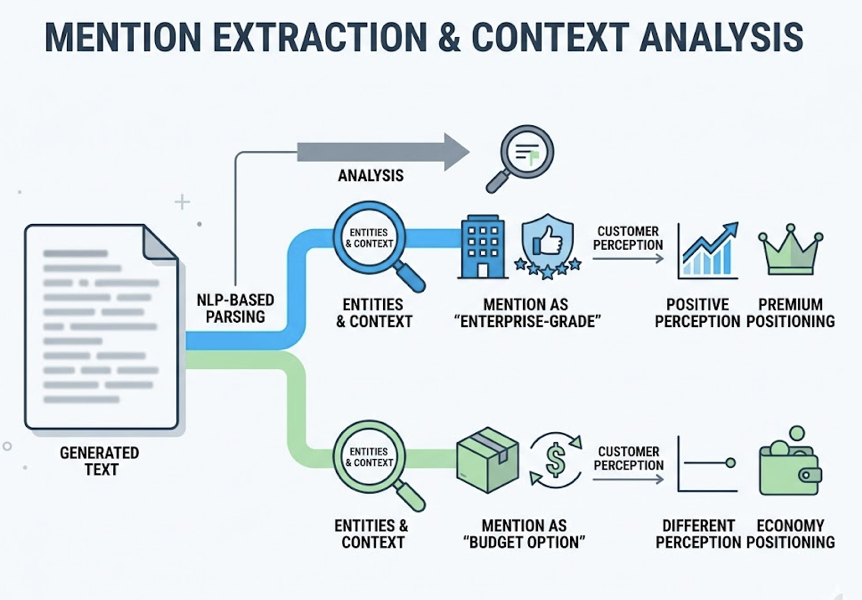
Brand tracking in agentic SEO isn’t a single metric. It’s a combination of three signals that need to be measured together: Visibility (whether you’re mentioned at all), Position (where you appear relative to competitors in the AI’s response), and Sentiment (how the AI characterizes your brand).
Tracking any one of these in isolation will mislead you. A brand mentioned frequently but always framed as “a budget option” has a sentiment problem that raw mention counts won’t reveal. A brand that ranks first for one prompt type and disappears for another has a coverage gap.
Here’s how agentic SEO metrics compare to what most marketing teams currently track:
| Dimension | Traditional SEO | Agentic SEO |
|---|---|---|
| Visibility signal | Keyword ranking position | Brand mention rate in AI responses |
| Quality signal | Click-through rate | Sentiment score + position in AI answer |
| Coverage | Search query rankings | Prompt type coverage across platforms |
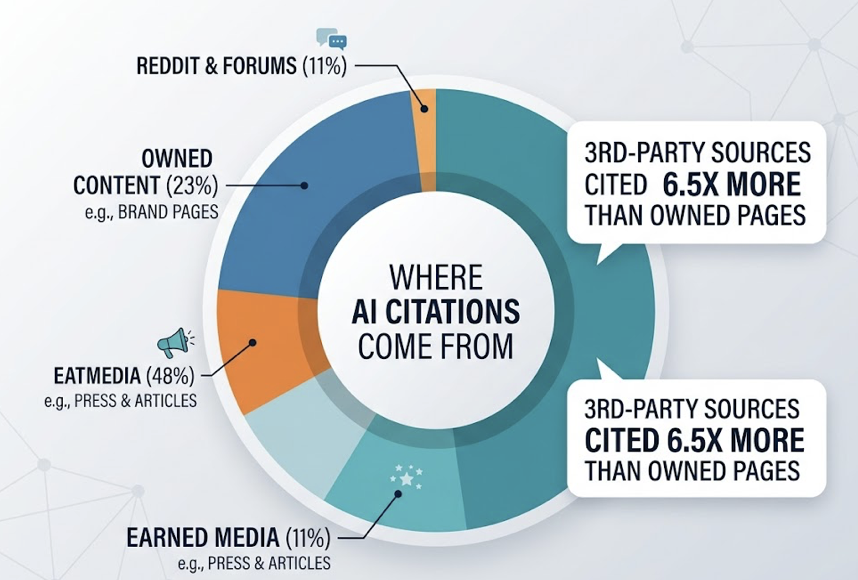
| Competitive data | SERP share | Citation share vs. competitors |
The stakes are real: 73% of B2B buyers now report trusting AI product recommendations over traditional advertisements. If a competitor is cited in 80% of AI responses and your brand appears in 20%, that’s not a ranking problem. That’s an eligibility gap.
Step 1: Map the AI Agents Your Audience Actually Uses
Not every AI platform serves the same audience. Start with platform-audience fit before building a tracking system.
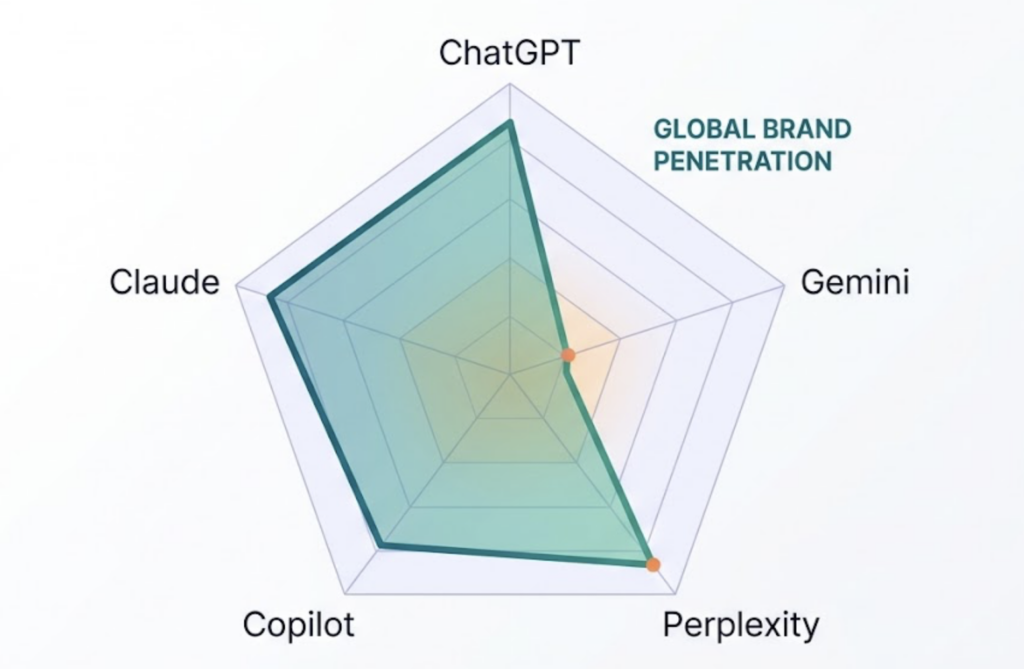
ChatGPT currently holds between 60% and 78% of the global generative AI market and drives 87.4% of all AI-related referral traffic, making it the default priority for most brands. But the picture is more nuanced by buyer type.
Perplexity AI skews toward research-intensive and technical queries, holding a stable 6-7% market share by focusing on high-accuracy citation. Google’s AI Overviews reach 2 billion monthly users, making it essential for any brand dependent on Google’s ecosystem. Microsoft Copilot has strong penetration in the 18-29 demographic through Office 365 integration.
Match platforms to your buyer profile before you track anything:
| Audience Type | Priority Platforms |
|---|---|
| B2B / Enterprise buyers | ChatGPT, Perplexity, Copilot |
| Consumer / General market | ChatGPT, Google AI Overviews |
| Research / Technical users | Perplexity, Claude |
| Global / Emerging markets | ChatGPT, Gemini |
Don’t try to track everywhere at once. Pick two or three platforms where your buyers are actually making decisions. Go deep on those before expanding.
Step 2: Build a Prompt Library That Mirrors Real Buyer Queries
AI agents respond to prompts, not keywords. The quality of your visibility tracking depends entirely on the quality of the prompts you’re testing against.
Your prompt library needs to cover three types of queries: category queries (“what’s the best tool for X”), comparison queries (“X vs. Y, which should I use”), and recommendation queries (“I need help with Z, what do you suggest”). Each type reveals a different dimension of how AI agents perceive your brand.
Here’s the thing: response variability makes low-volume tracking unreliable. Research by SparkToro found there’s less than a 1-in-100 chance that ChatGPT or Google’s AI will surface the same brand list in two consecutive responses to the same prompt. Every run produces slightly different outputs. You need enough data points to identify patterns, not noise.
The recommended minimum is 20-50 conversational queries, run across dozens of sessions, to identify what researchers call a “stable consideration set”: the brands that appear frequently enough to be treated as reliable options by the model. Below that threshold, you’re tracking randomness.
Topify‘s High-Value Prompt Discovery feature automates this step, continuously surfacing the prompts most likely to drive buyer decisions in your category, rather than relying on manual guesswork.
Step 3: Run Systematic Tracking Across Platforms
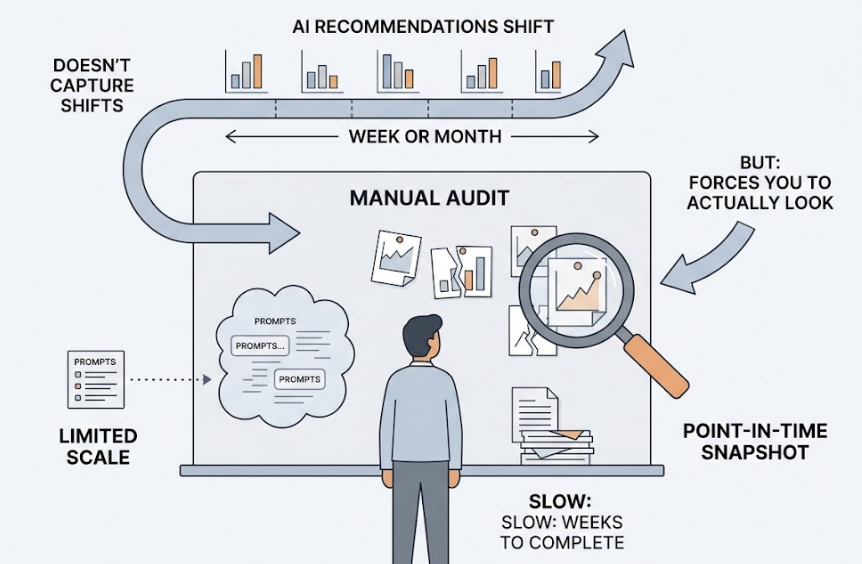
Once your prompt library is in place, tracking cadence becomes the next critical variable. AI model re-training cycles cause brands to be re-evaluated against fresh data, which means a brand that appeared consistently last month can drop out of recommendations this month without any change on your end.
Minimum tracking frequency: weekly. Monthly snapshots are already stale.
For each tracking run, record four dimensions per prompt: Was the brand mentioned? At what position relative to competitors? What was the sentiment framing (positive, neutral, cautious, or negative)? What sources did the AI cite to support its recommendation?
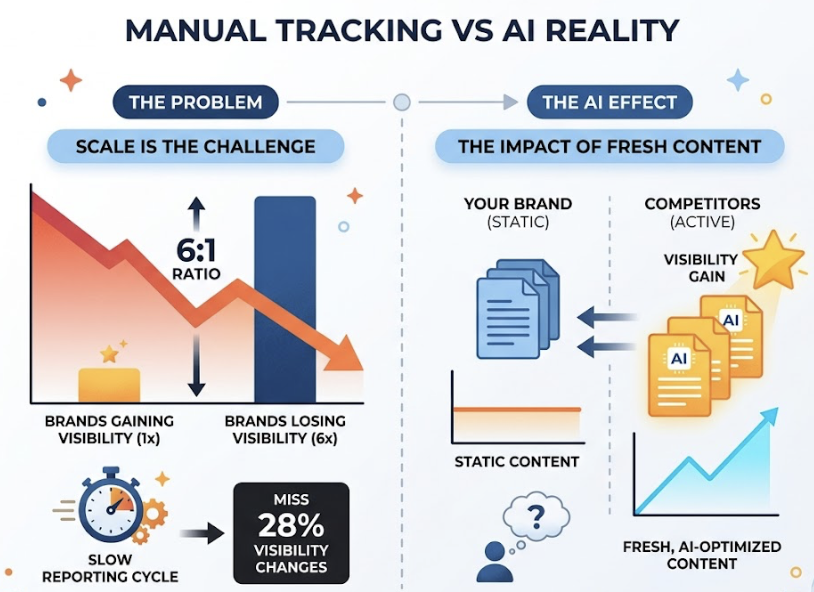
Manual tracking at this scale isn’t feasible. For every brand that gains AI visibility in a given week, six lose it: a 6:1 negative-to-positive ratio driven by competitors publishing fresh, AI-optimized content while a brand’s representation stays static. Businesses relying on manual methods miss an estimated 28% of visibility changes simply because the reporting cycle is too slow.
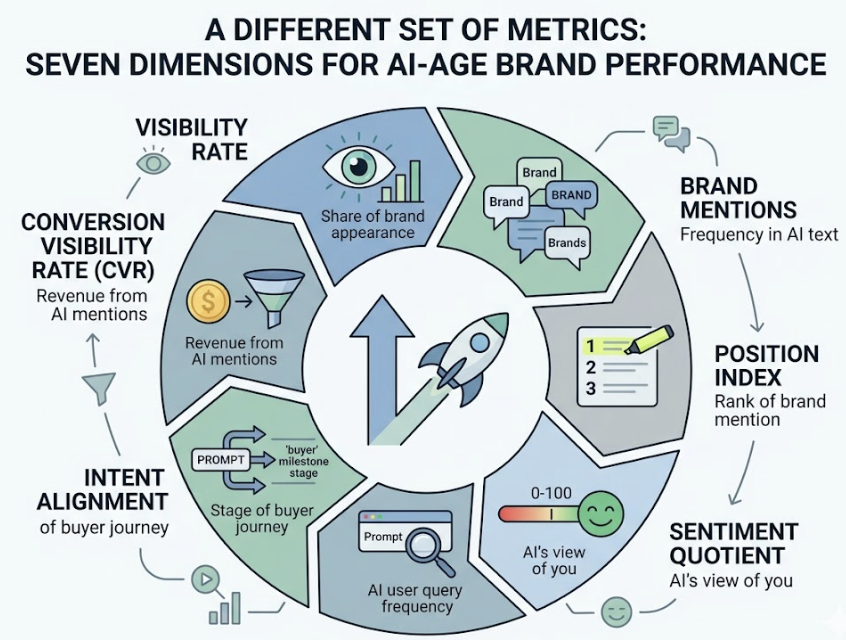
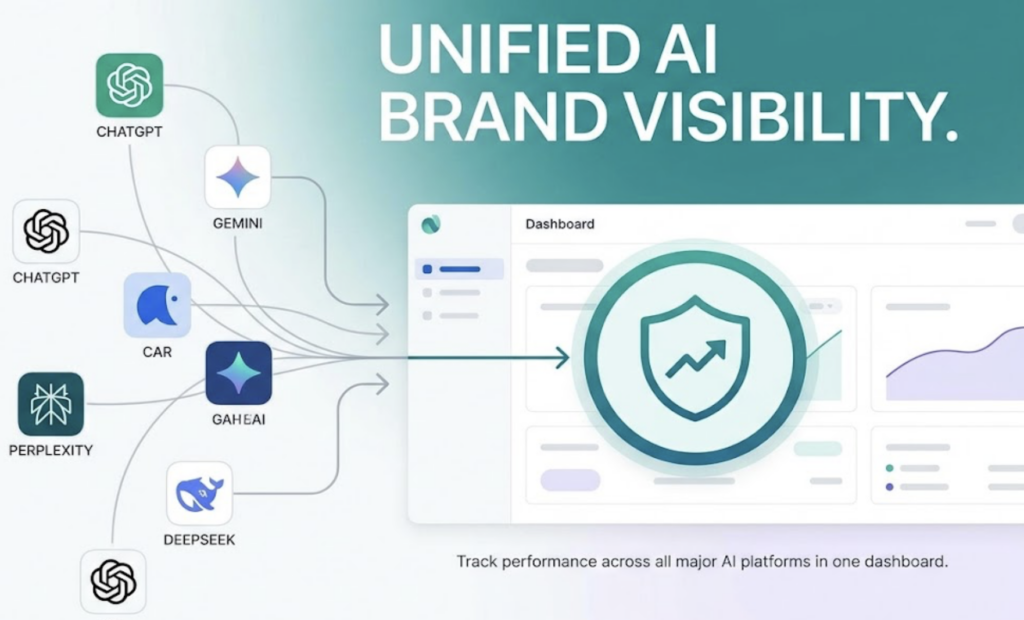
Topify‘s platform handles this automatically, tracking brand performance across ChatGPT, Gemini, Perplexity, DeepSeek, and other major platforms simultaneously, then generating seven standardized metrics per run: visibility, sentiment, position, volume, mentions, intent, and CVR. The Basic plan covers 100 prompts and 9,000 AI answer analyses per month, which is enough for most in-house teams to start building a reliable baseline.
Step 4: Read the Data, Then Act on It
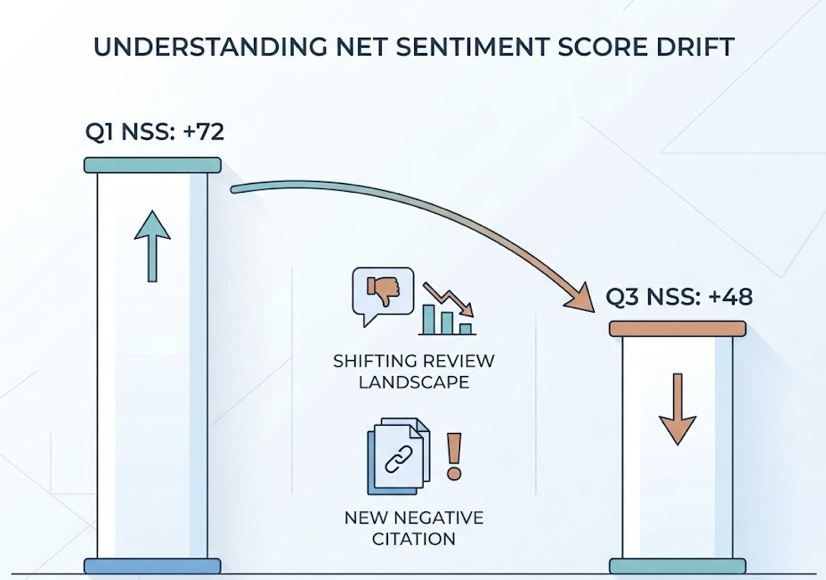
Raw tracking data has no value without a clear framework for interpreting it. The most structurally useful framework here is the Net Sentiment Score (NSS), which classifies AI mentions across five categories: Endorsement, Neutral, Cautious, Negative, and Hallucination.
The formula:
NSS = [(Endorsement + Neutral Mentions) − (Negative + Hallucination Mentions)] / Total Mentions × 100
| NSS Range | What It Means | What to Do |
|---|---|---|
| +60 to +100 | Strong positive positioning | Maintain signals; expand to adjacent categories |
| +20 to +59 | Net positive with gaps | Strengthen third-party credibility sources |
| −19 to +19 | Neutral or mixed | Address cautious or negative drivers immediately |
| −20 to −100 | Net negative | Remap your digital entity across authoritative sources |
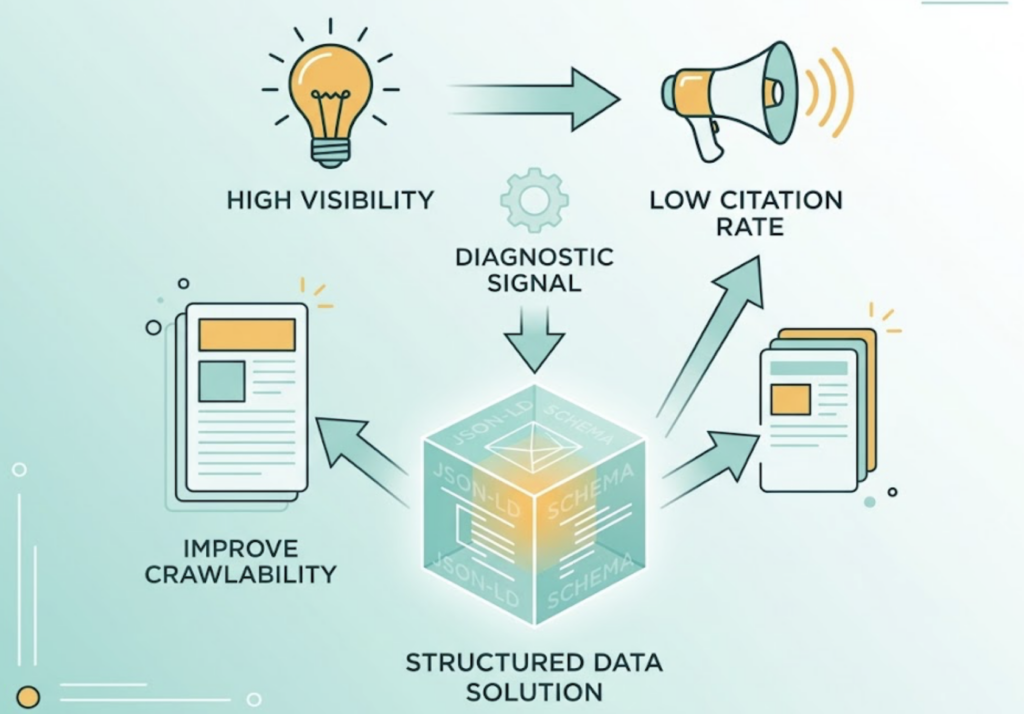
Each metric category points to a specific action. Low visibility means you’re absent from the AI’s consideration set — build topical coverage on the prompts where you’re missing. Low position means you’re mentioned but outranked — analyze which domains AI platforms are citing for higher-ranked competitors and close those content gaps. Negative or cautious sentiment typically signals inconsistent entity data across your website, directories, and third-party platforms.
Hallucinations are the most urgent issue. When AI models state incorrect facts about your brand — wrong pricing, discontinued features, fabricated capabilities — the fix requires proactive “entity remapping”: publishing clear, authoritative, machine-readable corrections across your entire digital footprint. Forty-seven percent of B2B purchase decisions now involve an AI research phase; a hallucinated fact at that stage costs you the deal before you ever knew you were competing for it.
Topify‘s Source Analysis feature shows exactly which domains AI platforms are citing when they respond to prompts in your category. Competitor Monitoring reveals the specific prompt types sending buyers to competitors instead of you, giving your team a clear list of gaps to close.
Data without action is just a dashboard.
3 Mistakes That Make Agentic SEO Tracking Useless
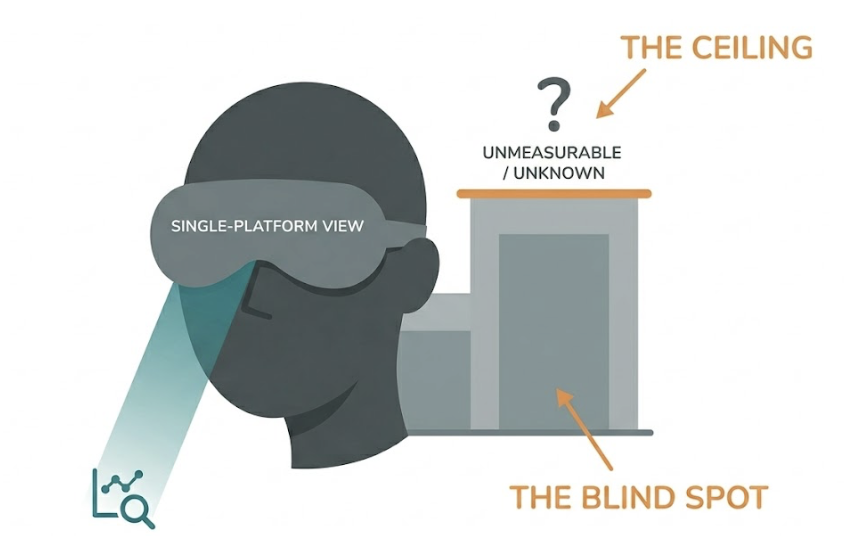
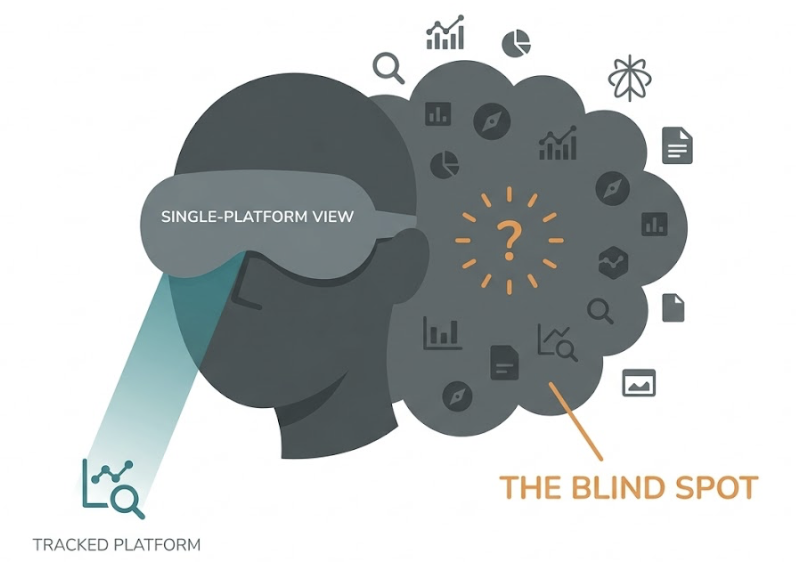
Tracking only one platform. ChatGPT dominates with 810 million daily users, but your buyers may be using Perplexity for technical research or encountering Google AI Overviews during category discovery. Single-platform tracking creates blind spots in exactly the prompt types where you’re most vulnerable.
Tracking too infrequently. Quarterly or monthly snapshot audits are already outdated by the time they’re reviewed. AI model updates re-evaluate every brand in the training corpus. The 6:1 ratio of brands losing visibility versus gaining it compounds quickly when tracking gaps let competitors pull ahead undetected.
Measuring mentions without context. Being mentioned fifth out of five with a “cautious” framing is worse than not being mentioned at all. It signals to the model that your brand exists in the consideration set but isn’t the safe choice. Visibility data without position and sentiment makes your tracking misleadingly positive and leads to the wrong optimization decisions.
Conclusion
Tracking your brand across AI agents follows a clear sequence: map the platforms your buyers use, build a prompt library that mirrors real purchase queries, run systematic weekly tracking, and act on what the NSS and citation data reveal.
The brands building this infrastructure now, before AI-driven discovery becomes the primary buyer research channel, will hold a compounding advantage over those still optimizing for traditional search rankings. Visibility in agentic SEO comes before optimization. And in the agentic era, being eligible is the new ranking factor.
Topify is built specifically for this workflow, tracking brand visibility, sentiment, position, and citation sources across the major AI platforms with automated reporting and one-click optimization execution. The Basic plan at $99/month covers 100 prompts and 9,000 AI answer analyses across ChatGPT, Perplexity, and AI Overviews.
FAQ
What’s the difference between Agentic SEO and GEO?
GEO (Generative Engine Optimization) refers to optimizing content to appear in AI-generated responses. Agentic SEO is broader: it covers the full continuous workflow of AI agents that sense, plan, and act, including tracking, optimization, execution, and performance monitoring. GEO is one component of an agentic SEO strategy.
How many prompts do I need for reliable visibility data?
Research points to 20-50 conversational queries as the minimum for a stable dataset. Below that threshold, response variability makes it difficult to distinguish real patterns from noise in the AI’s outputs.
Can small brands compete with large brands in AI agent recommendations?
Yes, and often more effectively. AI models prioritize entity consistency and topical depth over media budgets. A brand with clear, consistent, machine-readable information across its website, directories, and third-party sources will outperform a large brand with fragmented or contradictory messaging.
How often do AI agents change which brands they recommend?
Frequently. For every brand gaining AI visibility in a given week, six are losing ground. Model updates, competitive content, and query sensitivity all drive this volatility. Weekly tracking is the minimum cadence for catching changes before they compound.
What’s the fastest way to improve brand visibility in AI agents?
Fix entity consistency first. Ensure your brand name, description, pricing, and key claims match exactly across your website, Google Business Profile, industry directories, and review platforms. Cross-source consensus is how AI models determine which brands are “safe” to recommend. Inconsistency signals risk, and AI agents are trained to avoid risk.