Author: Elsa Ji

  • llms.txt: What It Is and How to Create One

    llms.txt: What It Is and How to Create One

    Your robots.txt tells crawlers what not to touch. Your sitemap tells indexers where everything lives. But neither one tells an AI model what your site is actually about, what it should prioritize, or how to represent your brand accurately in a generated answer.

    That’s the gap llms.txt was built to fill.

    The File Search Engines Never Needed, But AI Does

    Since 1994, robots.txt has been the standard handshake between websites and automated programs. Its logic is defensive: it defines what crawlers shouldn’t access. That was enough for the keyword-indexing era.

    Large language models work differently. Systems like ChatGPT, Perplexity, and Claude don’t just index pages. They read, synthesize, and generate answers, often from a limited context window where every token counts. A typical HTML page is packed with navigation menus, JavaScript, tracking scripts, and visual rendering logic that AI systems have to parse before reaching the actual content. That processing isn’t free.

    Token economics matter here. In a large language model, processing 1,000 tokens costs a fixed amount of compute. If 80% of a webpage is structural noise, the model spends 80% of its budget on content that doesn’t answer the user’s question. llms.txt solves this by offering a clean, pre-curated Markdown file that strips away everything except what’s essential.

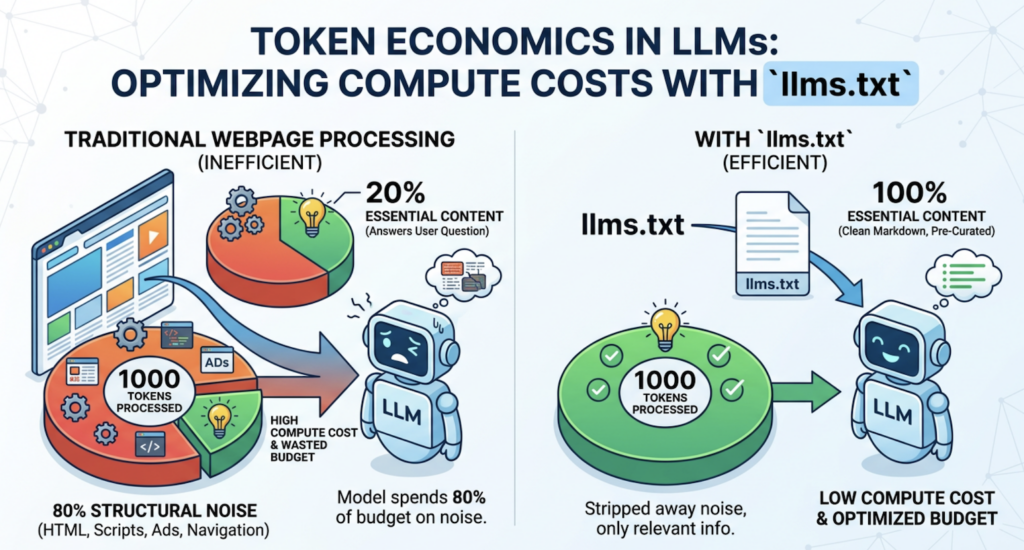
    The result: compared to raw HTML, llms.txt can reduce token consumption by over 90%.

    ProtocolCore LogicPrimary AudienceFormatPurpose
    robots.txtAccess controlSearch engine crawlersPlain text directives“Don’t crawl this”
    sitemap.xmlInventorySearch engine indexersXML URL list“Everything lives here”
    llms.txtContent guidanceLLMs, AI agents, RAG systemsStructured Markdown“Here’s what matters and why”

    What’s Actually Inside an llms.txt File

    llms.txt is a standard Markdown file placed at your root domain: yourdomain.com/llms.txt. The format was proposed by Jeremy Howard, co-founder of Answer.ai, in September 2024. It’s intentionally minimal.

    A well-structured file typically contains four elements:

    An H1 title with the project or brand name. This is the only required field.

    summary block, written as a Markdown blockquote (>), that gives the AI instant macro context about what the site does and who it serves.

    H2 sections that group links by category: core docs, product pages, policies, FAQs.

    Annotated link lists in the format - [Title](URL): short description. The description is the critical part. It lets the AI assess a page’s relevance without requesting the URL first.

    Here’s a clean example:

    # Acme Analytics
    
    > Acme Analytics helps B2B marketing teams track brand visibility across AI search platforms including ChatGPT, Gemini, and Perplexity.
    
    ## Product
    
    - [How It Works](https://acme.com/how-it-works): Overview of AI visibility tracking and competitor benchmarking features.
    - [Pricing](https://acme.com/pricing): Subscription plans for teams and agencies.
    
    ## Documentation
    
    - [Quick Start Guide](https://docs.acme.com/quickstart): Get your first AI visibility report in under 5 minutes.
    - [API Reference](https://docs.acme.com/api): Full endpoint documentation and authentication guide.
    
    ## Optional
    
    - [Changelog](https://acme.com/changelog): Historical product updates and feature releases.
    

    The ## Optional section signals lower priority. When an AI system is working within a strict token budget, it can skip this block without losing critical information.

    5 Reasons Your Site Needs an llms.txt Right Now

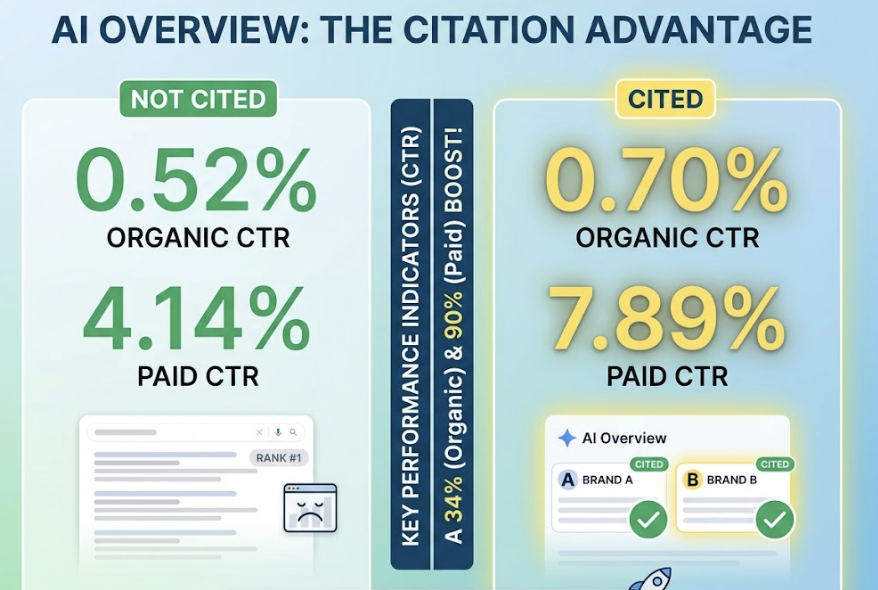
    1. AI citation systems favor structured sources.

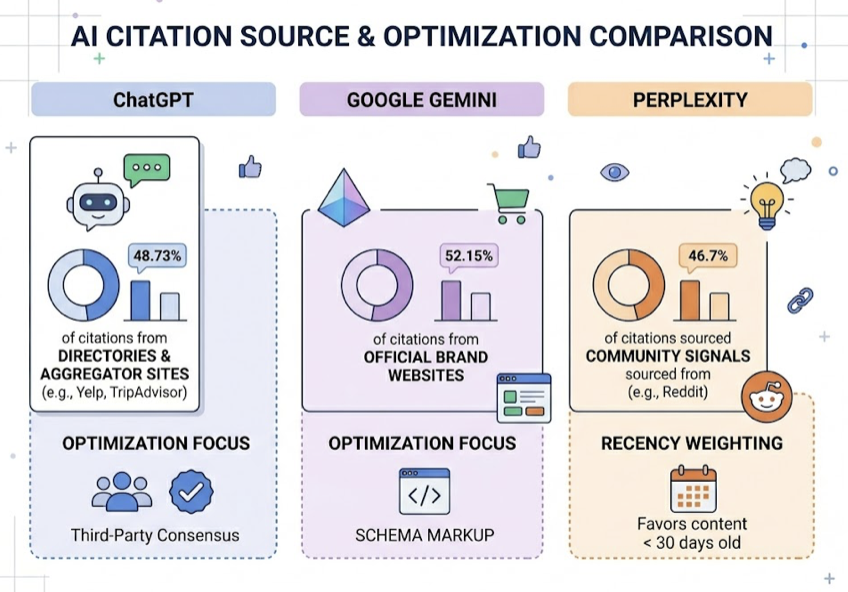
    When Perplexity or SearchGPT generates an answer, it runs a rapid source evaluation. Given two sites with comparable content, AI systems tend to reference whichever one has lower parsing friction. A clean llms.txt lowers that friction and raises your probability of being cited first.

    2. LLMs process Markdown hierarchy more reliably than HTML semantics.

    Models are significantly more responsive to Markdown heading hierarchy (H1, H2, H3) than to equivalent HTML tags like <section> and <article>. llms.txt exposes your site’s information architecture in the format LLMs actually prefer, reducing the chance that key product details get buried or misread.

    3. Early adopters are already seeing measurable gains.

    Technical companies like Stripe, Vercel, OpenAI, and Anthropic moved fast on this standard. A case study from dev5310, a technical agency, showed that after submitting llms.txt, Google’s AI Mode began treating it as an authoritative identity layer for the company, prioritizing structured details from the file in generated summaries. This is the kind of first-mover advantage that shrinks quickly once the practice becomes standard.

    4. llms.txt is a foundational GEO asset.

    Generative Engine Optimization (GEO) is less about keyword density and more about citation frequency and answer accuracy. llms.txt ensures that when AI systems reason about your brand, they’re starting from a curated, accurate source you control, rather than a patchwork of third-party mentions, outdated press coverage, and misread product pages.

    That distinction matters. AI hallucinations often originate from information gaps, not model failures.

    5. It gives you something measurable.

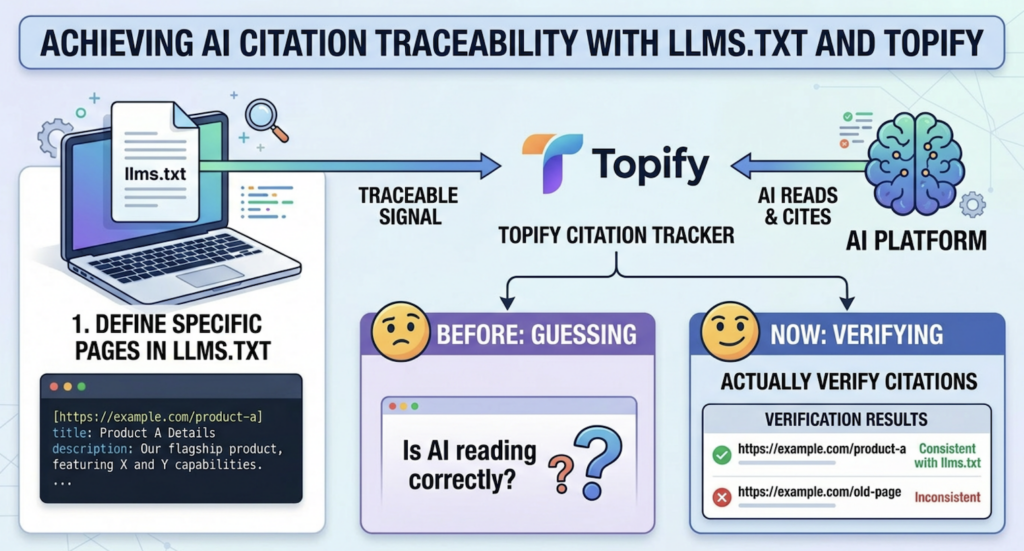
    When you define specific pages in llms.txt with structured descriptions, you create a traceable signal. Tools like Topifycan track which URLs AI platforms are citing and whether those citations align with the content you’ve surfaced through llms.txt. You go from guessing whether AI is reading your site correctly to actually verifying it.

    How to Create an llms.txt File: Step-by-Step

    Step 1: Identify Your Core Information Assets

    Don’t try to include everything. An overloaded llms.txt creates the same token-waste problem it was designed to solve.

    Focus on four categories:

    • Brand identity: who you are, what you do, who you serve
    • Product and pricing pages: anything that drives decisions
    • Key documentation: guides that reduce support load
    • Policy files: pricing, terms, security, and return policies, where accuracy in AI answers directly affects customer trust

    Step 2: Write in Standard Markdown Format

    Use absolute URLs, not relative paths. A link like /docs/quickstart will break when an AI system tries to resolve it without knowing your domain. Write https://yourdomain.com/docs/quickstart instead.

    Every link description should answer one question: why would the AI need this page? Be specific. “Overview of features” is weak. “Explains how the sentiment scoring algorithm works across 7 AI platforms” gives the model enough to decide if it’s relevant.

    Step 3: Place It at Your Root Directory

    The file must live at yourdomain.com/llms.txt. Most AI crawlers follow a standard scan pattern that checks the root first.

    If you run separate subdomains, such as docs.example.com, add a corresponding llms.txt to each root. The files can be different and should reflect the specific content scope of each subdomain.

    Step 4: Validate and Test

    Before publishing, run your file through a validator like Radarkit or Rankability to check formatting. After publishing, confirm it’s accessible via curl https://yourdomain.com/llms.txt and verify the HTTP status code is 200.

    Then do a live test. Ask ChatGPT, Perplexity, or Claude a question about your company’s product or documentation. If the model returns structured, accurate details that match your llms.txt content, it’s working. If it’s still pulling from stale third-party descriptions, you may need to add richer annotations or revisit the priority hierarchy in your file.

    llms.txt vs. llms-full.txt: Which One Do You Need?

    The original proposal from Jeremy Howard includes two formats. They serve fundamentally different use cases.

    Featurellms.txtllms-full.txt
    Primary roleStructured index (navigation)Complete content archive
    Typical file sizeUnder 10KBCan reach several MB
    AI handlingQuick scan, follows links on demandSingle-pass full read
    Best forReal-time AI search, brand discoveryDeveloper AI tools (Cursor, Copilot)
    Maintenance effortLow, update links as content changesHigh, requires full-content sync
    Token footprintMinimalSignificant

    For most marketing sites, SaaS landing pages, and product-focused domains: llms.txt alone is sufficient.

    For API-first companies, developer tool providers, and documentation-heavy platforms: both files are worth maintaining. llms.txt handles AI search discovery. llms-full.txt gives AI coding assistants the full context they need for deep technical work, without requiring multiple round trips to individual doc pages.

    The trade-off is maintenance. llms-full.txt requires you to sync actual content, not just links. If your documentation updates frequently, that overhead compounds quickly.

    After You Publish It, How Do You Know It’s Working?

    Publishing llms.txt is step one. Knowing whether it’s actually influencing AI behavior requires different tooling than traditional analytics.

    Standard tools like Google Analytics don’t capture LLM server-side requests. You won’t see GPTBot or PerplexityBot visits in most dashboards unless you’re actively parsing server logs for those user agents.

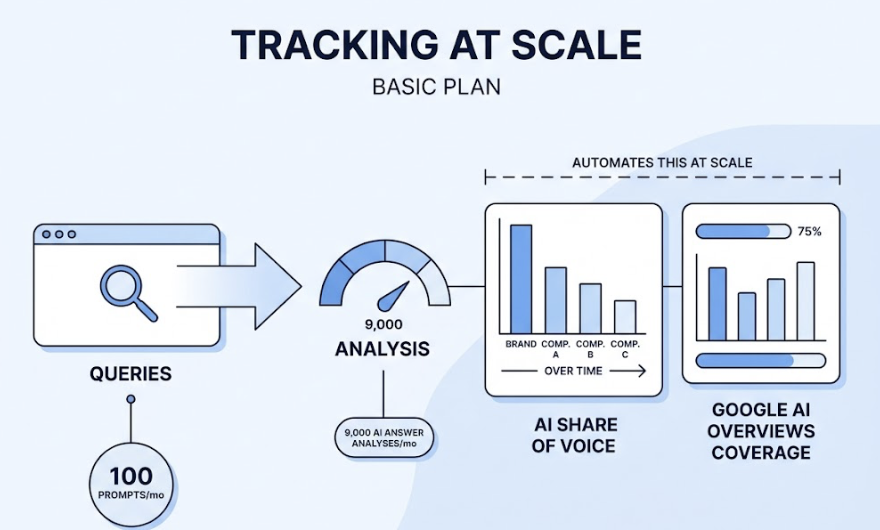
    What you’re actually trying to measure is citation behavior: which URLs AI platforms are referencing, in what order, and whether those citations match the content hierarchy you defined in your llms.txt.

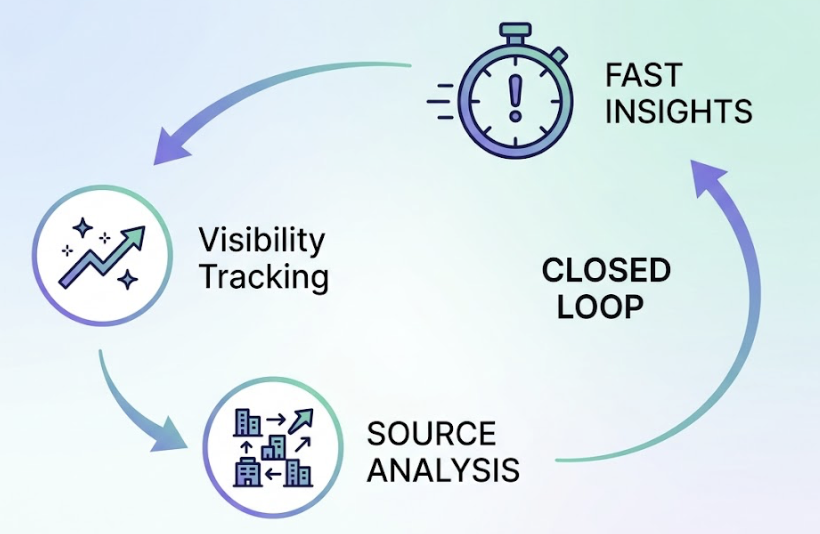
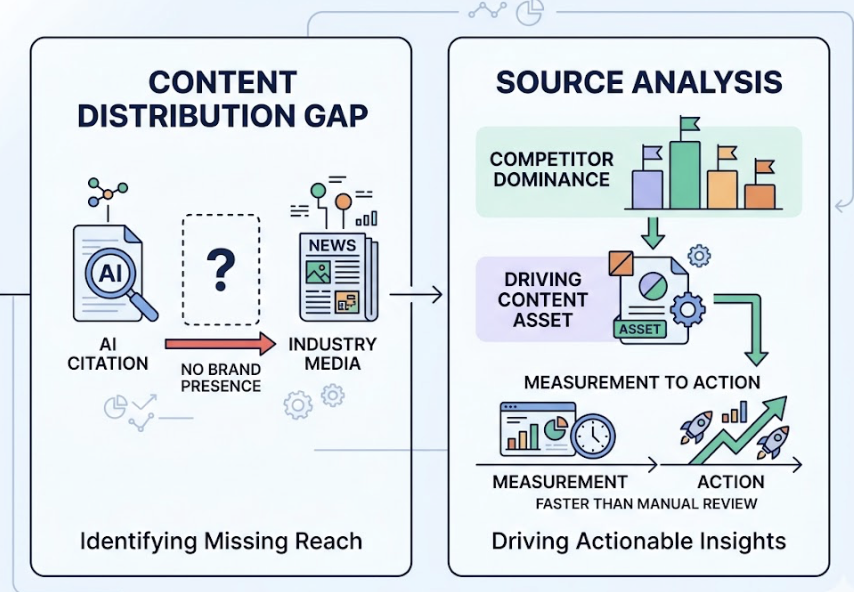
    Topify‘s Source Analysis feature tracks exactly this. It identifies the specific domains and URLs that AI platforms cite when answering questions in your category, and shows how citation patterns shift over time. If a competitor’s domain starts appearing more frequently in AI answers after a content update, that’s a signal. If a page you featured prominently in your llms.txt isn’t showing up in citations at all, that’s an optimization cue.

    Three metrics worth tracking after deployment:

    Share of AI Voice: the percentage of relevant AI-generated answers that mention your brand or cite your domain.

    Citation accuracy: whether AI descriptions of your product match the official positioning in your llms.txt, rather than older third-party summaries.

    Crawler activity: server log requests from GPTBot, OAI-SearchBot, PerplexityBot, and Claude-Web, particularly against your llms.txt endpoint. Frequency spikes often correlate with model updates or index refreshes.

    Treat this as an ongoing loop, not a one-time setup. Content changes, model behavior shifts, and citation patterns drift. A quarterly audit of your llms.txt, aligned to your major content releases, keeps the signal clean.

    Conclusion

    robots.txt told the internet what to block. llms.txt tells AI what to read first.

    The file itself is simple. What it represents isn’t: a deliberate shift from passive indexing to active AI navigation. For brands investing in GEO, it’s one of the highest-leverage steps you can take without touching your core content. You’re not rewriting pages; you’re giving AI the curator’s guide to what already exists.

    The companies that’ll have the clearest AI presence twelve months from now are the ones building that infrastructure today, not waiting for it to become a requirement.

    Start with your ten most important pages. Write clean descriptions. Ship the file. Then track whether AI citations actually reflect what you intended.


    FAQ

    Q: Is llms.txt an official web standard?

    A: Not yet. It hasn’t been ratified as an RFC by the IETF. It’s best described as a community consensus protocol. That said, the fact that Anthropic, OpenAI, Stripe, and Vercel have all deployed it on their own domains gives it significant de facto authority. Adoption is accelerating faster than formal standardization typically moves.

    Q: Do ChatGPT and Perplexity actually read llms.txt?

    A: Evidence from server log analysis and published case studies suggests yes, at least for high-authority or frequently queried domains. AI crawlers like GPTBot and PerplexityBot have been observed making direct requests to yourdomain.com/llms.txt as part of their retrieval optimization routines. This behavior isn’t guaranteed for every site, but it’s consistent enough that early implementation carries real upside with minimal downside.

    Q: How often should I update my llms.txt?

    A: Sync updates with your major content cycles. Any time pricing, product features, core team, or key documentation changes, update your llms.txt the same day. For everything else, a quarterly review is a reasonable baseline. Stale descriptions are one of the primary causes of AI-generated content misrepresenting a brand’s current positioning.

    Q: Does llms.txt affect traditional SEO rankings?

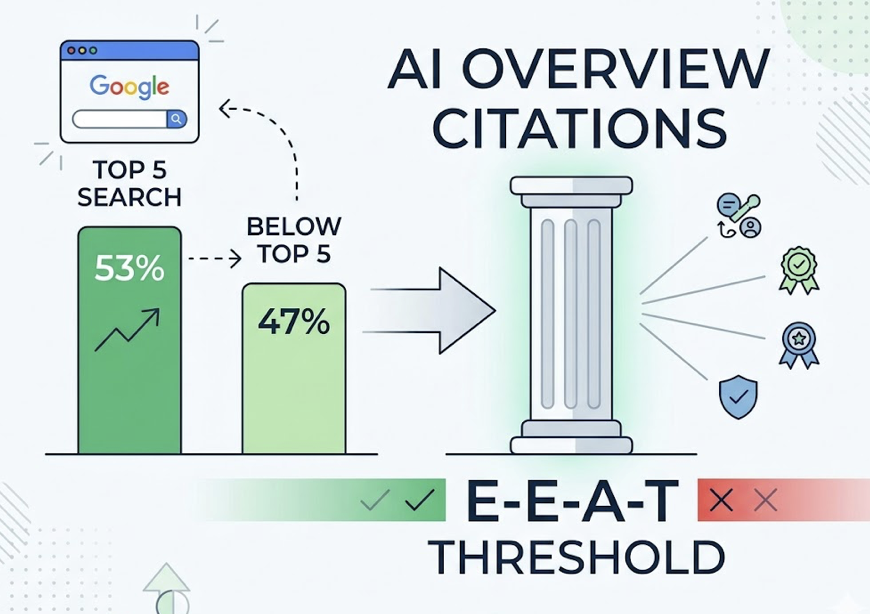
    A: There’s no evidence that Google’s core ranking algorithm treats llms.txt as a direct ranking signal. That said, better-structured entity signals can improve how search engines understand site architecture and topical authority over time. The more meaningful impact is on AI-generated search surfaces like Google AI Overviews, where structured, machine-readable context tends to get prioritized over raw HTML content.


    Read More

  • How to Get Your Brand Into Google AI Overviews

    How to Get Your Brand Into Google AI Overviews

    Your organic rankings didn’t drop. Your content didn’t get penalized. But your traffic is down double digits anyway.

    That’s the AI Overviews effect. Google now generates a synthesized summary above every organic result for over 50% of informational searches. If your brand isn’t in that summary, users never scroll far enough to find you.

    The fix isn’t guessing. It’s a three-step process: track where you stand, find the content gap, and engineer content that AI can actually cite.


    Your Rankings Didn’t Drop. Google Just Built a Wall Above Them.

    The numbers are stark. For queries where AI Overviews appear, organic click-through rates have collapsed from 1.76% to 0.61% between June 2024 and September 2025 — a 62.3% decline. Paid search CTR dropped 51.4% over the same period.

    What makes this unusual is the decoupling. Rankings hold steady. Traffic doesn’t.

    Google calls it a “satisfaction gap.” The AI summary answers the user’s question well enough that they stop scrolling. No click needed. Your page never gets visited.

    The second-order insight matters more, though. Brands cited inside the AI Overview don’t just survive — they outperform. Cited brands see 0.70% organic CTR versus 0.52% for non-cited brands, and the paid CTR gap is even wider: 7.89% versus 4.14%. Being in the summary is worth more than being ranked #1 below it.

    On mobile — which drives roughly two-thirds of all search volume — an expanded AI Overview can occupy the entire visible screen. First place in organic sits below the fold. First place in the summary sits at the top of the world.


    What Google AI Overviews Actually Pull From

    Most SEOs assume AI Overviews work like Featured Snippets: find the best-ranked page, pull a paragraph. That’s not what’s happening.

    Featured Snippets are link-retrieval systems. One page, one extract, one query. AI Overviews use multi-source synthesis. Google’s AI reads multiple trusted sources and generates a combined narrative — it doesn’t just lift text, it interprets and recombines it.

    In 2025, Google formalized this with the MUVERA framework (Multi-Vector Retrieval Analysis). Instead of compressing a query into a single vector, MUVERA runs a two-stage pipeline: broad retrieval first, then semantic re-ranking at the passage level. It looks for content organized into modular, self-contained blocks — not long-form narratives.

    The practical consequence: only 32% of URLs cited in AI-generated answers match the traditional top-10 organic results. Domain authority and backlinks still matter, but they’re no longer the deciding factor for citation. Structural clarity and content modularity are.

    The Domains Google Keeps Citing

    Analysis of 46 million citations across 36 million AI Overviews reveals a concentration problem for brands. Wikipedia (11.22%), YouTube (9.51%), Reddit (5.82%), and Google’s own properties (5.62%) dominate the citation landscape. That’s roughly 43% of all AI citations flowing back to Google’s ecosystem or a handful of mega-platforms.

    Reddit’s surge is particularly revealing — citation frequency jumped 450% between March and June 2025. Google is treating community-driven discussion as a stronger “experience” signal than polished brand pages. That has real implications for where your optimization dollars should go.


    Step 1: Find Out If Your Brand Appears in Google AI Overviews

    Before optimizing anything, you need a baseline. Most brands skip this step and optimize blind.

    Start manually. Run your brand name paired with industry-specific question queries — the kind of language a customer uses during research, not purchase. “Best [category] for [use case].” “How does [product type] work.” “What’s the difference between X and Y.” These are the query patterns most likely to trigger AI Overviews.

    Note three things: whether an AI Overview appears, whether your brand is mentioned in it, and which competitors are cited instead.

    Manual testing gives you a reality check. It doesn’t give you a trend.

    Scale It with a Tracking Tool

    The non-deterministic nature of AI Overviews is the problem. Google generates summaries in real time. Results shift by user, session, and query variation. A single manual check tells you what happened once. It tells you nothing about whether things are getting better or worse.

    Topify‘s Visibility Tracking automates this at scale. The Basic plan ($99/month) supports 100 prompts and 9,000 AI answer analyses per month — enough to track a meaningful cross-section of the queries your customers actually use, including Google AI Overviews coverage. You get an AI Share of Voice metric that benchmarks your brand frequency against top competitors over time, not just a snapshot.

    That shift from “I checked once” to “I can see a 90-day trend” is what makes optimization decisions defensible.


    Step 2: Identify the Content Gaps Keeping You Out

    Once you know your brand isn’t being cited — or isn’t being cited often enough — the next question is why.

    Source Analysis answers it. The logic: if Google is citing Competitor A and not you on the same query, there’s something in Competitor A’s content that signals citability to the AI. Your job is to identify what that is.

    Common gaps fall into three categories. First, structural gaps: your content is written as flowing prose, not modular blocks. MUVERA’s passage-level indexing rewards self-contained sections that answer a specific sub-question within the first 100 words. Second, evidence gaps: your content makes claims without data. AI systems prioritize fact-backed content with clear sourcing. Third, E-E-A-T gaps: no author byline, no credentials, no first-hand experience signals. Google’s 2025 Quality Rater Guidelines put “Experience” as the primary differentiator — a product review with original screenshots outranks a polished summary without them.

    Topify’s Source Analysis surfaces the exact domains and content types Google is pulling from in your niche. If the AI is citing Reddit threads, the gap is community presence. If it’s citing structured guides, the gap is content architecture.

    What “AI-Citable Content” Looks Like

    61% of AI Overviews use unordered lists. 22% use short factual paragraphs. Ordered lists account for 12%. Data tables, while rare at around 5%, are highly citable for pricing and comparison content.

    The pattern is clear: AI doesn’t favor long-form storytelling. It favors structured information that can be extracted without interpretation.


    Step 3: Build Content Google AI Overviews Will Actually Quote

    The framework for AI-citable content is Answer Engine Optimization (AEO). Here’s what it looks like in practice.

    The 100-Word Answer Block. Every key section should open with an 80–100 word direct answer to the implied question of that heading. Write the conclusion first. The AI looks for the “TL;DR” it can lift without reading the rest of the section.

    Question-format headings. Rewrite H2 and H3 headings to mirror natural language queries. “How does [product] reduce cost?” performs better than “Cost Reduction Benefits.” MUVERA’s semantic matching favors headings that align with how users actually phrase their questions.

    Data as authority signals. AI systems treat statistics and cited research as trust indicators. Every key claim should carry a number or a source. Proprietary data — original research, internal test results, first-hand case studies — is particularly valuable because it offers something Wikipedia and Reddit don’t.

    How to Optimize Existing Pages for AI Overviews SEO

    You don’t need to rebuild your site. Targeted edits to top-performing pages produce faster results.

    Start with FAQ and HowTo schema markup. FAQ Schema maps question-and-answer pairs directly in a format AI can parse without interpretation. HowTo Schema signals procedural content structure. Organization Schema helps AI correctly identify your brand as a distinct entity — headquarters, social links, founders — which improves citation consistency across queries.

    Internal linking also matters. Pages that sit within a clear pillar-cluster hierarchy signal content modularity to the crawler. A standalone blog post is harder for MUVERA to contextualize than one that belongs to a structured topic cluster.

    Off-page optimization rounds it out. Getting your brand cited in industry publications, forums, and niche outlets that Google already trusts creates the “off-page AEO” layer that no amount of on-site schema can replicate.


    The Mistake Most Brands Make: Optimizing Without Tracking

    Here’s the failure mode. A team audits their content, restructures three key pages, adds FAQ schema, and waits. Three months later, traffic is flat. Nobody knows if AI Overviews shifted, if the pages got cited, or if the optimization even landed.

    Without tracking, optimization is guesswork with extra steps.

    The feedback loop that makes AI Overviews optimization work is: set a prompt corpus → track citation frequency → detect changes → iterate. That loop requires automation because AI responses vary by session and can drift over weeks without any single obvious signal.

    Topify closes that loop. Visibility Tracking shows you whether your citation frequency is trending up or down across your tracked prompts. Source Analysis shows whether the domains Google is citing in your niche have changed — sometimes a competitor publishes a piece of original research that suddenly displaces your page. You want to know that the week it happens, not the quarter after.

    The Basic plan covers 100 prompts and 9,000 AI answer analyses monthly. For teams managing a focused set of high-value queries, that’s enough to run a systematic optimization program rather than a periodic audit.

    AI-referred traffic converts at approximately 2.3x the rate of traditional organic traffic. The ROI case for systematic tracking is straightforward.


    Conclusion

    The brands winning Google AI Overviews aren’t doing anything exotic. They tracked where they stood. They found the content gap between them and the cited sources. They restructured pages to answer questions directly, in a format AI can extract.

    That’s it. Track. Find the gap. Optimize the structure.

    What doesn’t work: assuming that organic ranking translates to AI citation, or that a one-time content audit is enough. AI Overviews are non-deterministic — they shift as Google updates its models, as competitors publish new content, and as query patterns evolve. Monitoring has to be ongoing.

    If you’re starting from zero, the clearest first step is understanding where your brand currently stands across the prompts your customers are actually typing. Topify’s Basic plan gets you that data for $99/month — and it gives you the source analysis to understand not just whether you’re missing, but why.


    FAQ

    What triggers Google AI Overviews to appear? 

    AI Overviews appear most often for complex informational queries, multi-step explanations, and comparison-based searches. Conversational, longer queries trigger them far more reliably than short keyword searches.

    How is AI Overviews optimization different from traditional SEO? 

    Traditional SEO targets keyword density, backlinks, and domain authority to rank links. AI Overviews optimization focuses on modular content structure, semantic clarity, schema markup, and expert attribution — signals that help AI extract and cite your content.

    Can small brands appear in Google AI Overviews? 

    Yes. 80% of sources cited in AI Overviews don’t rank in the top 3 organically, and 47% rank outside the top 10. Structured, expert-led content can outperform much larger competitors on citation frequency.

    How do I know if Google AI Overviews are hurting my traffic? 

    Monitor Google Search Console for keywords where impressions stay stable but CTR drops. A widening impression-to-click gap on informational queries is a reliable signal that an AI Overview is intercepting traffic before it reaches your listing.

    What content types are most likely to be cited in AI Overviews? 

    Unordered lists (61% of AIOs), short factual paragraphs under 100 words (22%), and ordered lists for sequential processes (12%). Data tables and FAQ sections are particularly citable due to their structured, extractable format.


    Read More

  • Answer Engine Optimization: What It Is and Why Now

    Answer Engine Optimization: What It Is and Why Now

    You’re ranking number one on Google. Your content team spent months on it. Your backlink profile is clean.

    And ChatGPT has never mentioned your brand once.

    That’s not a fringe scenario. It’s where a growing share of marketing budgets are quietly disappearing, and most teams don’t realize it until the traffic numbers start telling a different story.

    Your Google Rank and Your AI Rank Are Two Different Things

    Traditional SEO is built on crawling, indexing, and link authority. AI search is built on semantic reasoning, entity recognition, and consensus-based synthesis. These are not the same thing, and the gap between them is measurable.

    A study comparing Google rankings with ChatGPT mentions found that brands on Google’s first page appeared in ChatGPT answers only 62% of the time. That’s a nearly 40% failure rate for the brands that “won” traditional search. The rank correlation between a brand’s Google position and its order of mention in an AI response sits at roughly 0.034, which is effectively zero.

    The divergence gets more stark when you look at commercial queries. Research by Profound on “Best men’s running shoes” found only an 8% overlap between Google’s top results and ChatGPT’s cited sources, with a negative correlation of -0.98. The more an AI favored a URL, the less likely it was to rank highly on Google. The reason: Google prefers direct brand pages; AI engines lean toward deep editorial reviews with high information density.

    This isn’t a temporary gap. It’s structural.

    Platform / Metric20242025Change
    ChatGPT Weekly Active Users400M900M+2.25x
    Perplexity Monthly Queries230M780M+3.39x
    AI Search Market Share~5%12-15%~2.5x
    Google Market Share>90%89.74%First drop below 90% in a decade

    And the user behavior shift compounds this. In 2025, zero-click searches reached 58.5% in the US, rising to 83% when Google AI Overviews were active. For brands, that means the AI answer itself is the ad. There’s no click to fall back on.

    What Answer Engine Optimization Actually Means

    Answer Engine Optimization (AEO) is the discipline of structuring and positioning a brand’s digital content so AI platforms can understand, trust, and cite it as a definitive answer to specific user questions.

    The goal isn’t traffic to a URL. It’s becoming the source the AI quotes.

    AEO vs SEO: Not a Replacement, an Additional Layer

    SEO establishes whether your content can be found and indexed. AEO determines whether it gets extracted and used once an AI agent finds it. Both matter, but they require different execution.

    AEO and GEO (Generative Engine Optimization) are often used interchangeably. The practical distinction: GEO focuses on long-term citability within the conversational narratives of LLMs like ChatGPT and Claude; AEO focuses specifically on “answer-first” features like Google AI Overviews and Perplexity’s instant answers, where a single snippet satisfies the user’s query without a second click.

    FeatureTraditional SEOAEO / GEO
    Primary GoalClicks to websiteCitations and brand mentions
    Success MetricSERP Ranking (1-10)Citation Frequency and Share of Voice
    MechanismBacklinks and keywordsSemantic structure and authority signals
    User JourneyDiscovery → Click → SiteDiscovery → Answer (zero-click)

    Brands that ignore the AEO layer can rank on page one of Google and still lose the buyer to a competitor whose content is structured for AI extraction.

    Which Platforms Count as “Answer Engines”

    The answer layer of the internet has diversified fast. It now includes ChatGPT (900M+ weekly active users), Perplexity (favored by B2B researchers for its transparent citation model), Google AI Overviews (reaching 2 billion monthly users), Gemini, Claude, and Microsoft Copilot.

    Each platform uses a different retrieval and citation logic. A strategy that only optimizes for one is already leaving coverage gaps.

    4 Signals That Decide If AI Recommends Your Brand

    AI engines don’t pick sources randomly. They evaluate content based on four signals that indicate relevance, authority, and what practitioners call “extractability.”

    1. Structured Content. Technical structure often outweighs content depth. FAQ sections are cited 3.2 times more frequently than the same information in paragraph form. About 44% of all LLM citations are pulled from the first 30% of a page. An “inverted pyramid” structure, where the direct answer comes first and context follows, is a core AEO tactic.

    2. Citation Sources. Brands are 6.5 times more likely to be cited by an AI through a third-party source than through their own website. Brand mentions correlate with AI visibility at 0.664. Backlinks, the traditional SEO gold standard, correlate at only 0.218. Reddit threads, Wikipedia, industry publications, and G2 reviews are stronger predictors of AI visibility than most link-building campaigns.

    3. Brand Authority Signals. AI models evaluate brand entities, not just individual pages. Consistency and “validation density” across multiple credible sources saying the same things about your features, pricing, and positioning build entity authority. Fragmented or conflicting information across subdomains actively undermines it.

    4. Prompt Coverage. AI users don’t search for keywords; they ask layered questions. Google and other AI systems use “query fan-out,” breaking a single prompt into multiple sub-queries. A search for “best accounting software for freelancers” generates simultaneous sub-queries like “freelancer accounting tools,” “Xero vs Quickbooks for freelancers,” and “best accounting software 2026.” AEO requires content that addresses the primary question and the inevitable fan-out queries that follow.

    The Gap Most AEO Audits Miss

    Most AEO audits stop at one binary question: Is the brand mentioned or not?

    That’s the wrong question.

    A brand can appear in 50% of relevant AI responses and still be losing to a competitor that appears in 30% of responses, if that competitor is always listed first and described favorably. Position and sentiment are what convert visibility into business value.

    Position matters. A brand mentioned as the “top recommendation” receives substantially more trust than one referenced as a secondary alternative in the same response. Measuring “Answer Placement Score” (APS), which weights earlier mentions more heavily (first = 1.0, middle = 0.6, end = 0.3), gives a more accurate picture of competitive prominence than raw mention rate.

    Sentiment matters more than most teams expect. AI engines don’t just list brands; they describe them. If training data or retrieved sources include hedging language (“popular but lacks enterprise support”) or common complaints, the citation can actively damage brand perception. Sentiment drift across AI platforms is a reputation risk that traditional brand monitoring tools aren’t designed to catch.

    This is where Topify’s Visibility Tracking and Source Analysis address a gap that simpler audits miss. Instead of flagging whether a brand appears, Topify identifies the specific domains that are shaping the AI’s understanding of that brand: which Reddit threads, which comparison sites, which editorial reviews the model treats as authoritative. If a competitor is being cited in a “top 10” list the AI uses to formulate its answer, that specific URL shows up as a content gap, not a vague recommendation to “create more content.” That’s the difference between monitoring and actionable intelligence.

    Audit MetricDefinitionAEO Impact
    Citation Rate% of prompts where brand is mentionedFoundational baseline
    Share of VoiceMentions relative to competitorsCompetitive benchmarking
    Answer Placement ScoreWeighted score by mention order“Top recommendation” status
    Sentiment PolarityTone of AI descriptionReputation and narrative risk

    How to Start Building an AEO Strategy

    AEO isn’t a one-time content refresh. It’s an ongoing tracking and iteration cycle, because roughly 40-60% of AI-cited sources rotate monthly.

    Step 1: Audit your current AI presence across real buyer questions. Don’t just search your brand name. Search for the solutions you provide. Run 20-50 high-value buyer questions (“What’s the best [category] tool for [use case]?”) across ChatGPT, Perplexity, Gemini, and Google AI Overviews. This reveals your AI Inclusion Rate and surfaces exactly which competitors own your category in LLM responses.

    Step 2: Identify which sources AI is pulling from, not just whether you appear. Source analysis tells you what information the AI trusts about your space. If it’s citing a three-year-old blog post or a specific subreddit to describe your product category, that’s the pool you need to influence. Compare those cited sources against your own content: Is your content too sales-heavy? Does it lack direct, scannable data that AI agents can extract? That gap is your roadmap.

    Step 3: Fix content structure and build third-party authority. Restructure high-traffic pages with TL;DR summaries at the start of each section and headings formatted as natural-language questions. Deploy FAQPage and HowTo schema, which increase citation likelihood by 40-42%. Semantic URLs with descriptive slugs generate 11.4% more citations than generic ones. On the authority side, get subject matter experts quoted in cited publications and engage actively in relevant Reddit communities to create fresh, positive signals in the AI retrieval pool.

    Then track. Re-run your core prompt set weekly or monthly, because the AI answer landscape moves faster than most content calendars.

    FAQ

    Q: Is AEO the same as GEO? 

    Not exactly. AEO focuses specifically on “answer-first” features like Google AI Overviews and Perplexity’s direct answers. GEO covers the broader challenge of being cited within the conversational narratives of LLMs. In practice, the strategies overlap significantly, and most teams treat them as part of the same discipline.

    Q: Does AEO work for small brands? 

    Often yes. AI engines favor topical depth and expert accuracy over raw domain authority. A small business with the most comprehensive, direct answer to a niche question can outperform larger brands that produce generic or sales-heavy content. The playing field is less skewed by budget than traditional SEO.

    Q: How long does it take to see results from AEO? 

    Technical signals like schema validation show up quickly. Most sites with a solid content foundation see initial citations and ranking shifts within 4-8 weeks. Consistent, meaningful visibility across multiple AI platforms typically takes 3-6 months as models build confidence in the brand’s authority.

    Q: What’s the first metric I should track? 

    AI Citation Rate: the percentage of relevant industry queries where your brand is cited as a source. Track it alongside Share of Voice to understand how you’re performing relative to direct competitors, not just in isolation.

    Conclusion

    Search is splitting into two parallel systems. Traditional search returns a list; AI search returns an answer. Brands optimizing only for the first system are invisible in the second.

    AEO is the discipline that bridges that gap. It’s not about abandoning what works in SEO. It’s about adding a layer that ensures the content you’ve already built can be understood, trusted, and cited by the AI systems that are increasingly intercepting your buyers before they ever reach a search results page.

    In a zero-click economy, the most valuable digital real estate isn’t a high-ranking link. It’s being the source the AI chooses to quote.

    Read More

  • Answer Engines: Why Google Rankings No Longer Tell the Full Story

    Answer Engines: Why Google Rankings No Longer Tell the Full Story

    Your Google rankings haven’t moved. Your content is still on page one. But somewhere in the last year, the traffic started quietly disappearing.

    This isn’t a penalty. It’s not a core update. It’s something more structural: the way people search is changing, and Google rankings are no longer the only thing that decides whether your brand gets found.

    Answer engines are now the first stop for millions of buyers. And most brands have no idea where they stand on them.


    Search Engines Return Links. Answer Engines Return Decisions.

    For two decades, search worked the same way. A user typed a query, Google returned ten links, and the user decided where to click. The search engine was a referee, not a participant.

    Answer engines changed that contract entirely.

    When someone asks ChatGPT “what’s the best project management software for a remote team,” they don’t get ten links. They get a recommendation, a rationale, and sometimes a comparison table. The AI has already done the research. The decision is largely made before the user visits any website.

    This shift has a measurable cost. Zero-click searches now account for 69% of all queries. For informational queries with Google AI Overviews, that number hits 83%. Organic click-through rates for queries where AI summaries appear have dropped from 1.76% to 0.61%, a 65% decline. Paid CTR in the same conditions has crashed by 68%.

    The click-through economy isn’t dying slowly. It’s already in a different shape.


    ChatGPT, Perplexity, Gemini: They’re All Answer Engines Now

    The answer engine category isn’t one platform. It’s a fragmented ecosystem, and each player operates differently.

    ChatGPT dominates B2B research. As of 2026, 47% of B2B buyers prefer it for vendor discovery. Its citations skew heavily toward high-authority domains: Wikipedia accounts for 47.9% of its top citations, and domains with trust scores between 97-100 average 8.4 citations versus just 1.6 for lower-trust domains. Authority is the primary gate.

    Perplexity operates on freshness and community validation. Reddit accounts for 46.7% of its top citations. Content that hasn’t been updated in 30 days loses visibility rapidly. It applies what researchers call “time decay” aggressively. If you’re not refreshing your content, Perplexity is quietly deprioritizing it.

    Google AI Overviews sits in its own category. It’s still tied to the Google index, but not in the way you’d expect. While 92% of AI Overviews link to at least one top-10 result, 43.5% of cited sources come from domains outside the top 100. E-E-A-T functions as a binary gatekeeper here: 96% of citations come from sources with strong authority signals.

    Three platforms. Three different selection logics. One shared outcome: your keyword ranking is not the deciding factor.


    Why Your Google Rankings Don’t Carry Over

    Here’s the number that reframes everything: only 12% of AI citations overlap with Google’s top 10 results.

    That means 88% of what AI engines recommend comes from somewhere outside traditional SEO’s line of sight.

    The reason is architectural. Traditional search engines use inverted indices and keyword matching. Answer engines use Retrieval-Augmented Generation (RAG) and semantic vector search. A user’s prompt gets converted into a numeric vector, which is then compared against indexed content in multi-dimensional semantic space. The engine isn’t looking for keyword matches. It’s looking for semantic proximity.

    What gets retrieved isn’t a page. It’s a passage.

    A 3,000-word blog post optimized for dwell time may perform well on Google. But if the core answer is buried in paragraph twelve, the RAG system skips it. It needs extractable, fact-dense chunks in the first third of the content, where 44% of AI citations are pulled from.

    Ranking SignalTraditional SEOAnswer Engine (AEO)
    Backlink VolumeHigh weightModerate (entity mentions matter more)
    Keyword DensityModerateLow (vector similarity, not word count)
    Content LengthHigh (long-form)Low (atomic passages preferred)
    Schema MarkupOptionalMission critical
    Social ProofLowHigh (Reddit, G2 heavily cited)

    The optimization target has changed. SEO was about ranking pages. AEO is about being extractable.


    What Actually Gets a Brand Cited in AI Answers

    The content that earns AI citations shares a consistent set of structural properties. Research on high-performing AEO content points to what some practitioners call the CITABLE framework.

    Answer first. Every piece of content should open with a 2-3 sentence summary that names the brand and states the core answer directly. This isn’t just a stylistic choice: 44% of citations are pulled from the first third of a page. If your answer isn’t there, it won’t be extracted.

    Block-structured for RAG. Content broken into atomic chunks of 150-300 words, with clear H2/H3 headings, bulleted lists, and HTML tables, is significantly easier for RAG pipelines to ingest. Long narrative sections read well for humans but get skipped by machines looking for extractable facts.

    Third-party validation. AI models often trust external platforms more than brand-owned sites. Presence on review platforms like G2 or Trustpilot correlates with 4.6-6.3 citations on average, compared to 1.8 for brands without that presence. Reddit, Wikipedia, and industry publications all function as trust signals.

    Schema markup. Implementing Organization, Product, and FAQ schema is no longer optional. Schema creates the translation layer that helps AI systems identify entities and their relationships, increasing the chance of appearing in AI summaries by 36%.

    Fresh content. Perplexity’s time decay is aggressive, but freshness matters across all platforms. Content that hasn’t been updated loses ground, especially in fast-moving categories.

    The underlying principle: write for a machine that’s looking for evidence, not a human that’s looking for a story.


    Brands Already Winning in Answer Engines

    Early AEO case studies share a common pattern: the brands winning in AI search treat it as a distinct channel with its own KPIs, not a byproduct of SEO.

    Mentimeter, a B2B presentation SaaS, optimized for 555 informational keywords within AI Overviews and generated 124,000 ChatGPT sessions and 3,400 conversions in a single month. Their strategy focused on creating how-to content that AI could summarize cleanly, turning the brand into the go-to reference for collaborative software queries.

    An industrial applications provider focused on entity authority over backlink volume, achieving an 84% reference rate in Google AI Overviews and an 82% mention rate in ChatGPT for its core product categories. The result: $90 million in influenced pipeline and $20 million in revenue directly attributed to AI-generated discovery.

    A B2B SaaS firm grew AI-referred trials from 575 to over 3,500 per month, a 6x increase in seven weeks, by fixing broken schema, publishing 66 AEO-optimized articles, and seeding helpful comments on Reddit threads that Perplexity and ChatGPT already cited.

    That last point is worth sitting with. Reddit comments became a growth lever. Not because Reddit is special, but because the AI platforms trusted it. AEO strategy follows the trust logic of the platform, not the assumptions of traditional marketing.


    How to Measure Your Answer Engine Visibility

    This is where most brands hit a wall.

    Traditional SEO tools like Ahrefs and Google Search Console track rankings and clicks. They can’t tell you whether ChatGPT mentioned your brand when a buyer asked a comparison question yesterday. That data doesn’t exist in the standard analytics stack.

    Answer engine visibility requires a different set of metrics entirely.

    AI Mention Rate measures how often your brand appears across a tracked set of AI prompts. It’s the rough equivalent of impressions, but inside the model’s output rather than the SERP.

    Share of Voice (AI SOV) measures your brand mentions as a percentage of total category mentions across all AI recommendations. This is the metric that predicts competitive position in the answer economy.

    Sentiment Score tracks how AI systems describe your brand. Being mentioned as a “reliable option” is different from being mentioned with outdated pricing or incorrect feature claims. Hallucinations are a real risk.

    Citation Rate measures how often AI answers include a link to your domain. A brand can be mentioned without being cited. Citations drive qualified referral traffic; mentions alone don’t.

    Tools like Topify are built specifically for this tracking challenge, monitoring brand visibility across ChatGPT, Perplexity, Gemini, and other major AI platforms. One feature worth noting is the ability to surface “Dark Queries”: high-intent conversational prompts with zero search volume in Google but significant activity inside AI platforms. These are the questions your buyers are already asking that you can’t see in Search Console.

    The brands that get ahead in answer engines aren’t necessarily the ones with the best content today. They’re the ones who know where they stand and can see where the gaps are.

    Conclusion

    The shift from search to answers isn’t about one algorithm update. It’s a structural change in how buyers start their research, how they form opinions, and how they make decisions.

    Google rankings still matter. But they’re no longer the full picture. If an AI engine doesn’t include your brand when a buyer asks a category question, you’re invisible at the moment that matters most, regardless of where you rank on the SERP.

    The brands closing that gap are the ones treating AI visibility as a measurable, manageable channel: tracking their mention rate, auditing their content structure, and building the kind of authoritative presence that machines trust.

    The Invisibility Gap is real. The question is whether your brand is on the right side of it.


    FAQ

    What is answer engine optimization (AEO)? 

    AEO is the practice of structuring digital content to be extracted, cited, and recommended by AI-powered answer engines like ChatGPT, Perplexity, and Google AI Overviews. It prioritizes machine synthesizability, entity clarity, and passage-level extractability over traditional keyword ranking.

    What’s the difference between AEO and SEO? 

    SEO focuses on ranking pages to drive clicks from search results. AEO focuses on being included in a synthesized AI answer, often in a zero-click environment. SEO relies on backlinks and keyword density; AEO relies on semantic structure, schema markup, and third-party validation. Both matter, but they require different content strategies.

    How do I get cited in ChatGPT or Perplexity? 

    For ChatGPT, domain authority is the primary lever: referring domains above 2,500, presence on Wikipedia and high-trust platforms, and answer-first content structure. For Perplexity, freshness matters as much as authority: content should be updated at least every 30 days, and presence on Reddit and community platforms significantly boosts citation probability.

    Does Google ranking still matter? 

    Yes, but it’s no longer sufficient on its own. While 92% of AI Overviews cite at least one top-10 result, 43.5% of cited sources come from outside the top 100. A page can rank #1 on Google and still be bypassed by AI systems if it lacks E-E-A-T signals or machine-readable structure. The goal is to optimize for both.

    How do I know if my brand is being recommended by AI? 

    Standard analytics tools don’t track AI mentions. You’ll need a dedicated GEO monitoring platform to track your AI mention rate, share of voice, sentiment, and citation rate across platforms. This data is what separates brands that know their AI visibility from those that are guessing.


    Read More

  • How to Get Your Brand Into Google AI Overviews

    How to Get Your Brand Into Google AI Overviews

    Your organic rankings didn’t drop. Your content didn’t get penalized. But your traffic is down double digits anyway.

    That’s the AI Overviews effect. Google now generates a synthesized summary above every organic result for over 50% of informational searches. If your brand isn’t in that summary, users never scroll far enough to find you.

    The fix isn’t guessing. It’s a three-step process: track where you stand, find the content gap, and engineer content that AI can actually cite.


    Your Rankings Didn’t Drop. Google Just Built a Wall Above Them.

    The numbers are stark. For queries where AI Overviews appear, organic click-through rates have collapsed from 1.76% to 0.61% between June 2024 and September 2025 — a 62.3% decline. Paid search CTR dropped 51.4% over the same period.

    What makes this unusual is the decoupling. Rankings hold steady. Traffic doesn’t.

    Google calls it a “satisfaction gap.” The AI summary answers the user’s question well enough that they stop scrolling. No click needed. Your page never gets visited.

    The second-order insight matters more, though. Brands cited inside the AI Overview don’t just survive — they outperform. Cited brands see 0.70% organic CTR versus 0.52% for non-cited brands, and the paid CTR gap is even wider: 7.89% versus 4.14%. Being in the summary is worth more than being ranked #1 below it.

    On mobile — which drives roughly two-thirds of all search volume — an expanded AI Overview can occupy the entire visible screen. First place in organic sits below the fold. First place in the summary sits at the top of the world.


    What Google AI Overviews Actually Pull From

    Most SEOs assume AI Overviews work like Featured Snippets: find the best-ranked page, pull a paragraph. That’s not what’s happening.

    Featured Snippets are link-retrieval systems. One page, one extract, one query. AI Overviews use multi-source synthesis. Google’s AI reads multiple trusted sources and generates a combined narrative — it doesn’t just lift text, it interprets and recombines it.

    In 2025, Google formalized this with the MUVERA framework (Multi-Vector Retrieval Analysis). Instead of compressing a query into a single vector, MUVERA runs a two-stage pipeline: broad retrieval first, then semantic re-ranking at the passage level. It looks for content organized into modular, self-contained blocks — not long-form narratives.

    The practical consequence: only 32% of URLs cited in AI-generated answers match the traditional top-10 organic results. Domain authority and backlinks still matter, but they’re no longer the deciding factor for citation. Structural clarity and content modularity are.

    The Domains Google Keeps Citing

    Analysis of 46 million citations across 36 million AI Overviews reveals a concentration problem for brands. Wikipedia (11.22%), YouTube (9.51%), Reddit (5.82%), and Google’s own properties (5.62%) dominate the citation landscape. That’s roughly 43% of all AI citations flowing back to Google’s ecosystem or a handful of mega-platforms.

    Reddit’s surge is particularly revealing — citation frequency jumped 450% between March and June 2025. Google is treating community-driven discussion as a stronger “experience” signal than polished brand pages. That has real implications for where your optimization dollars should go.


    Step 1: Find Out If Your Brand Appears in Google AI Overviews

    Before optimizing anything, you need a baseline. Most brands skip this step and optimize blind.

    Start manually. Run your brand name paired with industry-specific question queries — the kind of language a customer uses during research, not purchase. “Best [category] for [use case].” “How does [product type] work.” “What’s the difference between X and Y.” These are the query patterns most likely to trigger AI Overviews.

    Note three things: whether an AI Overview appears, whether your brand is mentioned in it, and which competitors are cited instead.

    Manual testing gives you a reality check. It doesn’t give you a trend.

    Scale It with a Tracking Tool

    The non-deterministic nature of AI Overviews is the problem. Google generates summaries in real time. Results shift by user, session, and query variation. A single manual check tells you what happened once. It tells you nothing about whether things are getting better or worse.

    Topify‘s Visibility Tracking automates this at scale. The Basic plan ($99/month) supports 100 prompts and 9,000 AI answer analyses per month — enough to track a meaningful cross-section of the queries your customers actually use, including Google AI Overviews coverage. You get an AI Share of Voice metric that benchmarks your brand frequency against top competitors over time, not just a snapshot.

    That shift from “I checked once” to “I can see a 90-day trend” is what makes optimization decisions defensible.


    Step 2: Identify the Content Gaps Keeping You Out

    Once you know your brand isn’t being cited — or isn’t being cited often enough — the next question is why.

    Source Analysis answers it. The logic: if Google is citing Competitor A and not you on the same query, there’s something in Competitor A’s content that signals citability to the AI. Your job is to identify what that is.

    Common gaps fall into three categories. First, structural gaps: your content is written as flowing prose, not modular blocks. MUVERA’s passage-level indexing rewards self-contained sections that answer a specific sub-question within the first 100 words. Second, evidence gaps: your content makes claims without data. AI systems prioritize fact-backed content with clear sourcing. Third, E-E-A-T gaps: no author byline, no credentials, no first-hand experience signals. Google’s 2025 Quality Rater Guidelines put “Experience” as the primary differentiator — a product review with original screenshots outranks a polished summary without them.

    Topify’s Source Analysis surfaces the exact domains and content types Google is pulling from in your niche. If the AI is citing Reddit threads, the gap is community presence. If it’s citing structured guides, the gap is content architecture.

    What “AI-Citable Content” Looks Like

    61% of AI Overviews use unordered lists. 22% use short factual paragraphs. Ordered lists account for 12%. Data tables, while rare at around 5%, are highly citable for pricing and comparison content.

    The pattern is clear: AI doesn’t favor long-form storytelling. It favors structured information that can be extracted without interpretation.


    Step 3: Build Content Google AI Overviews Will Actually Quote

    The framework for AI-citable content is Answer Engine Optimization (AEO). Here’s what it looks like in practice.

    The 100-Word Answer Block. Every key section should open with an 80–100 word direct answer to the implied question of that heading. Write the conclusion first. The AI looks for the “TL;DR” it can lift without reading the rest of the section.

    Question-format headings. Rewrite H2 and H3 headings to mirror natural language queries. “How does [product] reduce cost?” performs better than “Cost Reduction Benefits.” MUVERA’s semantic matching favors headings that align with how users actually phrase their questions.

    Data as authority signals. AI systems treat statistics and cited research as trust indicators. Every key claim should carry a number or a source. Proprietary data — original research, internal test results, first-hand case studies — is particularly valuable because it offers something Wikipedia and Reddit don’t.

    How to Optimize Existing Pages for AI Overviews SEO

    You don’t need to rebuild your site. Targeted edits to top-performing pages produce faster results.

    Start with FAQ and HowTo schema markup. FAQ Schema maps question-and-answer pairs directly in a format AI can parse without interpretation. HowTo Schema signals procedural content structure. Organization Schema helps AI correctly identify your brand as a distinct entity — headquarters, social links, founders — which improves citation consistency across queries.

    Internal linking also matters. Pages that sit within a clear pillar-cluster hierarchy signal content modularity to the crawler. A standalone blog post is harder for MUVERA to contextualize than one that belongs to a structured topic cluster.

    Off-page optimization rounds it out. Getting your brand cited in industry publications, forums, and niche outlets that Google already trusts creates the “off-page AEO” layer that no amount of on-site schema can replicate.


    The Mistake Most Brands Make: Optimizing Without Tracking

    Here’s the failure mode. A team audits their content, restructures three key pages, adds FAQ schema, and waits. Three months later, traffic is flat. Nobody knows if AI Overviews shifted, if the pages got cited, or if the optimization even landed.

    Without tracking, optimization is guesswork with extra steps.

    The feedback loop that makes AI Overviews optimization work is: set a prompt corpus → track citation frequency → detect changes → iterate. That loop requires automation because AI responses vary by session and can drift over weeks without any single obvious signal.

    Topify closes that loop. Visibility Tracking shows you whether your citation frequency is trending up or down across your tracked prompts. Source Analysis shows whether the domains Google is citing in your niche have changed — sometimes a competitor publishes a piece of original research that suddenly displaces your page. You want to know that the week it happens, not the quarter after.

    The Basic plan covers 100 prompts and 9,000 AI answer analyses monthly. For teams managing a focused set of high-value queries, that’s enough to run a systematic optimization program rather than a periodic audit.

    AI-referred traffic converts at approximately 2.3x the rate of traditional organic traffic. The ROI case for systematic tracking is straightforward.


    Conclusion

    The brands winning Google AI Overviews aren’t doing anything exotic. They tracked where they stood. They found the content gap between them and the cited sources. They restructured pages to answer questions directly, in a format AI can extract.

    That’s it. Track. Find the gap. Optimize the structure.

    What doesn’t work: assuming that organic ranking translates to AI citation, or that a one-time content audit is enough. AI Overviews are non-deterministic — they shift as Google updates its models, as competitors publish new content, and as query patterns evolve. Monitoring has to be ongoing.

    If you’re starting from zero, the clearest first step is understanding where your brand currently stands across the prompts your customers are actually typing. Topify’s Basic plan gets you that data for $99/month — and it gives you the source analysis to understand not just whether you’re missing, but why.


    FAQ

    What triggers Google AI Overviews to appear? 

    AI Overviews appear most often for complex informational queries, multi-step explanations, and comparison-based searches. Conversational, longer queries trigger them far more reliably than short keyword searches.

    How is AI Overviews optimization different from traditional SEO? 

    Traditional SEO targets keyword density, backlinks, and domain authority to rank links. AI Overviews optimization focuses on modular content structure, semantic clarity, schema markup, and expert attribution — signals that help AI extract and cite your content.

    Can small brands appear in Google AI Overviews? 

    Yes. 80% of sources cited in AI Overviews don’t rank in the top 3 organically, and 47% rank outside the top 10. Structured, expert-led content can outperform much larger competitors on citation frequency.

    How do I know if Google AI Overviews are hurting my traffic? 

    Monitor Google Search Console for keywords where impressions stay stable but CTR drops. A widening impression-to-click gap on informational queries is a reliable signal that an AI Overview is intercepting traffic before it reaches your listing.

    What content types are most likely to be cited in AI Overviews? 

    Unordered lists (61% of AIOs), short factual paragraphs under 100 words (22%), and ordered lists for sequential processes (12%). Data tables and FAQ sections are particularly citable due to their structured, extractable format.


    Read More

  • AEO vs SEO vs GEO: Which One Gets You Into AI Answers?

    AEO vs SEO vs GEO: Which One Gets You Into AI Answers?

    You’re ranking #1 on Google. But when someone asks ChatGPT for a recommendation in your category, your brand doesn’t come up.

    That’s not a content problem. That’s a strategy problem.

    Three optimization disciplines now govern how brands get discovered online: SEO, AEO, and GEO. They’re not competing frameworks. They’re covering different surfaces. And if you’re only running one of them, you’re leaving significant visibility on the table.

    Here’s how they actually differ, and what to do about it.


    The Search Landscape Already Shifted. Most Brands Haven’t.

    The numbers are hard to ignore.

    Zero-click search rates have climbed from 64% in 2024 to somewhere between 83% and 93% in 2025 and 2026. When Google’s AI Overviews appear on a results page, organic click-through rates drop from 1.76% to 0.61%, a decline of roughly 61-65%. Paid CTR takes an even harder hit, falling 68%.

    Traffic is no longer the right metric. Visibility is.

    That’s the gap most brands still haven’t closed.


    What SEO Is, and Where It Still Matters

    SEO remains the foundation. It focuses on technical crawlability, keyword relevance, and earning high-ranking positions on Google and Bing to drive organic clicks.

    It still works. But its coverage has narrowed.

    The rise of “Search Everywhere Optimization” means users now discover content across social platforms, community forums, voice assistants, and AI chatbots. Google’s organic blue links are one channel among many, and their share of attention is shrinking by the quarter.

    SEO is infrastructure. You need it. But it no longer gets you into the surfaces where discovery is increasingly happening.


    AEO: Stop Ranking. Start Being the Answer.

    Answer Engine Optimization was coined in 2017 by Jason Barnard. The idea was simple: instead of fighting for position on a results page, structure your content so an algorithm picks it as the direct answer.

    AEO targets zero-click environments: Google’s Featured Snippets, “People Also Ask” boxes, and voice assistants like Siri and Alexa. The optimization goal isn’t a click. It’s extraction — getting your content pulled cleanly as the authoritative response to a specific question.

    Tactically, this means FAQ structures, clear entity definitions, and Schema markup. Pages with FAQPage Schema average 4.9 AI citations compared to 4.4 without them. That’s a measurable edge from a relatively low-effort implementation.

    AEO is less about traffic and more about authority positioning. When your content is the answer, you’re not a link someone might visit. You’re the source the engine trusts.


    GEO: From Being Cited to Being Recommended

    Generative Engine Optimization goes a step further. Formally introduced in 2023 through research from Princeton University, Georgia Tech, and the Allen Institute for AI, GEO addresses a fundamentally different machine behavior: synthesis.

    AI chatbots like ChatGPT, Perplexity, and Gemini don’t extract a single answer from a single source. They pull from multiple documents, synthesize them into a narrative, and then recommend. GEO is the discipline of making sure your brand is part of that synthesis — and that the recommendation is positive.

    The citation triggers are different from AEO. Princeton’s research identifies two methods that move the needle most. Adding verifiable statistics increases AI visibility by 37-40%. Including expert quotations adds another 22-40%. Vague marketing language gets filtered out. Factual density is what gets you cited.

    That’s why GEO also reframes brand sentiment as a ranking factor. AI engines assess whether a brand is credible, well-regarded, or facing criticism by synthesizing signals from reviews, Reddit threads, and news coverage. A mixed sentiment profile directly affects whether the model recommends you or your competitor.


    AEO vs SEO vs GEO: The Side-by-Side Breakdown

    SEOAEOGEO
    Target engineGoogle / BingVoice, Featured SnippetsChatGPT, Perplexity, Gemini
    Optimization goalRank #1 for keywordsBe the extracted answerBe the recommended brand
    Key signalsBacklinks, keywords, Domain AuthorityFAQ structure, semantic clarity, SchemaFactual density, statistics, earned media, sentiment
    Success metricsCTR, traffic, keyword rankingsSnippet presence, voice visibilityMention share, citation frequency, sentiment polarity
    User intent modeKeyword-based browsingImmediate factual inquiryConversational research and comparison
    Strategic roleFoundational infrastructureExtraction precisionSynthesized authority

    The table looks like three separate strategies. In practice, they’re three layers of the same stack.


    You Don’t Pick One. You Stack Them.

    Here’s the framing that matters: SEO, AEO, and GEO aren’t alternatives. They cover different stages of how users find and evaluate brands in 2025.

    Think of it as three layers:

    Infrastructure (SEO): Keep your site technically sound. GPTBot and PerplexityBot need to crawl your content before they can cite it. If your pages aren’t indexed or load slowly, you’re not even in the pool.

    Precision (AEO): Target high-volume question-based queries with FAQ structures and answer-first formatting. This is what wins Featured Snippets and gets your content extracted in voice search.

    Authority (GEO): Contribute original research, earn coverage in credible publications, and ensure your brand narrative is consistent across every surface where AI engines look. This is what gets you recommended, not just cited.

    Brands in the top quartile for web mentions receive over 10x more citations in AI Overviews than the next quartile. That compounding effect is real. The earlier you build it, the harder it becomes for competitors to close the gap.


    How to Know Where Your Brand Stands in AI Search

    Most teams don’t have a clear picture of their current AI visibility. That’s the actual starting point.

    Manual testing helps: run your category-level queries through ChatGPT, Perplexity, and Gemini and see what comes back. Note which competitors appear. Note the framing.

    But manual testing doesn’t scale. The prompt space is too large, and results vary by platform, query phrasing, and even the time of day.

    Dedicated GEO tools track the metrics that matter in AI search: Mention Share (what percentage of AI responses reference your brand), Citation Frequency (how often those mentions include a link), Sentiment Polarity (whether the framing is positive, neutral, or negative), and Position Index (where your brand appears in a list of recommendations).

    Topify tracks all of these across ChatGPT, Gemini, Perplexity, and other major AI platforms, giving marketing teams a structured view of where they stand and which competitors are pulling ahead. Its Competitor Monitoring feature shows not just who AI engines recommend, but why — which sources are being cited, and what content gaps your brand needs to close.

    The economics of ignoring this are measurable. A one-point decline in AI first-mention share can increase Customer Acquisition Cost by 3-5% within a single quarter. On the upside, a B2B SaaS company that implemented a GEO content strategy across 50 informational pages saw a 1,570% jump in organic-attributed pipeline within 90 days, with $2.34M in revenue directly traced to ChatGPT and Perplexity recommendations.

    That’s not a niche edge case. That’s where the channel is heading.


    Conclusion

    SEO gets you on the page. AEO gets you into the answer. GEO gets you recommended.

    Each layer matters. None of them is optional if you’re competing for attention in 2025.

    The brands winning AI search right now didn’t get there by accident. They built authority across every surface that AI engines rely on — credible sources, consistent positioning, factual content, and positive sentiment at scale.

    The first step is knowing where you actually stand. Run the queries. Check the outputs. Then build from there.


    FAQ

    Is AEO the same as GEO? 

    No, though they’re closely related. AEO focuses on getting your content extracted as a direct answer in zero-click environments like Featured Snippets and voice search. GEO focuses on being synthesized and recommended by generative AI systems like ChatGPT and Perplexity. AEO is about extraction precision. GEO is about synthesized authority.

    Does AEO replace SEO? 

    No. SEO remains the technical foundation that ensures AI crawlers can access and index your content. AEO and GEO build on top of that foundation to address the surfaces where traditional SEO doesn’t reach.

    How do I start optimizing for AI answer engines? 

    Start by auditing your current AI visibility: run your core queries through ChatGPT, Perplexity, and Gemini and see where your brand appears (or doesn’t). Then prioritize FAQ Schema markup, answer-first content formatting, and building credibility signals across external platforms that AI engines treat as authoritative sources.


    Read More

  • The G2 AEO Playbook: How AI Engines Use Review Data to Rank Your Brand

    The G2 AEO Playbook: How AI Engines Use Review Data to Rank Your Brand

    You’ve invested months building up your G2 presence. Hundreds of verified reviews, a solid star rating, maybe a Leader badge or two. Then a prospect asks ChatGPT, “What’s the best [your category] software?” and your brand doesn’t appear once.

    The reviews are real. The problem is that AI engines don’t read G2 the way buyers do. And most SaaS marketing teams are optimizing for the wrong signals entirely.

    G2 AEO isn’t about accumulating more reviews. It’s about making your profile machine-readable in the specific ways that determine whether an AI recommends you or your competitor.


    AI Engines Don’t Trust Your Website. They Trust G2.

    When an AI like ChatGPT or Perplexity generates a product recommendation, it isn’t summarizing your homepage. It’s cross-referencing your claims against third-party sources that it treats as higher-confidence truth layers.

    Your website is viewed as a biased narrative. It was written by your team, to your audience, with your positioning front and center. AI systems flag this as a potential source of error. To provide accurate recommendations without hallucinating, LLMs look for corroboration, and review platforms like G2 are the primary corroboration layer for B2B software.

    G2’s structured data environment is exactly what makes it valuable here. Its taxonomy, use-case tagging, and verified user-generated content give AI models the machine-readable infrastructure they need to categorize and compare brands at scale. The relationship is similar to what Wikipedia once was for Google’s Knowledge Graph: G2 provides the ontological framework that lets AI place your brand in the right context.

    This trust isn’t distributed evenly. Five review domains, including Gartner Peer Insights, G2, Capterra, Software Advice, and TrustRadius, account for 88% of all review-platform links cited by AI engines. G2 holds a 23.1% citation shareacross general B2B and SaaS queries. That number is about to get larger.


    G2 Is Already Being Cited. The Question Is Whether It’s Citing You.

    Here’s the counterintuitive reality of 2026: G2’s influence as an AI citation source is at an all-time high, even as its organic search traffic dropped 84.5% between January 2024 and December 2025.

    That drop isn’t a sign of G2 losing relevance. It’s proof that the zero-click era has arrived. Users no longer need to visit G2 because the AI has already extracted the data and presented it in a synthesized answer. The platform went from a traffic destination to a citation anchor.

    55% of enterprise buyers now rely on AI search more heavily than traditional Google, and 50% of B2B software buyersbegin their purchase journey inside an AI chatbot. That’s a 71% increase in just four months.

    The queries that trigger G2 citations most consistently are commercial-intent searches: “best X software,” “X alternatives,” “X reviews.” These are the exact prompts your prospects type when they’re evaluating options. When AI answers those prompts, it’s frequently using a competitor’s G2 page to make the case.

    That’s the hidden dynamic most teams miss. Your absence from AI citations in those queries doesn’t mean the AI said nothing. It means it recommended someone else.


    What AI Actually Reads on Your G2 Profile (It’s Not the Star Rating)

    Most G2 strategies are built around one metric: aggregate star rating. That’s the wrong lever for G2 AEO insight.

    LLMs treat star ratings as low-resolution signals that are easily gamed and difficult to contextualize. A 4.7 from 300 reviews tells the AI very little about which specific use case your product is suited for. What AI engines actually prioritize are the fields that carry semantic density.

    Use Case and Category Tags

    Category and use-case tags are the ontological anchors that determine which AI recommendation pools your product enters. If your product is tagged as a general “CRM” when it specifically serves real estate teams, it won’t appear when an AI answers “best CRM for real estate agents,” regardless of how many reviews you have.

    AI models calculate how closely a product’s defined purpose matches a user’s specific request. Brands that achieve Leader status in precisely the right G2 categories see a 4.1x higher citation frequency in AI “best of” queries. The category audit is one of the highest-leverage fixes available.

    Review Body Text

    The raw text inside the Pros and Cons fields is the primary evidence layer for AI engines. When an AI recommends a product, it often pulls specific themes or quasi-direct context from these sections to justify the recommendation.

    A review that says “excellent for cross-departmental collaboration in large engineering teams” is dramatically more useful for answer engine optimization than “5/5, love this product.” The first gives AI the scenario-specific context it needs to match your brand to a detailed, high-intent prompt. The second gives it nothing.

    Vendor Responses

    Vendor responses are one of the few places in your G2 profile where you have full editorial control, and most brands treat them as customer service exercises.

    AI engines read vendor responses to understand official brand positioning and resolve contradictions within user reviews. When you respond with language that mirrors how your buyers actually phrase their problems in AI queries, you’re giving the AI a second, brand-verified data point to work with. That’s what turns a vendor response into a G2 AEO asset.


    Your Competitors Are Winning AI Recommendations Before You Know the Game Started

    The G2 acquisition of Capterra, Software Advice, and GetApp from Gartner was framed as a strategic move to build the definitive AI trust layer for the software industry. The data backs that framing.

    Statistical modeling of the acquisition suggests that G2’s citation share in bottom-of-funnel queries, including pricing, comparisons, and proof of evidence, will increase by approximately 76%. For high-intent queries specifically around customer testimonials and evidence, the combined G2 ecosystem is projected to reach a 12.69% share of all AI citations, a 93% lead over the next most-cited domain.

    This creates a compounding problem for brands that haven’t started optimizing.

    A competitor who’s mapped their G2 profile to the right categories, guided reviewers toward scenario-specific feedback, and maintained an active review cadence will get cited more. More citations lead to higher frequency in conversational AI answers. Higher frequency leads to cognitive capture, where the market starts to perceive that competitor as the category default, because AI consistently names them first.

    By the time your sales team notices the pattern, the association is already forming in the minds of buyers who never visited your website.


    The G2 AEO Optimization Checklist: 6 Things to Fix This Week

    1. Rewrite Your Product Description with Prompt-Aware Language

    Marketing-heavy copy doesn’t translate to AI citations. Replace phrases like “our innovative platform streamlines operations” with factual, scenario-specific statements: “automates Salesforce integration, manages SSO for enterprise teams, provides real-time ROI tracking for marketing managers.”

    AI engines use “answer-first” structures. Your product description should read like the answer to a buyer’s AI prompt, not a homepage hero section.

    2. Audit Your Category and Use-Case Tags for Precision

    Run a quick test: search your core buyer personas’ queries in ChatGPT and Perplexity. If competitors appear and you don’t, cross-reference their G2 category tags against yours. Misalignment in G2’s taxonomy creates entity conflicts that cause AI to favor more clearly defined alternatives.

    Specificity beats breadth. Five precisely matched tags outperform fifteen broad ones.

    3. Brief Reviewers on What to Write, Not Just to Write

    Most review collection campaigns ask customers to “leave a review.” That produces generic feedback. Instead, brief reviewers on the specific scenario they used your product for: the team size, the technical environment, the business outcome. That level of detail is what AI engines extract and cite.

    Active, descriptive profiles are 3x more likely to be cited by ChatGPT than stagnant ones, regardless of total review count. Recency and semantic density matter more than volume.

    4. Respond to Reviews Like the AI Parser Is Reading

    Shift the frame on vendor responses. You’re not just addressing a customer. You’re adding context to a dataset that AI engines read when synthesizing brand summaries.

    In each response, weave in one or two scenario-specific terms that your buyers use when querying AI platforms. Don’t force it. One well-placed phrase per response compounds over time into a richer retrieval profile.

    5. Monitor Which Prompts Are Triggering G2 Citations for Competitors

    This is the step most teams skip because traditional tools don’t support it. The prompts that matter aren’t the ones that mention your brand name. They’re the category-level queries, “best [category] for enterprise teams,” “alternatives to [competitor],” that buyers use before they’ve shortlisted anyone.

    Knowing which prompts are driving citations for competitors tells you exactly where your G2 optimization should focus.

    6. Ensure Your G2 Claims Are Mirrored on Your Own Site

    AI engines cross-reference. If your G2 profile mentions an integration that your website doesn’t document, or claims a use case your blog doesn’t support, the AI may flag the inconsistency and exclude your brand from the answer to avoid providing inaccurate information.

    Cross-platform entity consistency isn’t a nice-to-have. It’s a prerequisite for being cited confidently.


    You Can’t Measure G2 AEO Impact with G2 Traffic Metrics

    Traditional web analytics can’t capture most of what’s happening in AI search. When a user asks ChatGPT for a software recommendation and your brand gets named, there’s no click to track. That interaction happens entirely inside the AI interface, and GA4 typically attributes any resulting visits as direct or referral traffic, making the source invisible.

    But the impact is real. AI-referred traffic converts at 4.4x higher rates than traditional organic for informational queries. In specific B2B cases, ChatGPT referrals have demonstrated conversion rates as high as 15.9%, compared to 1.76% for Google organic. The visits are fewer, but they arrive already briefed.

    To measure whether your G2 optimization is actually working, you need a different set of metrics.

    Topify tracks citation frequency across ChatGPT, Perplexity, Gemini, and other major AI platforms, and its Source Analysis feature identifies exactly which domains AI engines are pulling from when they answer queries in your category. That means you can see whether G2 is being cited for your brand or your competitors, and which specific prompts are triggering those citations.

    Visibility Tracking shows you your brand’s presence score over time, so you can correlate G2 profile updates, like a batch of new scenario-specific reviews or a product description rewrite, with actual changes in AI citation frequency. That’s the feedback loop that turns G2 AEO from a hypothesis into a measurable growth channel.

    The Q1 2026 data tells the story clearly: the AEO software category on G2 saw a 62% increase in page views in a single quarter. The market has already concluded that G2 optimization for AI visibility is worth prioritizing. The question is whether your team is ahead of that curve or catching up to it.


    Conclusion

    G2 was built for buyers. It’s now being read by AI. That shift changes almost everything about how a profile should be managed.

    The brands that win AI recommendation share in 2026 aren’t necessarily the ones with the most reviews or the highest star ratings. They’re the ones with the most machine-readable profiles: precise category tags, scenario-specific review text, consistent cross-platform data, and vendor responses that speak the language AI engines are listening for.

    Start with the checklist in this article. Then set up the measurement layer so you can see what’s actually moving. G2 has become one of the highest-leverage surfaces for B2B brand visibility in AI search. The ROI is real, but only if you’re tracking it.


    FAQ

    Q: Does having more G2 reviews improve my AEO ranking?

    A: Not on its own. AI engines prioritize the recency and semantic density of reviews over total count. Profiles with active, descriptive reviews updated within the last 90 days are 3x more likely to be cited by ChatGPT than stagnant profiles with hundreds of generic five-star ratings. Focus on quality and scenario specificity, not volume.

    Q: Is G2 more effective than Capterra for AI search visibility?

    A: G2 currently holds a slight lead with a 23.1% AI citation share versus Capterra’s 17.8%, and they’re typically cited for different purposes. G2 tends to appear in user-rating queries while Capterra surfaces in feature-comparison queries. Following the acquisition, the distinction is becoming less relevant operationally, as the unified data pool will inform recommendations across both surfaces simultaneously.

    Q: Do negative reviews on G2 hurt my AI search ranking?

    A: Yes, but not through the star rating mechanism. AI engines synthesize the substance of negative feedback. If several reviews mention “frequent downtime” or “poor enterprise support,” the AI may characterize your brand that way in synthesized answers. Prompt, well-written vendor responses can provide corrective context that AI includes in a balanced summary, which is why response strategy matters as much as review collection.

    Q: Can AI engines read gated G2 content?

    A: No. AI crawlers including GPTBot and ClaudeBot can’t bypass login walls, paywalls, or form gates. If your most detailed case studies or review insights are gated, they’re invisible to the AI that could be citing them. G2 also specifically disallows certain crawler paths in its robots.txt to protect proprietary data, so the publicly accessible portions of your profile are what AI engines work from.


    Read More

  • What G2 Reviews Actually Reveal About AEO Tools in 2026

    What G2 Reviews Actually Reveal About AEO Tools in 2026

    A 4.8-star rating on G2 doesn’t tell you whether a tool can track your brand inside a ChatGPT response. That gap is where most AEO buying decisions go wrong.

    The AEO software category on G2 has grown over 2,000% since March 2025. More teams are shopping for tools. Fewer know what to actually look for. This article breaks down what G2 reviews reveal — and what they quietly skip over.


    Most G2 Ratings Miss the Metric That Matters Most in AEO

    G2’s scoring framework was built for traditional SaaS: usability, implementation speed, relationship quality. Those dimensions matter. But they don’t measure what AEO tools are actually hired to do.

    In traditional SEO, a tool tracks a blue link on a static results page. The rank is linear. Verification is simple. AEO is different. Brand visibility in ChatGPT or Perplexity is probabilistic — the same query can return different citations depending on prompt history, geographic parameters, and model version. G2’s evaluation rubric wasn’t designed for that variability.

    Here’s what that means in practice:

    G2 Evaluation DimensionWhat Users ScoreWhat It Misses
    Usability IndexHow intuitive is the dashboard?Clean UIs can hide outdated “model freeze” data
    Implementation IndexHow fast can we get started?Rapid setup often means shallow crawler integration
    Relationship IndexHow responsive is support?Great support can’t fix a tool that ignores DeepSeek
    Results IndexIs the tool providing value?Users may optimize for mentions, not CVR

    The tools with the highest G2 scores in early 2026 are often the ones with the best customer success teams — not necessarily the strongest technical infrastructure.

    That’s the gap this article helps you close.


    What G2 Reviews Actually Say About AEO Tool Performance

    The aggregate star score is the least useful number on the page. The useful signal is buried in the 1-3 star reviews.

    A granular read of low-star feedback across established AEO players reveals three consistent clusters of dissatisfaction: data accuracy, platform latency, and what practitioners are calling the “actionability gap.”

    Data accuracy is the most contested area. Tools that rely on statistical modeling rather than direct browser capture tend to miss what researchers call “hidden citations” — brand mentions inside LLM training sets that don’t surface through standard public APIs. Users from platforms like Similarweb and BrightEdge have flagged this specifically in niche markets and smaller sites.

    Latency is the second major pain point. With AI models updating their retrieval-augmented generation (RAG) datasets more frequently in 2026, a weekly data refresh cycle is often inadequate for high-velocity marketing teams. When content changes don’t show up in the dashboard for days, teams lose the ability to respond to real-time shifts.

    The actionability gap is the complaint that’s hardest to see coming. Many teams discover post-purchase that their tool functions as an intelligence center, not an execution engine. The data is clean. The reports look sharp. But there’s no built-in mechanism to act on what the dashboard surfaces.

    If you’re reading G2 reviews to make a purchase decision, these are the complaint tags worth filtering for:

    G2 “Con” TagTechnical MeaningBusiness Impact
    Expensive / High PricingHidden add-on fees or steep entry costProhibitive for SMBs; high pressure to prove ROI fast
    Overwhelming UILegacy SEO features bundled with AEOSteep learning curve; AEO insights get buried
    Slow Loading / LatencyBackend struggles with large dataset processingCan’t respond to real-time model updates
    Limited CustomizationRigid reporting templatesHard to present visibility data to CMO vs. SEO Manager

    Skip the high-level satisfaction score. Read the cons. That’s where the technical reality lives.


    The AEO Tools With the Strongest G2 Profiles in 2026

    The G2 Spring 2026 Grid for AEO identifies a clear set of leaders across different market segments. Here’s how the top five platforms compare on the dimensions that actually matter for answer engine performance:

    PlatformG2 StatusAI Platforms CoveredStarting PriceKey Differentiator
    TopifyEmerging Technical StandardChatGPT, Gemini, Perplexity, DeepSeek, Doubao, and more$99/mo7-metric framework + One-Click Agent Execution
    ProfoundCategory Leader10+ platforms$499/moSOC 2/HIPAA compliance; enterprise infrastructure
    QuattrHighest PerformerChatGPT, Gemini, Perplexity, CopilotCustomCMS-integrated content execution; 3X content velocity
    Visby AIHigh User SatisfactionChatGPT, Claude, Gemini$79/moFunnel-stage monitoring
    AirOpsMomentum Leader30+ AI modelsCustomWorkflow automation at enterprise scale

    1 Topify: The 7-Metric Operating System for AI Search

    Topify has positioned itself as more than a rank tracker. Built by a team of former OpenAI researchers and Google SEO champions, the platform achieves 95-98% citation accuracy — a benchmark that most category tools don’t publish because they can’t match it.

    The architecture centers on seven KPIs that connect brand visibility to revenue: visibility, volume, position, sentiment, mentions, intent, and CVR. Most tools stop at “mentions.” Topify’s Sentiment Analysis adds a 0-100 scoring mechanism that captures whether an AI is describing your brand enthusiastically, neutrally, or with caveats. That distinction changes strategy.

    Its Source Analysis feature is what separates Topify from monitoring tools entirely. Rather than telling you that a competitor is cited more often, it reverse-engineers the exact domains and URLs that AI platforms are pulling from — and identifies the semantic gaps your content needs to close to reclaim that position.

    The most significant competitive advantage for lean teams is One-Click Agent Execution. Most AEO tools require manual export, manual content writing, and manual publishing. Topify’s AI agent identifies the gap, builds the content, and deploys it in a single workflow. That’s the difference between an intelligence center and an execution engine.

    Pricing is structured for teams at every stage. The Basic plan starts at $99/mo and includes a 30-day trial with 100 prompts and 9,000 AI answer analyses — enough data to cross-verify against manual results before committing.

    2 Profound

    Profound holds the G2 Category Leader position, backed by a client list that includes 10% of the Fortune 500. Its Query Fanouts Analysis maps how a single user prompt breaks into a chain of LLM sub-queries — useful for enterprise teams targeting the entire reasoning journey. SOC 2 Type II and HIPAA compliance make it the default choice for regulated industries. Entry price starts at $499/mo.

    3 Quattr

    Quattr is recognized as a Highest Performer on G2 for ease of use. Its GIGA AI agent unifies content gap identification, optimized content generation, and direct CMS publishing into one workflow. Teams report a 3X increase in content velocity. It functions as a bridge between traditional SEO and conversational AI visibility for mid-market brands.

    4 Visby AI

    Visby AI categorizes brand mentions by funnel stage — awareness, consideration, or decision. Growth teams use this to identify exactly where they’re losing ground to competitors in the customer journey, then receive prioritized GEO tasks like content fixes and schema improvements. Starting at $79/mo, it’s well-suited for focused conversion-stage work.

    5 AirOps

    AirOps recently closed a $40M Series B and covers 30+ AI models. It’s favored by high-volume content teams that need to scale AEO efforts across thousands of pages simultaneously, with optimization recommendations tuned for both traditional search and AI citation engines.


    What the Scores Don’t Capture: AI Visibility Accuracy

    This is the part of the G2 evaluation process that most procurement checklists skip entirely.

    The non-deterministic nature of modern LLMs means that two identical queries — run 30 seconds apart — can return different brand citations. A tool that ranks highly for “Ease of Use” on G2 might be using API shortcuts that return averaged or static data, rather than capturing this real-world variability through direct browser crawling. The result is a clean dashboard built on a misleading foundation.

    In 2026, there’s a second filter that G2 scores can’t measure: E-E-A-T as a binary gate.

    Data from late 2025 shows that 47% of all AI Overview citations now come from pages that rank below the top five positions in Google organic search. AI engines aren’t prioritizing the highest-DA domain — they’re running content through an Experience, Expertise, Authoritativeness, and Trustworthiness threshold. Pages that clear it get cited. Pages that don’t, don’t.

    The three content factors with the highest measurable impact:

    E-E-A-T FactorImpact on AI Citation Probability
    Structured Data (FAQ, Product, HowTo schema)+73% selection rate
    Multimodal Content (text + image + video for RAG)+156% selection rate
    Atomic Answer Format (passage-level extractability)~3X citation improvement

    Most G2-rated tools don’t audit for any of these. They show you that your visibility dropped. They don’t tell you why the AI stopped citing your content, or what specific structural change would bring it back.

    The real question for any procurement team isn’t how users rate the dashboard. It’s whether the data provided changes the strategy.


    How to Use G2 Insights to Actually Choose the Right AEO Tool

    G2 is a starting point, not a verdict. Here’s a three-step framework for using it without getting misled.

    Step 1: Filter reviews for implementation realism. Skip the aggregate score and search G2 comments for specific terms: “data lag,” “hallucination detection,” “manual verification,” “accuracy variance.” These phrases describe what actually breaks down when a team tries to run an AEO program at scale. Also filter by your industry — a tool that works well for an e-commerce brand may fail a healthcare provider, where AI Overviews appear on nearly 49% of all queries and accuracy is non-negotiable.

    Step 2: Validate platform coverage. Research shows that 47% of
    AI search users regularly switch between two or more platforms. A tool that only covers ChatGPT — which currently drives 87.4% of AI referral traffic — is not a forward-looking investment. You need coverage across at least ChatGPT, Gemini, Perplexity, and Claude, with a roadmap that includes emerging global engines like DeepSeek and Doubao. Also check methodology: direct browser capture versus API output produces meaningfully different data.

    Step 3: Run high-volume trial data before committing. Topify’s Basic plan includes a 30-day trial with 100 prompts and 9,000 AI answer analyses. That’s a large enough dataset to cross-verify tool-reported citations against manual spot checks. If the platform’s recommendations don’t move your citation frequency within a 30-60 day window, the long-term ROI case collapses.

    On the flip side, a short trial on a limited prompt set tells you very little. Negotiate for trial volume, not trial duration.

    Conclusion

    The AEO tool market in 2026 has split into two camps: measurement tools and execution engines. G2 scores are largely a proxy for the former — they reward clean dashboards and responsive support, not the technical accuracy needed to clear E-E-A-T filters or influence an AI’s reasoning chain.

    Bottom line: prioritize tools that close the full loop — from analysis to content creation to deployment. Topify’s 7-metric framework, Source Analysis, and One-Click Agent Execution put it at the technical frontier for teams that need to move from visibility data to actual search influence. For regulated enterprises, Profound offers the strongest compliance infrastructure. For teams that need CMS-integrated execution, Quattr is a strong option.

    In the answer economy, visibility isn’t guaranteed by domain authority. It’s earned through semantic clarity and structured content. Choose the tool that helps you earn it — not just measure it.

    Start with Topify’s 30-day trial and test your actual citation rate before committing to any platform.


    FAQ

    What is AEO and how is it different from SEO in 2026?

    AEO (Answer Engine Optimization) focuses on structuring content so it gets retrieved, cited, and accurately represented by AI answer engines. Where SEO targets clicks on a results page, AEO targets clarity and influence inside the AI’s synthesized response. In 2026, over 60% of search queries resolve without a single click — which is why AEO has moved from experimental to essential.

    Are AEO tools listed as a separate category on G2?

    Yes. G2 launched the Answer Engine Optimization category in March 2025. Some hybrid tools still appear in both AEO and traditional SEO categories, and some legacy platforms sell AEO features as add-on “AI Visibility Toolkits” within existing suites.

    What specific technical complaints should I look for in G2 reviews?

    Prioritize reviews that mention “slow loading,” “data latency,” “interface complexity,” and “accuracy variance.” These terms describe a tool’s inability to keep pace with the non-deterministic, frequently-updated outputs of modern LLMs — which is the core technical challenge of AEO.

    Does Topify have a G2 profile?

    Topify is one of the fastest-growing platforms in the 2026 AEO market. Early user feedback highlights fast innovation speed and user-centric design. Comparative G2 badges are updated quarterly as review volume scales. You can explore the platform directly at topify.ai.

    How many AI platforms should a comprehensive AEO tool cover?

    A minimum viable tool covers ChatGPT, Gemini, and Perplexity. Professional-grade platforms like Topify extend coverage to DeepSeek, Doubao, and other global engines — which matters if any portion of your audience uses non-English AI tools or operates in markets where ChatGPT isn’t dominant.


    Read More

  • GEO Rank Tracker: Monitor Your AI Search Position

    GEO Rank Tracker: Monitor Your AI Search Position

    If your brand ranks #1 on Google, that’s no longer enough. Research shows that sites holding the top organic position appear in AI Overviews for the same query only 33.07% of the time. That’s not a rounding error. That’s a structural gap between where your brand lives in traditional search and where it actually shows up when someone asks ChatGPT, Gemini, or Perplexity for a recommendation.

    A GEO rank tracker closes that gap. Here’s what it measures, why it’s harder to run than standard SEO tools, and how to put one to work.


    Your Google Rank Doesn’t Tell You What AI Recommends

    Traditional SEO tools track position in a list. AI search doesn’t work that way.

    When a user asks “what’s the best project management tool for remote teams,” they don’t get ten blue links. They get a synthesized answer, and your brand is either in it or it isn’t. There’s no page two. There’s no position five. There’s cited, mentioned, or absent.

    Only about 17% of AI Overview citations come from the traditional top-10 organic results, according to BrightEdge data. That means the other 83% of AI recommendations are driven by factors that standard rank trackers don’t measure at all. High domain authority, keyword-optimized pages, and clean technical SEO don’t automatically translate into AI citations. The rules are different.

    This is the core problem a GEO rank tracker is built to solve.


    What a GEO Rank Tracker Actually Measures

    A GEO rank tracker monitors four distinct dimensions of AI search performance. Each one captures something that traditional tools miss entirely.

    Position is where your brand lands relative to competitors in an AI-generated recommendation list. If someone asks for the top CRM tools and your brand is mentioned third, that’s your position. It’s not a page ranking. It’s a recommendation sequence.

    Visibility measures how frequently your brand appears across a defined set of target prompts. Because AI outputs are probabilistic, the same prompt can produce different answers across different sessions. A reliable GEO rank tracker runs each prompt multiple times to calculate a statistically valid visibility score, not a single snapshot.

    Sentiment tracks how AI describes your brand when it does mention you. The difference between “a cost-effective option” and “a reliable choice for enterprise teams” matters for conversion. Natural language processing parses the tone and attributes attached to your brand across thousands of AI responses.

    Prompt Coverage maps which search scenarios actually trigger your brand’s appearance. This includes category queries (“best tool for X”), comparison queries (“A vs. B”), and problem-based queries (“how do I solve X”). Gaps in prompt coverage reveal where competitors are winning visibility that should be yours.

    Together, these four metrics form the complete picture of your AI search position.


    Why Tracking AI Rank Is Harder Than Tracking Google Rank

    AI search monitoring introduces technical challenges that don’t exist in traditional SEO.

    The first is non-determinism. Large language models generate outputs probabilistically. Even identical prompts produce different results across sessions because of sampling algorithms built into the model architecture. A single manual test tells you almost nothing. You need automated, large-scale sampling to get a number you can trust.

    The second challenge is cross-platform fragmentation. The three major AI platforms don’t cite the same sources or follow the same logic.

    ChatGPT draws roughly 48.73% of its citations from directories and aggregator sites like Yelp and TripAdvisor. It’s optimized toward third-party consensus, not brand-owned content. Google Gemini pulls approximately 52.15% of citations from official brand websites, particularly pages with structured data and clear Schema markup. Perplexity skews heavily toward community signals, with about 46.7% of citations sourced from Reddit and similar platforms. It also applies a recency weighting, favoring content updated within the past 30 days.

    Your brand can be visible on Perplexity and invisible on ChatGPT. That’s not a bug. It’s a reflection of fundamentally different citation logic across platforms. Monitoring only one gives you a false read on your overall AI search position.

    The third challenge is infrastructure. Google provides Search Console. Most AI platforms don’t offer equivalent visibility tools for brands. That makes third-party GEO rank trackers the only viable path to systematic monitoring at scale.


    How to Start Tracking Your Brand’s AI Search Rank

    Getting a GEO rank tracker up and running takes four steps. Each one builds on the last.

    Step 1: Define Your Target Prompts

    Start with prompt research, not keyword research. Think through the natural language questions your audience types into AI chat interfaces. A strong prompt library covers at least three categories: direct brand queries that check factual accuracy, competitive comparison queries that reveal whether your brand appears as an alternative, and informational queries where you want to be positioned as a category authority.

    Plan for 50 to 100 prompt variations per core category. That volume sounds high, but AI search is probabilistic. Narrower prompt libraries produce data that’s too thin to act on.

    Step 2: Choose the Platforms to Monitor

    ChatGPT covers the broadest general search audience. Gemini integrates deeply with Google’s ecosystem and Android. Perplexity dominates the research and professional use case. Missing any one of them means missing a distinct segment of your target audience.

    Platform gaps are also diagnostic. If your brand scores well on Perplexity but poorly on ChatGPT, that’s a signal that your third-party review and directory presence needs work. The cross-platform comparison is the data, not just the individual scores.

    Step 3: Set Up Automated Tracking

    Manual monitoring doesn’t scale. AI platforms update their retrieval logic continuously. Perplexity’s content refresh cycle operates in hours, not weeks. Checking rankings manually once a month means operating with data that’s already stale.

    Topify’s AI search position monitoring handles this automatically, running your prompt library across ChatGPT, Gemini, Perplexity, and other major platforms from a single dashboard. Its Position Tracking feature monitors your brand’s rank relative to competitors in real time, and the Competitor Monitoring module flags when a rival moves ahead on prompts where you previously held an advantage.

    The platform also surfaces near-top opportunities using Search Console integration, identifying prompts where your brand is close to breaking into AI citations but not yet appearing consistently.

    Step 4: Read the Data and Act

    When your GEO rank tracker shows a drop in citation rate, the next question is why. Source Analysis answers that. It identifies the specific URLs and domains that AI platforms are pulling from and whether your brand’s content appears in those citations.

    If AI is citing an industry media outlet heavily but your brand has no presence there, that’s a content distribution gap. If a competitor is dominating a specific prompt category, Source Analysis shows which of their content assets is driving that visibility. The data goes from measurement to action faster than any manual review could.


    What Actually Moves Your AI Search Rank

    Three factors have a measurable impact on AI citation rates. Understanding them shifts GEO from monitoring into optimization.

    The first is fact density. Research consistently shows that content containing specific statistics, named data sources, and concrete figures gets cited at significantly higher rates. Content with original data is cited approximately 3.5 times more often than general-purpose content that relies on descriptive language instead of numbers. Replacing “a highly effective email marketing strategy” with “email marketing with an average ROI of 36x” changes how AI evaluates and extracts that content.

    The second factor is third-party validation. AI systems have a built-in preference for information that appears verifiable and externally confirmed. Citations from recognized research institutions, direct quotes from named industry experts, and references to primary data sources all increase what researchers call “credibility weighting” in AI retrieval. Brand-owned content that references authoritative external sources performs better than brand-owned content that doesn’t.

    The third factor is content structure. AI doesn’t read pages the way humans do. It extracts passages. Content organized into clear, 200 to 400-word blocks with descriptive headings and FAQ Schema allows AI to pull specific fact units without ambiguity. Dense walls of text, regardless of their quality, are harder for retrieval systems to parse accurately.

    High domain authority still matters, but it’s no longer sufficient on its own. An outdated, poorly structured page from a high-DA site will often lose to a current, well-structured page from a lower-authority source. The GEO optimization lever has shifted from link building toward what practitioners call fact engineering.


    Common Mistakes When Teams First Track GEO Rankings

    Most early-stage errors fall into five patterns.

    Trusting a single screenshot. One manual search result tells you almost nothing about your brand’s actual AI search rank. LLM outputs are probabilistic. A single positive result could be statistical variance. Without automated sampling across dozens of sessions, you don’t have a rank. You have an anecdote.

    Ignoring competitor movement. If your brand’s citation rate holds steady at 15% but a competitor climbs from 10% to 40% over the same period, you’re losing relative share even though your absolute number didn’t change. GEO is inherently competitive. Absolute metrics without competitor context are incomplete.

    Checking too infrequently. Monthly monitoring is effectively no monitoring for fast-moving AI platforms. Algorithm updates, competitor content launches, and platform indexing shifts can meaningfully change your position within days. Weekly automated tracking is the minimum viable frequency for most categories.

    Conflating Google AI Overviews with AI Mode. These are distinct products with different citation logic. Research shows the URL overlap between what appears in Google AI Overviews and Google’s AI Mode is only 10.7%. Tracking one and assuming the other follows is a measurement error.

    Skipping competitor source analysis. Knowing that a competitor outranks you is less useful than knowing why. When GEO rank data is paired with source analysis, teams can identify the specific content assets driving a competitor’s visibility and build a response strategy based on evidence rather than guesswork.


    Conclusion

    You can’t manage what you can’t measure. That’s especially true in AI search, where brand recommendations happen in generated text rather than ranked lists, and traditional analytics tools have no line of sight into what’s actually being said.

    A GEO rank tracker isn’t a nice-to-have addition to an SEO stack. It’s the foundational measurement layer for any brand that wants to know where it stands in AI-driven discovery. Position, visibility, sentiment, and prompt coverage together tell you what’s working, what’s not, and where competitors are pulling ahead.

    Topify provides cross-platform AI search monitoring across ChatGPT, Gemini, Perplexity, and other major platforms, with automated tracking, competitor benchmarking, and source analysis built into a single dashboard. If you don’t yet have a baseline for your brand’s AI search position, that’s the right place to start.


    FAQ

    What is a GEO rank tracker? 

    A GEO rank tracker is an automated tool that monitors how often a brand appears in AI-generated answers across platforms like ChatGPT, Gemini, and Perplexity. Unlike traditional SEO tools that track page position in link-based results, a GEO rank tracker analyzes generated text to measure brand visibility, recommendation order, and sentiment.

    How is GEO ranking different from SEO ranking? 

    SEO ranking measures where a webpage appears in a static list of links. GEO ranking measures whether a brand is cited, recommended, or described in a synthesized AI response. The two can diverge significantly. A site ranking first on Google appears in AI Overviews for the same query only about one-third of the time, based on current data.

    Which AI platforms should I track my brand on? 

    At minimum, track ChatGPT, Google Gemini, and Perplexity. Each platform uses different citation logic: ChatGPT favors third-party directories and community consensus, Gemini prioritizes structured brand-owned content, and Perplexity weights recent content and community signals. Cross-platform data reveals gaps that single-platform monitoring misses.

    How often should I check my AI search rank? 

    Weekly automated tracking is the baseline for most teams. In fast-moving categories like technology or e-commerce, daily monitoring catches competitive shifts and platform indexing changes before they compound into larger visibility gaps.


    Read More

  • The 8 Marketing Analytics Tools That Actually Tell You Why Campaigns Fail

    The 8 Marketing Analytics Tools That Actually Tell You Why Campaigns Fail

    Most marketing teams don’t have a data problem. They have a diagnosis problem.

    The dashboards are green. The reports go out every Monday. And somehow, at the end of the quarter, the numbers still don’t add up. You know what happened — traffic dropped, leads slowed, ROAS slid. What you don’t know is why.

    That gap between “what happened” and “why it happened” is where campaigns die quietly. And it’s exactly what most marketing analytics tools are still failing to close.

    This article ranks eight tools not by feature count or pricing tiers, but by one question: can this tool actually tell you why a campaign failed?


    You Probably Have Too Much Data and Too Few Answers

    The “Big Data” era gave marketing teams more dashboards than decisions. The average enterprise marketing stack now includes 12-plus tools, each generating its own reports — and most of those reports describe the past without explaining it.

    This is the diagnostic gap. Data confirms a conversion rate dropped. It rarely explains whether the drop came from a creative fatigue issue, a targeting misalignment, a UX problem on the landing page, or a competitor gaining ground in AI-generated recommendations.

    The result is what analysts call data fatigue: teams spending 60-70% of their time preparing data rather than acting on it. That’s not a tools problem. That’s a framework problem.

    Reporting vs. Diagnostics: A Real Difference

    A reporting tool answers “what happened.” A diagnostic tool answers “why.” The difference matters more than most buyers realize before signing a contract.

    Reporting is built for visibility and stakeholder alignment. It pulls data from your CRM, ad platforms, and web logs, then displays it in a consistent format. It tells you that bounce rate increased 18% last Tuesday. It does not tell you whether that increase came from a broken mobile form, a mismatched ad headline, or a shift in audience quality.

    Diagnostic analytics goes deeper. It uses drill-downs, cohort segmentation, and anomaly detection to isolate the root cause. That’s not a minor upgrade — it’s a fundamentally different tool category.

    FeatureReporting ToolsDiagnostic Analytics Tools
    Primary questionWhat happened?Why did it happen?
    Data natureSummarized, historicalGranular, segmented, exploratory
    User interactionPassive viewingActive interrogation of variables
    OutcomeAccountabilityRoot cause identification
    ComplexityLow to moderateHigh; often requires technical expertise

    The platforms that make this list earned their spot by leaning diagnostic, not just descriptive.


    5 Metrics That Actually Predict Campaign Failure Before It Happens

    Conversion rate is a lagging indicator. By the time it drops, the budget has already been wasted. Proactive diagnostics require metrics that signal trouble during the campaign, not after.

    Here are five that actually matter.

    1. CTR trend, not just CTR. A slow decline in click-through rate while impressions hold steady is a classic sign of creative fatigue. Ad platforms respond by lowering relevance scores, which raises CPC and degrades traffic quality — all before conversions show any movement.

    2. CPL vs. pipeline quality. Cost Per Lead staying flat can mask a real failure if the leads coming in are lower quality than before. The metric to watch isn’t CPL in isolation — it’s CPL in the context of downstream conversion rates.

    3. Sales cycle length. An unintended extension in the average sales cycle is a mid-funnel diagnostic signal. It typically points to friction in the nurturing process or a mismatch between what the ad promised and what the landing page delivered.

    4. Anomaly Z-scores. Automated anomaly detection uses machine learning to flag deviations from baseline performance — accounting for seasonality and day-of-week patterns. A Z-score above 2.5 signals an urgent investigation. Above 3.0, something has broken.

    5. AI Answer Share. This one doesn’t show up in traditional marketing analytics tools at all. As platforms like ChatGPT and Perplexity become primary research channels, whether your brand appears in AI-generated recommendations is increasingly a leading indicator of organic demand — and most teams are flying blind on this metric.

    Why Conversion Rate Alone Tells You Nothing About What Went Wrong

    Conversion rate is the most-watched metric in marketing and one of the least useful for diagnosis. It confirms failure. It doesn’t explain it.

    A campaign can fail from creative burnout, landing page friction, audience drift, a competitor gaining AI visibility, or a simple tracking error. Conversion rate registers the same number regardless of cause. Without the layer beneath it, you’re treating symptoms with no diagnosis.

    The tools below are ranked specifically on how well they provide that layer.


    The 8 Marketing Analytics Tools, Ranked by What They Can Actually Diagnose

    These aren’t just the most popular platforms. They’re the ones that can give you a defensible answer when someone asks why the campaign underperformed.

    1. Topify — Diagnostic Layer for AI Search Visibility

    Topify occupies a category most marketing analytics tools haven’t touched yet: AI search diagnostics. While every tool on this list tracks what happens on your website, Topify tracks what happens before users ever get there — specifically, whether your brand is showing up in ChatGPT, Gemini, and Perplexity responses.

    That’s not a niche use case anymore. AI-referred visitors convert at 14.2%, compared to 2.8% for Google organic — a 5x advantage. In B2B categories, Perplexity traffic has shown conversion rates as high as 20-30%. The brands not tracking AI visibility are missing the highest-intent traffic channel in the current environment.

    Topify’s core diagnostic capability is what it calls Answer Share: the percentage of AI-generated responses that mention your brand versus your competitors. It tracks brand mentions across seven key metrics — visibility, sentiment, position, volume, mentions, intent, and CVR — with daily refreshes. Its Source Analysis feature reverse-engineers which domains AI platforms are citing, so you can identify exactly where your authority gaps are before they become traffic gaps.

    It also surfaces “near-top 3” keyword opportunities in organic search, giving teams a prioritized list of quick-win content updates alongside the AI visibility data.

    Best for: Marketing teams, brand managers, and agencies that want to diagnose why organic performance is declining — especially in categories where AI Overviews and chatbot recommendations are eating into traditional search traffic.

    Limitations: Focused on organic and AI search visibility; doesn’t replace paid media attribution or CRM-level revenue mapping.

    Starting price: Free tier available; paid plans from $99/month.

    2. Northbeam — Incrementality-Focused Attribution for High-Volume DTC

    Northbeam is built for brands that have outgrown platform-reported metrics and need a statistically honest single source of truth. Its core value is fractional attribution: rather than giving 100% credit to the last click, it distributes credit across the customer journey using machine learning — and it guarantees that attributed sales never exceed actual order counts.

    The incrementality testing is where it earns its diagnostic credentials. It isolates which ad dollars are actually driving new revenue versus capturing demand that would have converted anyway. For brands running complex multi-channel mixes — TV, podcasts, influencer — that distinction is worth significant budget reallocation.

    Best for: Growth-stage DTC brands ($40M+ revenue) running mature, multi-channel campaigns where platform-reported ROAS is no longer trustworthy.

    Limitations: Steep learning curve; typically requires dedicated analytics resources. Starting around $1,000/month.

    3. Triple Whale — Daily Operating System for Shopify Brands

    Triple Whale has become the default attribution layer for Shopify merchants who need clear daily profitability data without a data science team. Its Triple Pixel collects first-party behavioral data, bypassing iOS privacy restrictions that have made platform-reported metrics increasingly unreliable.

    Its diagnostic strength is the blended Marketing Efficiency Ratio (MER) — a more honest view of total marketing performance than channel-specific ROAS. It also integrates inventory data, flagging when ads are running for products that are low on stock, which is a common and expensive campaign failure point.

    Best for: Shopify-native brands ($10M-$40M revenue) needing fast, actionable daily clarity.

    Limitations: Limited to the Shopify ecosystem. Starting around $129/month.

    4. Funnel.io — Data Infrastructure for Enterprise Complexity

    Funnel.io solves a different problem than the other tools here: it normalizes fragmented data from 600-plus connectors into a stable foundation for advanced analytics. It doesn’t do the diagnostics itself — it ensures the data feeding your diagnostics is clean, consistent, and historically archived.

    For enterprises running Marketing Mix Modeling or cross-platform incrementality testing, reliable data infrastructure is the prerequisite. Funnel.io’s Data Hub handles API changes and schema updates automatically, which removes a significant ongoing maintenance burden from analytics teams.

    Best for: Large agencies and multi-brand enterprises where data fragmentation is the primary diagnostic blocker.

    Limitations: Functions as a data layer, not a recommendation engine. Pricing varies by data volume.

    5. Mixpanel — Behavioral Diagnostics for Product-Led Teams

    Mixpanel focuses on what happens after the click — making it indispensable for SaaS and product-led growth teams that need to diagnose user drop-off, feature adoption, and long-term retention. Its unlimited funnel steps and deep retention cohorts allow teams to map every interaction from first touch to loyal customer.

    The diagnostic value isn’t in acquisition analytics. It’s in answering why users engage (or don’t) at every stage of the product experience. If campaigns are delivering qualified leads but retention is collapsing, Mixpanel finds where the experience breaks down.

    Best for: SaaS teams and product-led growth organizations.

    Limitations: No native session recordings or heatmaps. Not designed for cross-channel acquisition attribution.

    6. Heap — Retroactive Behavioral Analysis

    Heap’s defining feature is automatic event capture: it records every user interaction from day one, without requiring manual tracking setup. That means teams can build funnels and cohorts retroactively — analyzing events they didn’t know they’d need to track when they deployed the tool.

    For teams that have lost diagnostic context because they didn’t set up event tracking correctly early on, Heap offers a way back. It’s genuinely useful for post-hoc investigation of UX failures and conversion drop-off points.

    Best for: Teams with significant budgets who prioritize ease of retroactive setup.

    Limitations: Opaque enterprise pricing (estimates range from $2,000-$5,000+/month); data retention limits on lower-tier plans can constrain long-term trend analysis.

    7. Google Analytics 4 — The Baseline Everyone Uses

    GA4 remains the foundational diagnostic layer for most of the internet, primarily because it’s free and deeply integrated with the Google ad ecosystem. For small to mid-sized businesses, it answers the core questions: where is traffic coming from, what’s converting, and what’s not.

    The data-driven attribution models are a genuine upgrade from the old Universal Analytics last-click defaults. For teams operating within the Google ecosystem, they’re worth configuring properly.

    Best for: Small to mid-sized teams with limited budgets that need solid acquisition diagnostics without enterprise overhead.

    Limitations: Data retention limited to 14 months on the free tier; heavy data sampling in large datasets reduces diagnostic precision; limited for behavioral product analysis.

    8. Supermetrics — Automation for BI-Centric Teams

    Supermetrics has evolved from a data connector into what it calls a “Marketing Intelligence Cloud.” Its core value is moving marketing data from ad platforms and analytics tools into the BI environments teams already use — Looker Studio, Power BI, Excel, Google Sheets.

    Its newer AI-powered “Insights Agent” can answer plain-language questions like “Why are leads down this week?” — a genuine diagnostic upgrade over raw data pipelines. The Conversion Sync feature feeds enriched data back to ad platforms to improve algorithmic targeting.

    Best for: Teams heavily invested in Google or Microsoft BI ecosystems who need to centralize and activate data at scale.

    Limitations: Best results depend on external visualization tools; costs can escalate as connectors and storage modules are added.

    Quick Comparison

    ToolCore Diagnostic StrengthStarting PriceBest For
    TopifyAI search visibility + Answer ShareFree / $99/moOrganic + AI channel diagnostics
    NorthbeamFractional attribution + incrementality~$1,000/moHigh-volume DTC brands
    Triple WhaleBlended MER + first-party pixel~$129/moShopify brands
    Funnel.ioData normalization + pipeline stabilityVolume-basedEnterprise data infrastructure
    MixpanelBehavioral funnels + retention cohortsFree / usage-basedSaaS + product-led growth
    HeapRetroactive event capture~$2,000+/moTeams needing retroactive setup
    GA4Acquisition diagnostics + Google attributionFreeSmall to mid-sized teams
    SupermetricsBI pipeline automation + AI queryUsage-basedGoogle/Microsoft BI environments

    What to Look for Beyond the Demo: 3 Questions to Ask Every Vendor

    Vendor demos are designed to surface strengths and obscure gaps. Before signing, ask three questions that cut through the presentation.

    1. What specific process does this replace? If the answer is vague, the tool will go unused. It should replace something concrete — a shared spreadsheet, a manual reporting process, a channel attribution gap. No clear replacement, no clear ROI.

    2. What data does it require upstream, and what does it produce downstream? A diagnostic tool is only as good as the data feeding it. If it requires clean CRM data and your data quality is poor, the outputs will mislead rather than inform.

    3. What complexity does it remove, and what complexity does it add? Every tool introduces a hidden administrative load. The net reduction in complexity has to justify the investment — including training, integration maintenance, and the ongoing opportunity cost of managing the tool.


    AI-Native Analytics vs. Legacy Dashboards — What the Gap Actually Costs

    Traditional marketing analytics tools were built for a session-based web. A user lands on a page. A cookie fires. Attribution logic assigns credit. That model is breaking down.

    AI-powered answer engines like ChatGPT, Gemini, and Perplexity are increasingly the first point of contact between a potential buyer and a brand. According to Similarweb, searches that trigger AI Overviews have an 83% zero-click rate. No session fires. No referral header is passed. The discovery happens in an environment traditional analytics tools are architecturally blind to.

    The Attribution Black Hole Most Marketing Stacks Still Can’t See

    When a user discovers a brand in ChatGPT, the most common behavior is copying the URL and pasting it into a browser. That registers as direct traffic — not AI-referred. When a user researches options in Perplexity and then runs a branded Google search to purchase, the branded search gets the attribution credit. The AI engine that created the demand gets nothing.

    This isn’t a minor measurement gap. AI-referred visitors spend 68% more time on site than typical organic visitors. ChatGPT sessions average close to 10 minutes; Claude sessions can reach 19 minutes, compared to the standard 5-minute organic session. ChatGPT accounts for 77-87% of identifiable AI referral sessions, with Perplexity representing 12-15%.

    The brands not measuring this channel are systematically under-investing in the content and citations that drive it.

    Topify addresses this by monitoring brand inclusion upstream of the website visit — tracking how often a brand is mentioned in AI-generated answers and what sources those AI engines are citing. For teams running content or SEO programs, this shifts the optimization question from “how do I rank for keywords?” to “how do I build authority consensus across the sources AI engines trust?” That means Reddit threads, YouTube reviews, industry publications, and G2 listings — the distributed signals that AI platforms use to decide who to recommend.


    How Agencies Track 10+ Clients Without Drowning in Dashboards

    Agencies managing 10-plus clients face an exponential version of the same data problem in-house teams face. Without structured diagnostic workflows, account managers spend most of their billable hours on data wrangling — a task that adds zero strategic value to clients.

    The fix isn’t more dashboards. It’s a role-specific view architecture.

    Executive portfolio view: Aggregated metrics across the entire client roster — total spend, blended ROAS, and account health scores — allowing owners to run a quick pulse check without logging into individual accounts.

    Manager performance view: Channel breakdowns and week-over-week efficiency metrics for specific clients.

    Specialist optimization view: Granular data for daily tuning — ad set performance, keyword rankings, A/B test results.

    Standardized naming taxonomies also matter more than most agencies realize. Agencies that enforce consistent campaign naming conventions can reduce dashboard build time by over 80%, since automated tools can categorize data without human intervention. The same principle applies to data validation: automating alerts when data is more than 24 hours old or when a metric deviates more than 30% from historical range catches errors before they become client conversations.

    For agencies managing multiple brands’ AI visibility, Topify’s multi-project architecture covers the gap that traditional SEO and attribution tools leave entirely uncovered. A single account can track competitor positioning, sentiment shifts, and AI citation sources across multiple client brands simultaneously — turning what is currently a manual research task into a structured, reportable workflow.


    Before You Buy: What Vendors Won’t Tell You in the Demo

    The annual license fee is typically the smallest component of what a marketing analytics tool actually costs. Organizations that don’t account for the fully loaded cost often hit what analysts call the 2.5x multiplier — hidden expenses that exceed the visible software budget.

    Integration costs are real. Native connectors typically cover only 60% of enterprise requirements. The remaining 40% requires custom development or middleware. Custom integration can run $5,000-$25,000 per platform, with ongoing maintenance costing 15-20% of that initial investment annually.

    Skill gaps are expensive. Sophisticated diagnostic platforms require specialized internal expertise. When that expertise lives in one or two people, it creates a single point of failure if they leave.

    Vendor lock-in compounds at renewal. Initial contracts often include significant discounts. By renewal, switching costs are high and negotiating leverage is low — unless price cap clauses and exit conditions were explicitly included in the original agreement.

    Opportunity cost is the most ignored cost. Teams fighting their tools aren’t running campaigns. Every hour spent on data wrangling is an hour not spent on strategy. That’s not a line item on any invoice, but it’s often the largest number in the total cost calculation.

    Conclusion

    The tool you choose for marketing analytics is only as useful as the question it’s built to answer. Most platforms answer “what happened.” Fewer answer “why.” And almost none, until recently, have answered what’s happening in the AI search environments where high-intent discovery is increasingly taking place.

    The diagnostic gap is real, and it’s widening. Picking the right tool isn’t about features or price — it’s about matching the tool to the specific question your team needs answered. For teams losing organic ground to AI Overviews, that question is about visibility before the click. For DTC brands with complex media mixes, it’s about incrementality. For product-led SaaS companies, it’s about behavioral drop-off.

    Start with the question. Then find the tool that answers it.


    FAQ

    What’s the difference between marketing analytics tools and BI tools?

    BI tools like Tableau or Power BI are built for enterprise-wide data visualization and historical reporting. They focus on “what happened.” Marketing analytics tools are specialized for acquisition diagnostics, attribution modeling, and campaign optimization — they include marketing-specific logic like customer journey mapping and cross-channel deduplication that generic BI tools don’t have natively.

    Can small businesses afford enterprise diagnostic tools?

    Enterprise platforms like Northbeam or Heap have high entry prices in the $1,000-$2,000+/month range, but the market has become more accessible. Triple Whale starts around $129/month for Shopify brands. Topify offers a free entry point with paid plans from $99/month. Small businesses should prioritize tools with predictable, usage-based pricing to avoid the “contact us” pricing trap common with legacy platforms.

    Do I need a separate tool for AI search analytics?

    Yes — if AI-influenced channels are relevant to your category, which increasingly means most B2B and high-consideration B2C markets. Traditional analytics tools are built for session-based web tracking. They’re architecturally blind to Answer Share and citations in chat-based AI environments. Specialized platforms like Topify monitor inclusion rates and citation gaps before they translate into measurable traffic declines.

    How often should I review my marketing analytics stack?

    A formal MarTech audit every six months is a reasonable baseline. A strategic reassessment of the full “operating system” annually. The audit should specifically identify “zombie tools” — those being paid for but underutilized — and flag gaps in coverage that have opened up as the search and attribution landscape has shifted. AI search diagnostics is currently the most common gap.


    Read More