Category: Article

  • LLM Referral Traffic: How to Track Visits From ChatGPT, Copilot, and Gemini in GA4

    LLM Referral Traffic: How to Track Visits From ChatGPT, Copilot, and Gemini in GA4

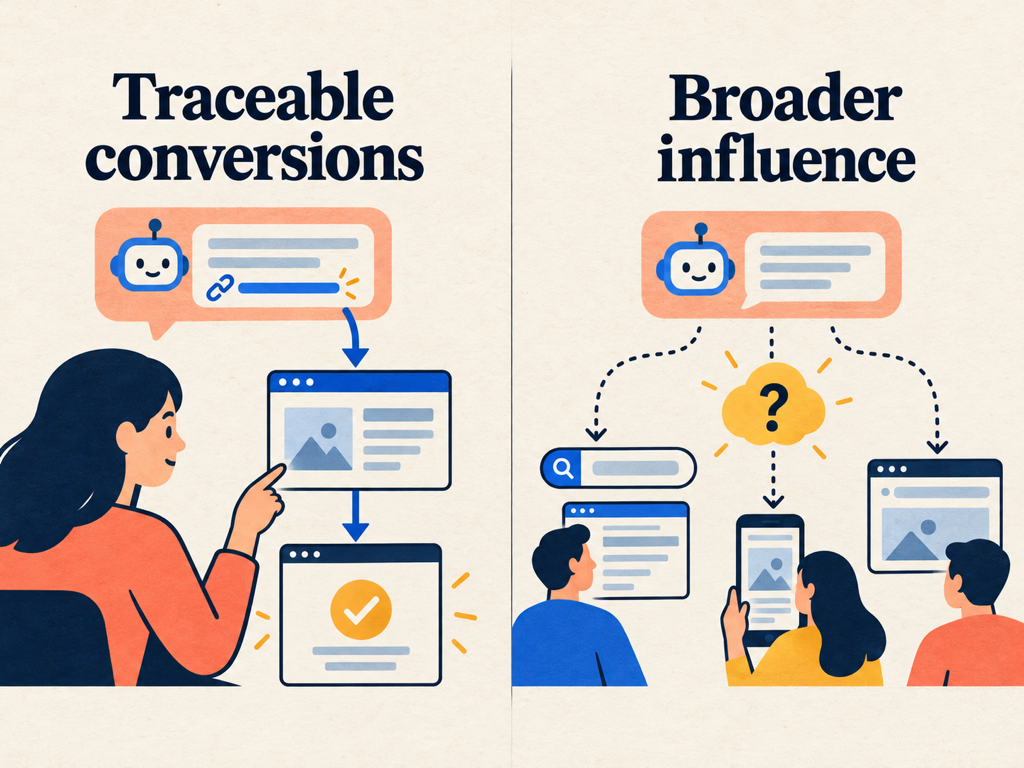
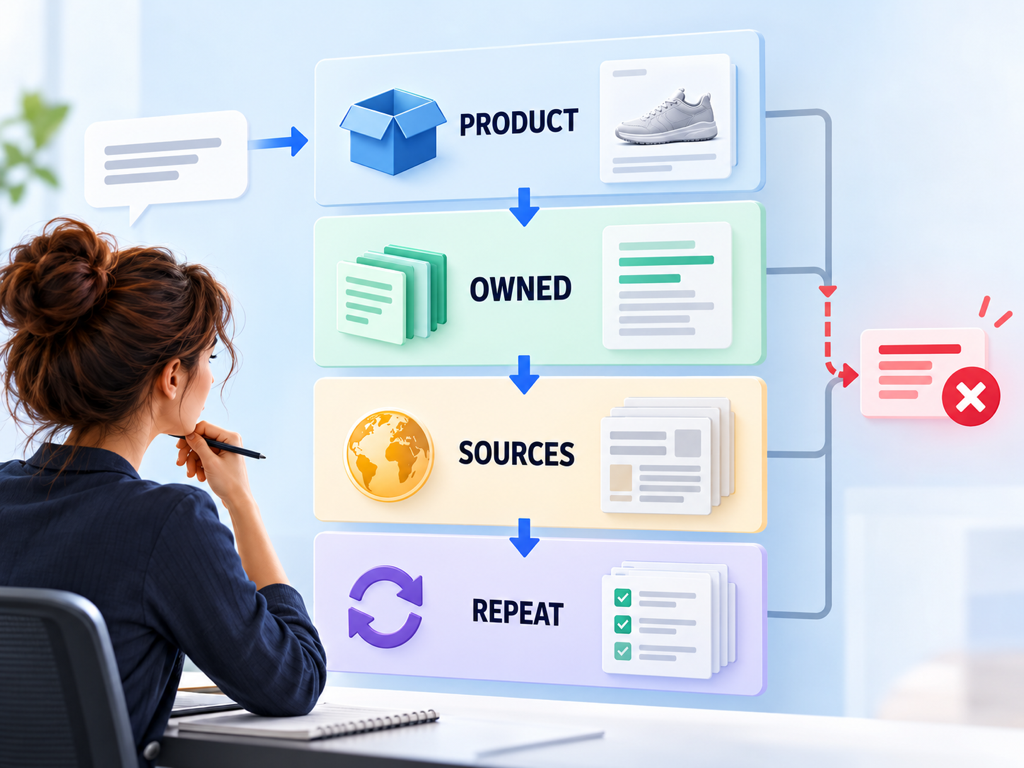
    LLM referral traffic is therefore the measurable slice of a larger AI-influenced journey. GA4 can now classify recognized assistants, and some platforms attach explicit tracking parameters. A reliable setup preserves that raw source detail, groups it consistently, and connects the sessions to meaningful events without claiming that every AI influence is visible.

    GA4 Now Includes an AI Assistant Channel

    Google Analytics added an AI Assistant category to its default channel group. Google’s current channel definition says it covers traffic from sources such as ChatGPT, Gemini, DeepSeek, Copilot, and Grok. It excludes traffic from Google’s AI Overviews and AI Mode.

    When GA4 recognizes a listed AI referrer, it sets the medium to ai-assistant and the campaign to (ai-assistant). That gives teams a standard starting point without requiring a custom regex for every known domain.

    Do not stop at the channel label. Preserve and report session source, session medium, landing page, page referrer, and relevant campaign parameters. The aggregate channel answers how much recognized AI-assistant traffic arrived. The source and landing-page dimensions explain which assistant and which content produced the visit.

    Historical classification can differ from the current channel definition. Note the date when you begin using the report and avoid presenting older periods as if the same source list had always applied.

    ChatGPT Adds an Explicit Referral Parameter

    OpenAI’s publisher FAQ says ChatGPT automatically adds utm_source=chatgpt.com to referral URLs from ChatGPT search results. Publishers that allow OAI-SearchBot can use the parameter in analytics tools to identify inbound visits.

    That parameter is useful because it remains attached to the destination URL even when browser referrer handling is inconsistent. Confirm that redirects, link shorteners, consent tools, and canonicalization do not strip the query string before the analytics tag reads it.

    Create a QA test using a non-production page or a safe internal campaign link. Verify the landing URL, GA4 Realtime, DebugView when appropriate, and the eventual session-source report. One visible parameter in the browser is not proof that the analytics session stored it correctly.

    Avoid rewriting provider-supplied parameters into your own campaign naming unless there is a documented reason. Preserve the raw value and create a reporting layer on top. That makes future audits easier when the provider or GA4 changes its classification.

    Build a Source Table Before Creating Reports

    Maintain a small reference table rather than embedding provider lists in several dashboards. It should contain the observed hostname, expected source, expected medium, paid or organic status, first-seen date, last-verified date, and evidence URL.

    FieldExample purposeValidation question
    Observed hostnamePreserve the actual referring domainDid the browser or analytics event record it?
    Normalized assistantGroup several valid hostnamesIs the mapping current and documented?
    MediumDistinguish ai-assistant, referral, or paidDid GA4 classify the session as expected?
    Landing pageIdentify cited or recommended contentIs the destination canonical and useful?
    Campaign parametersPreserve provider or paid placement tagsDid a redirect remove or overwrite them?
    First and last verifiedTrack changing behaviorWhen was the mapping last tested?
    Evidence statusMark official, observed, or inferredCan another analyst reproduce the rule?

    Review the table monthly during a new-channel rollout and quarterly once stable. Do not add a hostname because a blog post claims it belongs to an assistant. Verify it in provider documentation or your own controlled referral test.
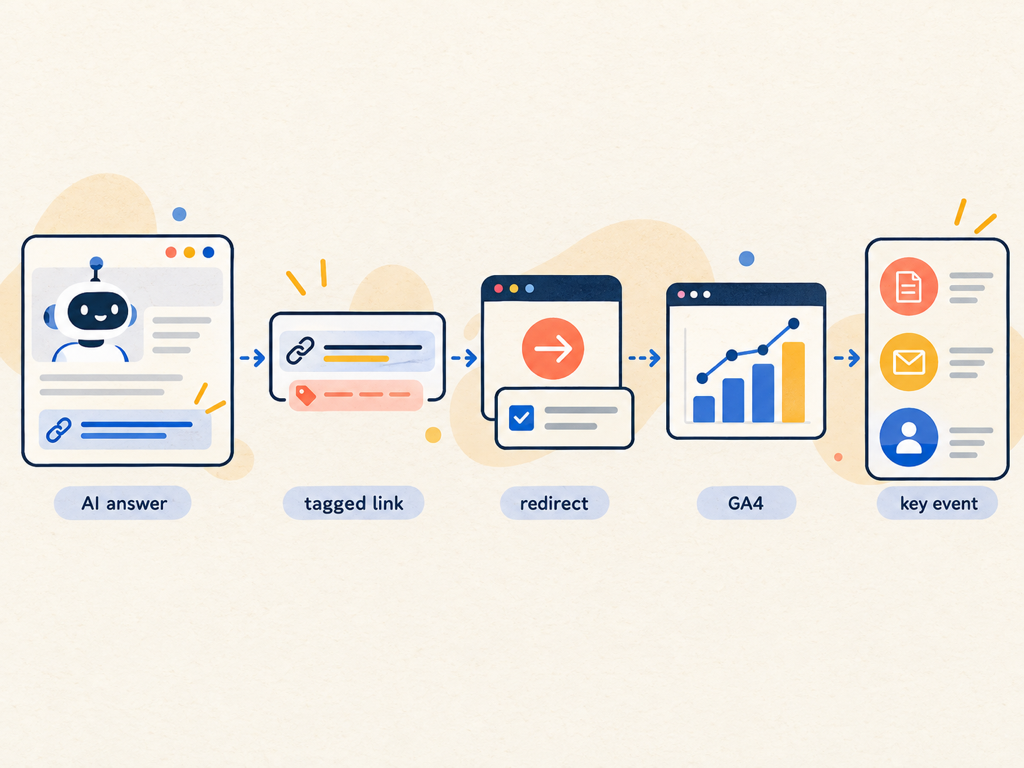
    Workflow from AI assistant link through UTM and referrer capture into GA4 session reporting

    Use Session, User, and Event Scope Deliberately

    GA4 exposes acquisition dimensions at several scopes. First user dimensions describe how the person was first acquired. Session dimensions describe the source of a specific visit. Event-scoped attribution can assign credit to key events according to the property’s reporting model.

    Google’s traffic-attribution documentation describes corresponding user, session, and event records in the BigQuery export. Mixing these scopes in one table can produce confusing totals.

    Use session scope to answer “what did recognized AI traffic do after arriving?” Use first-user scope to ask whether AI assistants introduced new users. Use event or attribution reports to analyze credit for key events. Label the scope in every chart title.

    The same visitor can first arrive through organic search, return from ChatGPT, and convert through email. First-user, session, and event reports will tell different but compatible stories.

    Mark Business Outcomes as Key Events

    Pageviews are not enough to evaluate LLM referral traffic. Define the action that represents value for the page and funnel stage.

    For SaaS, useful events may include pricing views, demo form starts, completed demos, account creation, documentation depth, and qualified pipeline creation. For publishers, use engaged reading, article completion, newsletter signup, registration, recirculation, and return visits. For ecommerce, preserve product views, add-to-cart, checkout start, purchase, and revenue.

    Google’s GA4 event guidance recommends validating events in Realtime and DebugView. Test parameters as well as event names so you can separate article, product, market, and conversion type.

    Use rates and absolute counts together. A channel with 12 conversions from 80 sessions may have an impressive rate but limited business scale. A channel with 200 conversions from 20,000 sessions may contribute more value despite a lower rate.

    Separate Observable Traffic From Unobservable Influence

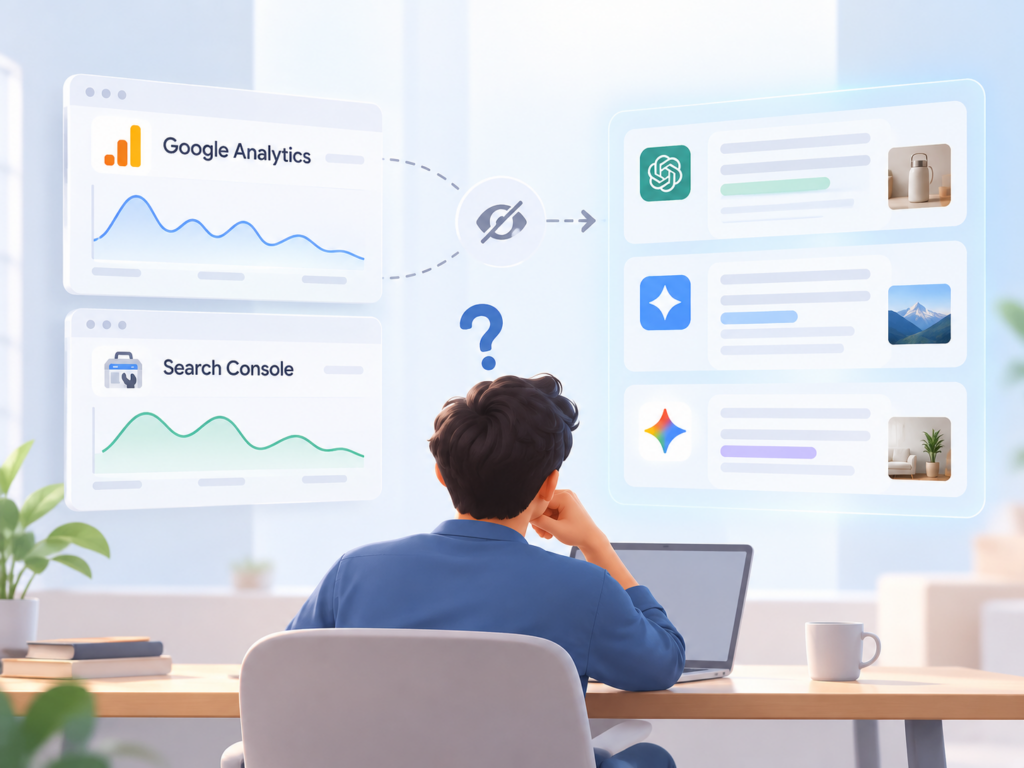
    No GA4 configuration can record an impression that happened entirely inside an AI answer. It also cannot reliably identify a person who reads an answer on one device and later types the brand URL on another.

    Classify evidence into three layers:

    • Observed referral: a session contains a recognized AI source or campaign parameter.
    • Observed on-site outcome: the session or attributed path contains defined engagement or conversion events.
    • Inferred AI influence: surveys, sales notes, branded-demand changes, answer visibility, or controlled experiments suggest an effect without a traceable referral.

    Keep inferred influence out of the referral count. Report it beside the count with its own methodology.

    Add a “How did you hear about us?” field only when the answer is operationally useful and the added friction is acceptable. Standardize options but retain an open-text choice. Sales teams should use a controlled note field for AI-assistant mentions rather than burying them in free-form call notes.

    Diagnose Landing Pages, Not Just Providers

    The landing page explains why the assistant sent the visitor. Group destinations by role: original research, comparison, product, pricing, documentation, support, opinion, or tool.

    Compare engagement and conversion within each role. A documentation page may attract high-intent technical visits that convert later. A comparison page may create immediate demo activity. An informational article may receive many visits but serve primarily as the first touch.

    Review the exact page for current facts, a clear next step, internal links, and consistency with the likely answer context. AI-referred users may arrive after completing much of their evaluation elsewhere. Repeating introductory information without offering evidence or action can waste that qualified visit.
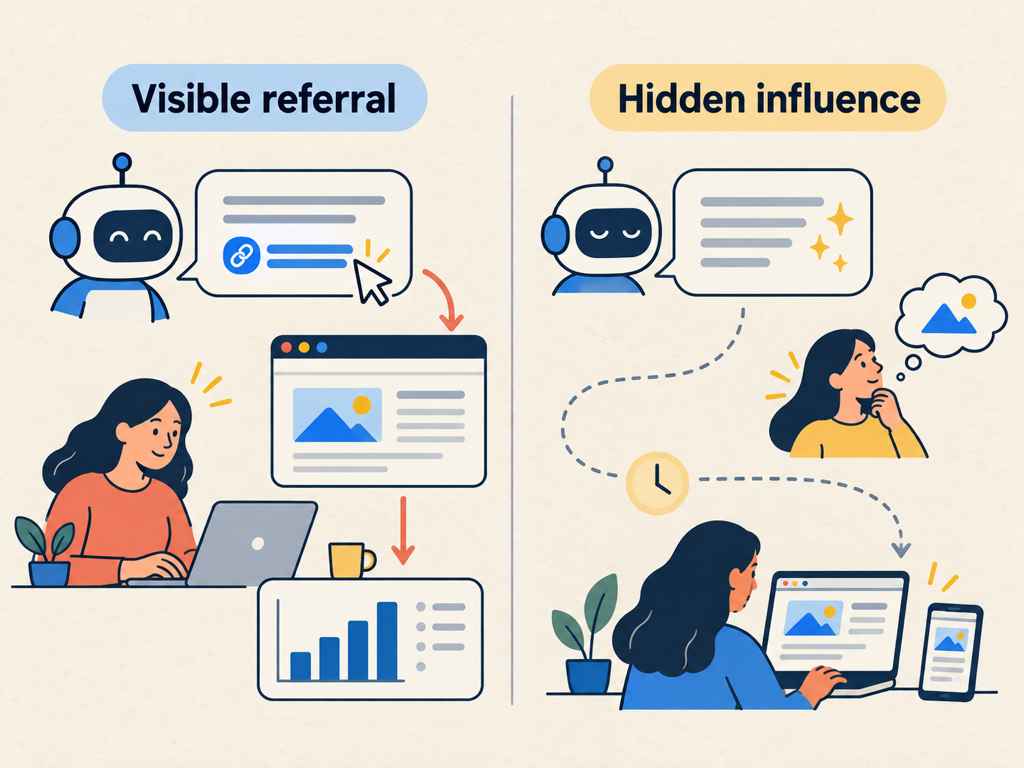
    Analyst separating visible LLM referrals from invisible zero-click and cross-device influence

    Connect GA4 With Answer-Level Visibility

    Referral analytics starts after the click. Answer monitoring starts before it. Topify can provide a controlled prompt layer showing whether the brand is mentioned or recommended, where it appears, and which sources shape the answer.

    Join the systems by time period, platform, prompt intent, cited page, and market. Do not join individual users or claim deterministic attribution when no shared identifier exists.

    A practical weekly view can include prompt visibility, cited URLs, AI Assistant sessions, engaged-session rate, key events, and conversion value. A rise in answer visibility with flat traffic may indicate zero-click influence, weak link placement, or a lag. A rise in traffic without tracked prompt visibility may come from unmonitored topics or assistants.

    Use the disagreement to improve the measurement universe.

    Create a Repeatable QA and Reporting Routine

    Run a monthly referral QA. Test known links, verify parameters survive redirects and consent flows, confirm GA4 source and medium values, check custom or default channel classification, and inspect unexplained growth in direct traffic.

    Build reports at three levels:

    1. Channel summary: sessions, users, key events, revenue or qualified outcomes.
    2. Provider and landing page: source, destination, engagement, conversion, and content role.
    3. Influence context: answer visibility, citations, self-reported discovery, and branded demand.

    Annotate changes to GA4 channel definitions, provider referral behavior, tracking consent, and site redirects. Measurement changes can look like performance changes when the chart lacks those notes.

    Conclusion

    LLM referral traffic is the measurable click stream from AI assistants, not the complete value of AI discovery. GA4’s AI Assistant channel and provider parameters such as utm_source=chatgpt.com make the visible portion easier to classify, but reliable reporting still requires source preservation, scope discipline, event QA, and landing-page analysis.

    Start with the default AI Assistant channel, preserve raw source fields, and test one complete referral path. Then connect recognized sessions to key events and report unobservable influence separately using answer visibility, surveys, and business evidence. The result is a measurement system that respects what analytics can see without pretending the invisible part of the journey does not exist.

    FAQ

    What counts as LLM referral traffic in GA4?

    It is a session attributed to a recognized AI assistant source or campaign parameter. GA4 now includes an AI Assistant default channel for supported sources.

    Does GA4 include Google AI Overviews in the AI Assistant channel?

    No. Google’s current definition explicitly excludes AI Overviews and AI Mode from the AI Assistant channel.

    How does ChatGPT identify referral traffic?

    OpenAI says ChatGPT search links automatically include utm_source=chatgpt.com, which publishers can read in analytics platforms.

    Why is reported AI traffic lower than customer survey responses?

    Many AI-influenced journeys do not create a detectable referral. They may end without a click, continue on another device, or return later through direct, search, or another channel.
    Read More

  • AI Search Attribution: Connect Citations, Brand Discovery, Website Visits, and Revenue

    AI Search Attribution: Connect Citations, Brand Discovery, Website Visits, and Revenue

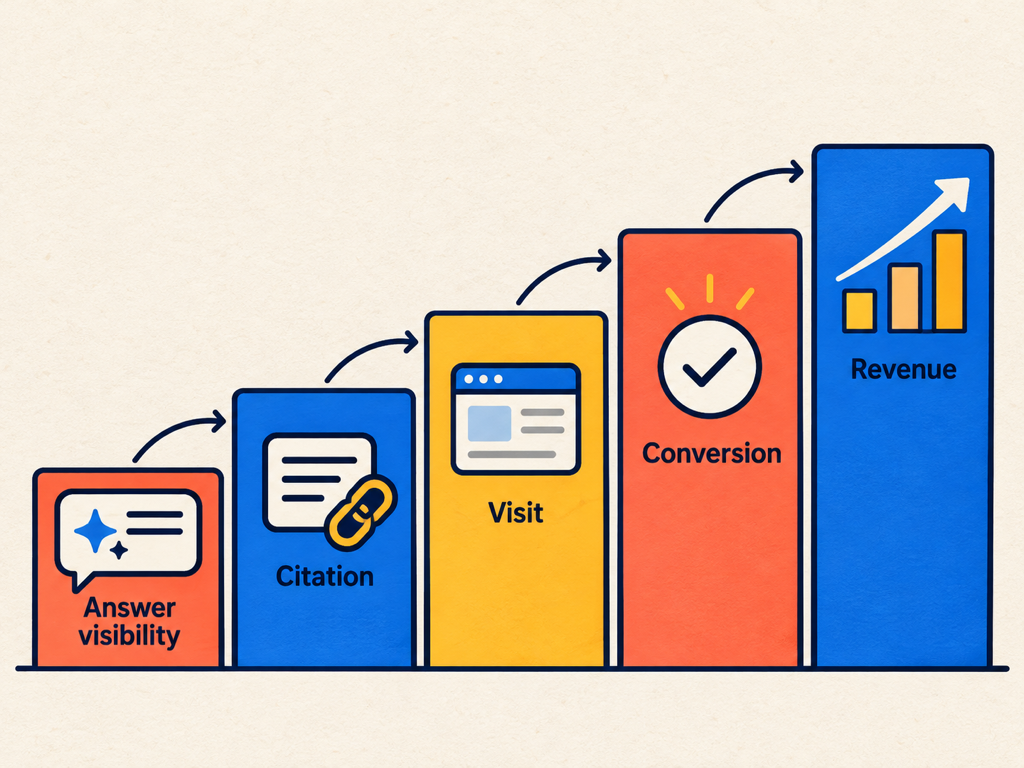
    AI search attribution has to work with that missing middle. Citations, recommendations, referral sessions, branded demand, and revenue live in different systems and at different levels of certainty. The goal is not to force them into a perfect user journey. It is to create a defensible evidence chain that shows where AI visibility influenced discovery, evaluation, and action.

    AI Search Moves Influence Upstream of the Click

    Traditional web attribution begins when a person arrives. AI search often shapes the decision before that event by summarizing options, comparing requirements, or validating a claim within the answer itself.

    Microsoft describes this as a distributed conversion journey in its AI search conversion guidance. Visibility, citations, query refinement, and answer inclusion can influence preference before the site visit. The eventual click may happen later, from a different query or device.

    This does not make attribution impossible. It changes the unit of analysis. Instead of asking “which single channel caused the conversion?” ask “which observable signals support influence at each stage, and how confident are we?”

    Use four stages:

    1. Discovery: the brand or content appears in a relevant answer.
    2. Evaluation: the answer recommends, compares, cites, or describes the brand.
    3. Visit: the person reaches an owned property through a traceable or untraceable path.
    4. Outcome: the person completes a meaningful event, enters pipeline, purchases, subscribes, or returns.

    Attribution improves when every metric is assigned to one stage rather than treated as a substitute for revenue.

    Build an Evidence Ladder Instead of One Master Score

    A master AI ROI score looks convenient but usually mixes incompatible denominators. Prompt visibility is based on a controlled sample. Citations may be aggregated by a platform. Sessions reflect only traceable visits. Revenue is observed at the account or transaction level.

    Keep the evidence separate and connect it with explicit assumptions.

    Evidence layerExample metricWhat it supportsConfidence limit
    Answer visibilityMention rate, recommendation rate, positionPresence in relevant AI decisionsDepends on prompt sample and execution conditions
    Source participationCitations, cited pages, citation shareContent used as supporting evidenceDoes not prove brand preference or clicks
    Demand responseBranded search, direct visits, self-reported discoveryPossible awareness or recall effectSeveral channels can create the same movement
    Traceable trafficAI Assistant sessions, provider UTM parametersObservable visits from AI sourcesMisses zero-click, copied, and cross-device journeys
    On-site behaviorEngaged sessions, product views, demo startsQuality and intent after arrivalDoes not reveal all prior influence
    Business outcomeQualified pipeline, purchase, subscription, revenueCommercial valueAttribution model determines assigned credit

    An executive report can summarize the ladder, but analysts should retain the raw layers. A result is stronger when two or more independent systems support the same direction.

    AI search attribution evidence ladder from answer visibility through citations, visits, and revenue

    Define the Decision and Conversion Before Collecting Data

    Attribution design should begin with the decision the report will change. A content team deciding what to publish needs topic, prompt, citation, and landing-page evidence. A growth leader deciding budget allocation needs qualified conversions, value, cost, and confidence. A publisher needs subscriptions, engagement depth, return visits, and recirculation.

    Select one primary outcome and two or three supporting events. Mark those events consistently in analytics and downstream systems. Google’s GA4 conversion reporting guidance distinguishes raw event counts from conversion reports that assign credit using an attribution model.

    Document the lookback window and model. A 30-day last-click report and a 90-day data-driven report will not produce the same credit. Changing the model mid-quarter creates a methodology break that should be annotated.

    For long sales cycles, extend the evidence chain into CRM stages. Preserve original source, recent source, self-reported discovery, relevant content touched, opportunity creation, and closed value where policy permits. Do not overwrite one field every time a new visit occurs.

    Instrument the Clickable Portion Correctly

    GA4 now includes an AI Assistant channel for recognized sources such as ChatGPT, Gemini, DeepSeek, Copilot, and Grok. Google’s definition excludes AI Overviews and AI Mode. OpenAI also says ChatGPT search links carry utm_source=chatgpt.com for referral tracking.

    Preserve session source, medium, landing page, campaign parameters, and key-event data. Validate redirects, consent flows, cross-domain settings, and payment or authentication handoffs. A broken redirect can erase the source before the first page event.

    Analyze user, session, and event scope deliberately. Google’s BigQuery attribution documentation exposes first-user, session, and event-level traffic records. First-user scope answers acquisition. Session scope answers visit behavior. Event scope supports conversion credit.

    Do not combine the three in one unlabeled trend.

    Add Answer and Citation Data Before the Click

    The upstream layer requires two kinds of observation. First-party platform reports can show aggregated citations or generative impressions. Controlled prompt monitoring can show the answer content, brand framing, source set, and competitors for a defined sample.

    Freeze the prompt universe for the measurement period. Include informational, comparison, risk, use-case, and purchase prompts that correspond to real buyer decisions. Record platform, market, language, date, and repetitions.

    Topify can provide this answer-level monitoring layer. Use it to track mentions, recommendations, position, competitors, and citations across the selected prompts. Do not present the sample as total market demand. It is a controlled observation set designed to detect change in important decisions.

    Map monitored prompts to funnel stage and destination content. A recommendation improvement for low-value educational prompts should not receive the same business weight as improvement in a vendor shortlist or requirements comparison.

    Use Three Attribution Views, Not One Winner

    Run three complementary views:

    Traceable referral view. Assign outcomes to sessions with recognized AI sources or campaign parameters. This is the most observable view and the smallest representation of influence.

    Assisted journey view. Examine paths in which AI referrals appear before later channels, using the property’s configured attribution model and lookback window. This can show participation without awarding full credit.

    Influence study. Compare changes in answer visibility and citations with branded demand, direct visits, self-reported discovery, and business outcomes. Use matched markets, pages, or time periods when feasible.

    The three views should not be added together. They overlap. Report them as a range of evidence, with traceable conversions as the floor and carefully designed influence estimates as a broader but less certain view.

    Design Tests That Improve Causal Confidence

    Simple before-and-after charts are vulnerable to seasonality, campaigns, product changes, and platform updates. Improve confidence with a comparison group.

    Choose similar topics, markets, or page groups. Apply the AI-search intervention to one group while holding the other steady. The intervention might be new original data, clearer comparison content, updated product truth, better source evidence, or improved crawl eligibility.

    Measure answer visibility, citations, traceable traffic, and the selected business outcome before and after. Record other events that could affect the result.

    The test will not create laboratory certainty because AI systems and demand continue to change. It can still produce stronger evidence than a single trend line.

    Use confidence labels:

    • High: comparable groups, stable instrumentation, repeated answer movement, traffic or demand response, and aligned business outcomes.
    • Medium: consistent movement across several layers but no strong control.
    • Low: small sample, one volatile platform, methodology changes, or timing alone.
    Measurement team comparing traceable conversions with broader but less certain AI influence

    Calculate Value Without Double Counting

    Start with the traceable floor. Multiply qualified conversions or transactions from recognized AI sessions by verified value, then subtract direct program cost when calculating return.

    For assisted journeys, use the credit assigned by the chosen analytics model rather than adding full revenue again. For influence studies, report incremental outcome differences separately and explain the design. Do not stack traceable, assisted, and estimated influence values into one total.

    Include content, tooling, analyst time, engineering, and media cost where applicable. AI-search programs often share assets with SEO, product marketing, PR, and documentation. Declare the allocation rule instead of claiming all content cost or all content value belongs to one channel.

    A useful finance table contains observed revenue, attributed revenue, estimated incremental value, cost, and confidence. The categories reveal the uncertainty instead of hiding it inside a precise ROI percentage.

    Create a Monthly Attribution Narrative

    A monthly review should answer five questions:

    1. Where did answer visibility or citation participation change?
    2. Which decision intents and pages drove the movement?
    3. Did recognized AI traffic and key events change?
    4. Did branded demand, self-reported discovery, pipeline, or revenue move in the same direction?
    5. What alternative explanation remains strongest?

    Write the conclusion in evidence order. Begin with what was observed, then state the supported inference, confidence, and next test. Avoid claiming that a citation caused revenue when the analysis only shows temporal alignment.

    Version the prompt set, analytics rules, CRM fields, and attribution model. Method changes belong on the same timeline as content and platform changes.

    Conclusion

    AI search attribution cannot reconstruct every conversation that influenced a buyer. It can build a credible chain from answer visibility and citations to observable visits, on-site behavior, and business outcomes. That chain becomes useful when each signal retains its own denominator and confidence limit.

    Begin with a defined decision and conversion. Instrument recognizable AI referrals, freeze an answer-monitoring sample, connect the systems by intent and time period, and use traceable, assisted, and influence views side by side. Then improve confidence through comparison groups and repeated observations. The best attribution model is not the one that awards AI the most credit. It is the one that helps the team make the next investment without claiming more certainty than the evidence supports.

    FAQ

    What is AI search attribution?

    AI search attribution is the process of connecting AI answer visibility, citations, referrals, on-site behavior, and business outcomes while documenting uncertainty and overlap.

    Can GA4 measure zero-click AI influence?

    No. GA4 can measure recognized visits and attributed events, but it cannot observe an answer impression that produces no site visit.

    Should AI search receive full credit for assisted conversions?

    Not automatically. Use the property’s attribution model and report assisted credit separately from traceable last-click or direct referral value.

    How can a team improve causal confidence?

    Use stable instrumentation, frozen prompt samples, comparable periods, matched topic or market groups, repeated observations, and multiple independent evidence layers.

    Read More

  • ChatGPT Product Feed Optimization: The Fields That Improve Discovery, Accuracy, and Trust

    ChatGPT Product Feed Optimization: The Fields That Improve Discovery, Accuracy, and Trust

    A product feed can pass validation and still be a poor source for a shopping answer. The item may have a title, price, and image, yet still be too vague for ChatGPT to match it to a specific request. A variant may appear available while its landing page shows a different size, color, or price. A merchant may update inventory, but the feed may remain stale for a day.

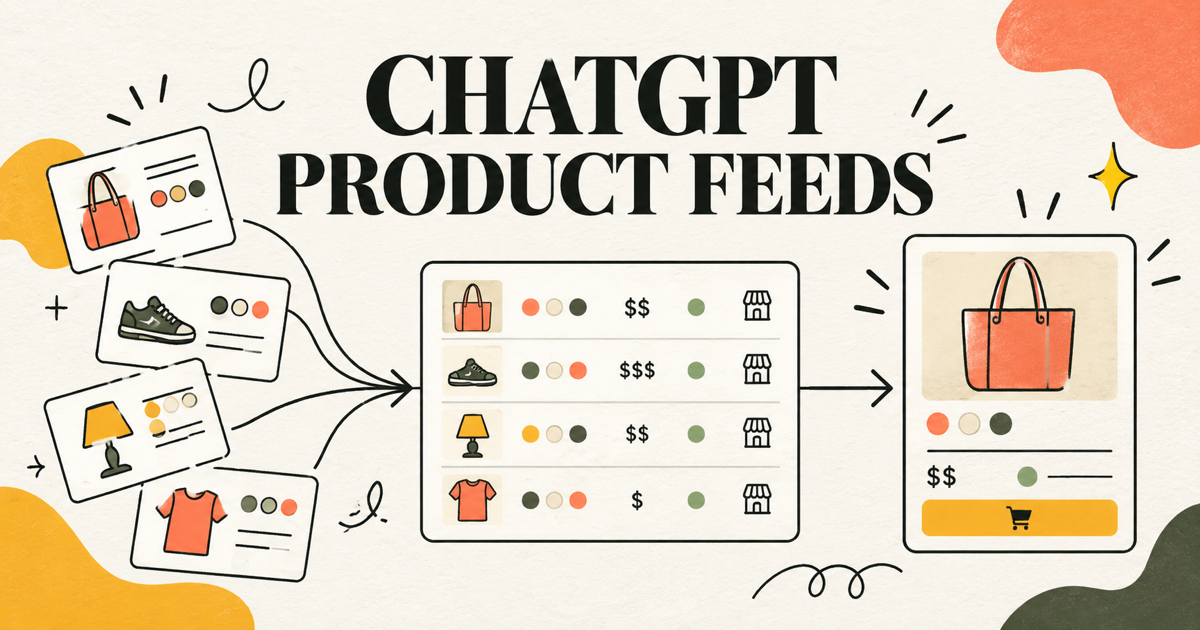
    ChatGPT product feed optimization addresses those gaps. The goal is not to stuff a feed with keywords or maximize the number of optional fields. It is to give ChatGPT accurate, current, variant-specific facts that help it understand what an item is, when it fits the shopper’s constraints, who sells it, and where the shopper can verify or buy it.

    OpenAI’s current Stable file-upload specification defines nine required fields for product discovery. Those fields are the starting contract, not the finish line. This guide explains how to improve the content, identity, freshness, and quality assurance around that contract without claiming that any feed field guarantees placement.

    Begin With the Stable Discovery Contract

    OpenAI’s Stable product feed reference says merchants should submit one row per purchasable item or variant and include nine required fields: item_id, title, description, url, brand, seller_name, image_url, availability, and price.

    Each required field resolves a different type of uncertainty.

    FieldDecision it supportsOptimization priorityHigh-risk failure
    item_idWhich exact record is this?keep it stable and uniquereusing an ID for a different item
    titleWhat product and variant is offered?name the product and selected option conciselyusing a generic parent title for every variant
    descriptionWhat is it, and what does it do?use factual, discriminating attributespromotional copy with no useful specifications
    urlWhere can the shopper verify or buy it?deep-link to the matching variantlanding on an unselected or different item
    brandWho made the product?match the visible product pageplaceholder or inconsistent naming
    seller_nameWho supplies this offer?use the merchant name users should seeconfusing brand and marketplace seller
    image_urlWhat does this item look like?show the exact variantimage color or pack size does not match
    availabilityCan it be purchased now?update from the commerce source of truthstale in-stock status
    priceWhat does this item cost?include correct amount and currencyprice differs from the destination page

    Do not optimize around the Draft schema unless you are explicitly planning for a future integration. OpenAI labels the Draft version as planning material and says to use Stable for supported file uploads. Build your production pipeline against the documented Stable contract, monitor the changelog, and treat schema migration as an intentional engineering change.

    Write Titles and Descriptions for Product Decisions

    A good product title identifies the item without turning into a search-query dump. It should include the product name and the selected variant when that distinction affects the offer. “Trail running shoes, black, size 10” is more useful than “Best lightweight outdoor performance footwear.” The first supports identification and comparison; the second is subjective and underspecified.

    Descriptions should be factual. OpenAI’s guidance recommends concise copy that helps users understand the product, while the Stable reference suggests keeping descriptions in plain text and within 5,000 characters. Lead with the attributes that change suitability: material, dimensions, capacity, compatibility, included components, intended use, or important exclusions.

    Ask whether the description can resolve a real constraint. If a shopper asks for a carry-on that fits a particular size limit, “premium travel essential” contributes nothing. Exterior dimensions, wheel inclusion, weight, and capacity do. If a buyer asks for a charger compatible with a device, connector type, power output, protocol support, and cable inclusion matter more than brand adjectives.

    Avoid claims that the product page cannot support. Do not add “waterproof,” “medical grade,” “sustainable,” or “lifetime warranty” merely because the terms may improve relevance. Feed content should match the destination page and the evidence behind the claim.

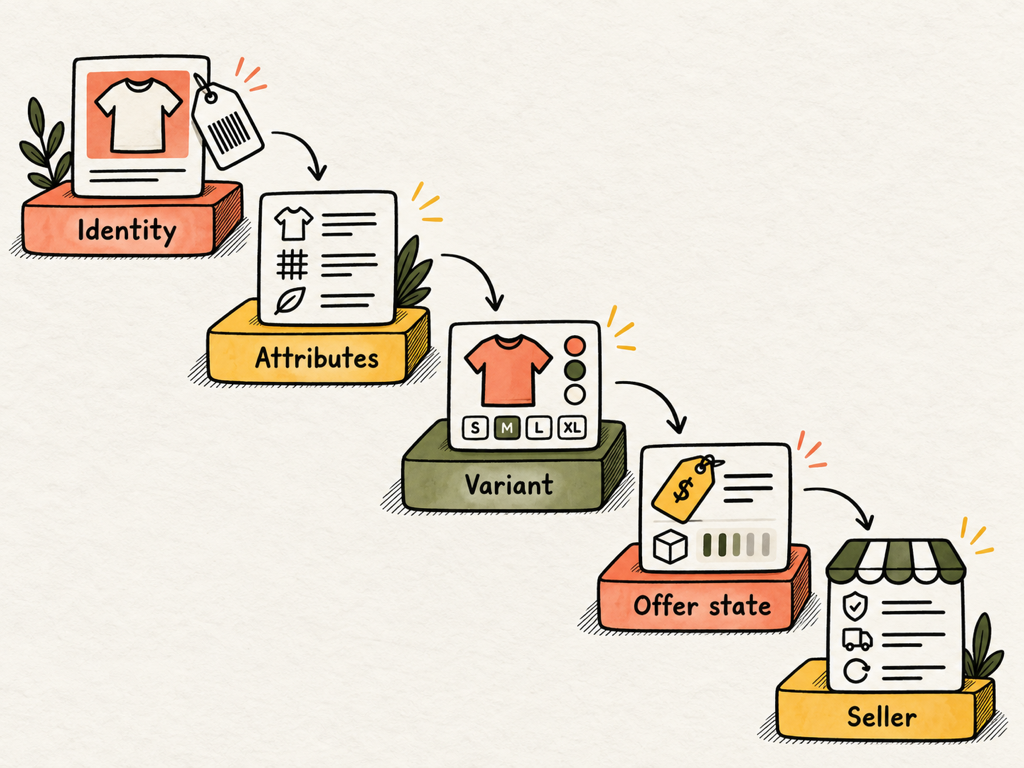
    Product feed content hierarchy showing identity, factual attributes, variant details, offer state, and seller context

    Model Variants as Purchasable Items

    Variant errors are among the fastest ways to lose shopper trust. A result may show a blue image, a black title, a size that is unavailable, and a price from the cheapest option. This can happen when a feed treats a parent product as though it were the purchasable unit.

    The Stable specification recommends one row for each purchasable item or variant. Give each selection a unique item_id, use a shared group_id for the parent listing, set listing_has_variations=true, and provide the selected options in variant_dict. Each row should carry the correct title, URL, images, price, and availability for that exact option.

    Keep identifiers stable when price, inventory, title, or imagery changes. An item ID is identity, not a version number. Do not place a price in the identifier, and do not recycle a discontinued SKU for a new product. Stable identity makes updates, reconciliation, diagnostics, and performance comparisons possible.

    The variant URL should preserve the selection when the shopper arrives. If query parameters or path segments choose the color and size, test that behavior in a logged-out session and on mobile. When the destination silently resets to a default option, feed accuracy is lost at the handoff even if the row itself is correct.

    Treat Price and Availability as Operational Data

    Titles and descriptions can change slowly. Price and inventory may change every hour. They should come from the system that controls the live offer, not from a content spreadsheet maintained by hand.

    OpenAI’s file-upload overview recommends sending a full snapshot at least daily, reusing stable filenames, and replacing the latest shard set. For large catalogs, it recommends deterministic shard assignment and approximately 500,000 items or less per shard. The same guidance notes that omission does not remove a product immediately; the most recently processed record may be retained for up to 14 days. To make an item ineligible on the next processed snapshot, set is_eligible_search=false.

    Design freshness controls around business risk:

    • Compare feed price and currency against the destination page before delivery.
    • Reject or quarantine rows with impossible prices, missing currency, or negative inventory.
    • Track the age of the source record and the age of the delivered snapshot.
    • Alert when the number of in-stock items changes outside an expected range.
    • Verify that discontinued items are disabled rather than left indefinitely as out of stock.
    • Record feed processing time so customer support can distinguish propagation delay from a catalog error.

    Availability must use a supported value. An explicit unknown state is better than asserting that an item is in stock when the source system cannot confirm it. Missing or unrecognized required availability values can cause a row to be rejected.

    Use Images and URLs to Confirm the Same Offer

    Product discovery is visual. The primary image should show the item represented by the row, including its relevant color, pattern, size, pack count, or configuration. Use a direct, public HTTPS image URL and avoid overlays that obscure the product. If a variant has its own imagery, do not fall back to a parent image that depicts a different selection.

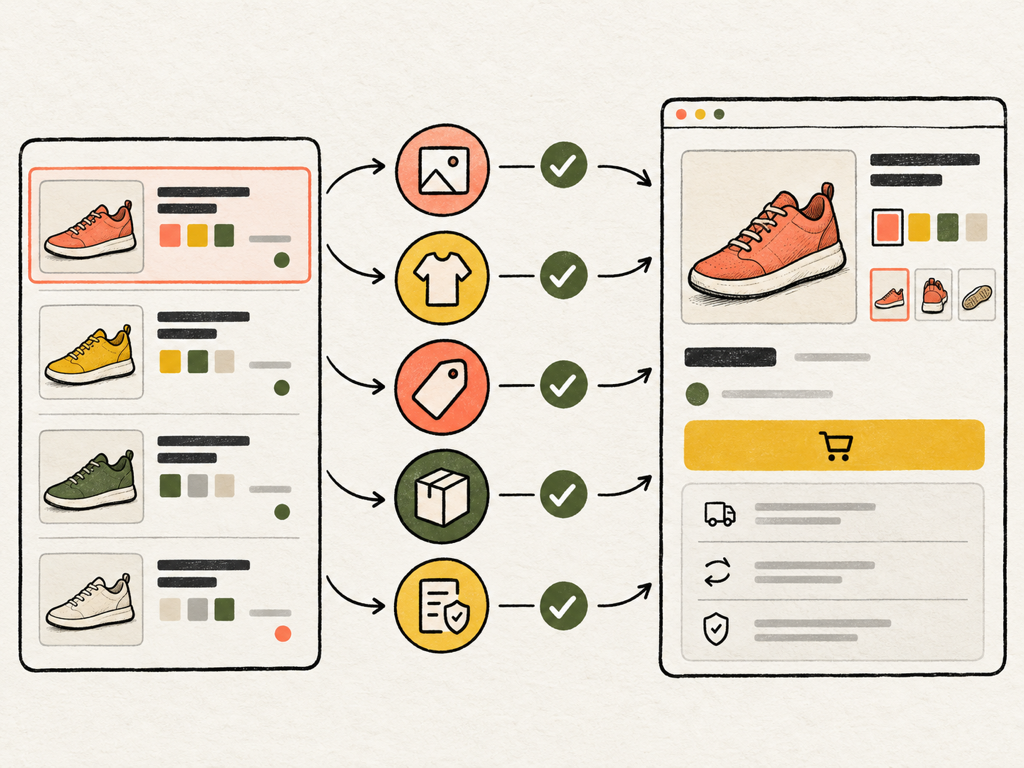
    The landing page, title, description, image, price, and availability should tell one consistent story. Build an automated sample that opens feed URLs and checks the rendered page. Confirm that the canonical product is present, the variant is selected, the price and currency agree, the product can be purchased under the stated availability, and the primary visual matches.

    OpenAI’s ChatGPT shopping documentation says product results may include information from merchants and third-party providers, and that prices or shipping updates can take time to appear. It also says merchant rankings may consider factors such as availability, price, quality, and whether the seller is the maker or primary seller. These statements do not create a guaranteed ranking formula. They do explain why consistent offer data and merchant identity matter to the shopping experience.

    Quality assurance workflow comparing a feed row with its variant landing page, image, price, availability, and seller policies

    Add Optional Fields Only When They Stay Trustworthy

    Optional fields can improve answer quality by adding categories, richer descriptions, variant options, media, seller links, shipping, returns, or reviews. They can also multiply failure modes. OpenAI’s best-practices guidance advises omitting an optional field when the transformation is brittle until the data quality is stable.

    Use optional data when it resolves a meaningful shopper question and has a reliable owner. Category paths can improve product understanding when they reflect a consistent taxonomy. Seller policy links can reduce friction when they point to durable, public shipping, return, privacy, or refund pages. Additional media can clarify angles, dimensions, or included parts when the assets apply to the exact variant.

    Do not use placeholder values such as null, unknown, or n/a unless the specification explicitly supports the value. An omitted optional field is cleaner than a string that looks like real product data. Preserve leading zeros by treating identifiers as strings. Use UTF-8, valid absolute URLs, and correctly serialized JSON objects when placing structured values inside CSV or TSV cells.

    A useful governance rule is simple: every feed field must have a source, an owner, a refresh rule, and a validation rule. If one of those is missing, the field is not production-ready.

    Build a Feed QA Scorecard Before Delivery

    Schema validation catches formatting problems. It does not prove that the catalog is coherent. Add business-level checks that compare fields across systems.

    Score each delivery across five dimensions:

    1. Completeness: What percentage of rows contain every required field and every strategically important optional field?
    2. Validity: What percentage conform to the allowed types, enumerations, currencies, and URL rules?
    3. Consistency: Do titles, variants, images, price, availability, brand, and seller match the destination page?
    4. Freshness: How old are the source record, generated snapshot, and delivered file?
    5. Distinctiveness: Do titles and descriptions contain the factual attributes needed to tell similar products apart?

    Start onboarding with a small representative sample. OpenAI recommends roughly 100 items, with all required fields present, followed by quality assurance on the first full snapshot. Include simple products, multi-variant products, sale prices, out-of-stock items, marketplace offers, unusual characters, and your largest descriptions. Edge cases are more valuable than 100 nearly identical rows.

    Keep the validation report with the delivery. It should show row counts, rejected rows, warnings, price mismatches, broken URLs, image failures, inventory anomalies, and changes from the previous snapshot. A successful upload is an operational event, not proof that every product is correct.

    Measure Discovery Without Claiming a Feed Guarantee

    OpenAI says product results are selected independently based on relevance to the shopper’s intent and context. A direct feed improves the freshness and completeness of the data available to ChatGPT, but eligibility does not guarantee that a product will display.

    Measure performance in layers. First verify ingestion health and row acceptance. Then test representative shopping prompts by category, attribute, use case, price band, and audience. Record whether products appear, whether the right variant and merchant details are shown, and whether claims match the feed and landing page. Finally, measure attributable clicks and conversions.

    Add consistent tracking parameters to product URLs if they fit your analytics policy. OpenAI’s best-practices guide gives utm_medium=feed as an example for feed-specific attribution and recommends keeping tracking parameters consistent across snapshots. Do not let those parameters change the canonical product, selected variant, or page behavior.

    Topify can be used to organize repeatable shopping prompt tests and monitor product or source visibility over time. Pair that monitoring with feed delivery logs, onsite analytics, and catalog quality data. If visibility falls, determine whether the cause is prompt relevance, an ingestion problem, a freshness failure, an incorrect variant, or wider competitive change before rewriting every title.

    Establish Ownership Across Commerce, Content, and Analytics

    Product feed optimization fails when it is treated as a one-time SEO export. Commerce operations owns price, stock, and product state. Merchandising owns taxonomy and differentiating attributes. Content teams own factual titles and descriptions. Engineering owns the pipeline, identity, delivery, and alerts. Analytics owns tracking and performance interpretation.

    Create a change process for schema updates and field mappings. Version the transformation logic, test it against a fixed catalog sample, and compare output before deployment. Monitor the official Stable specification rather than copying a community template indefinitely. When a new field becomes available, add it only after the source data and quality controls are ready.

    The durable advantage is catalog truth. A feed that reflects the real product, real variant, real seller, real price, and real availability gives a shopping system fewer reasons to guess. It also improves paid feeds, marketplace listings, onsite search, support tooling, and every other system that consumes the same product data.

    Frequently Asked Questions

    What fields are required for ChatGPT product discovery feeds?

    OpenAI’s current Stable file-upload specification lists nine required fields: item_id, title, description, url, brand, seller_name, image_url, availability, and price. Requirements can change, so production pipelines should verify the current official specification.

    Does submitting a product feed guarantee appearance in ChatGPT?

    No. A feed can make product information more accurate and current, but eligibility and successful ingestion do not guarantee display. Relevance to the user’s request and the wider shopping experience still matter.

    How often should a ChatGPT product feed be updated?

    OpenAI recommends a full snapshot at least daily for file uploads. Merchants with rapidly changing prices or inventory should design a workflow that keeps those fields as current as their approved delivery method allows.

    Should every product variant have its own row?

    Yes, when the variant is separately purchasable. Give it a unique stable item ID, connect it to the parent group, and provide variant-specific title, URL, image, price, availability, and option values.

    Read More

  • AI Prompt Gap Analysis: Find the Evidence Competitors Supply and You Do Not

    AI Prompt Gap Analysis: Find the Evidence Competitors Supply and You Do Not

    Your brand appears in a category prompt until the buyer adds one condition. Ask for a general recommendation and the model includes you. Add “for a regulated team,” “under $100,” or “with Salesforce integration,” and a competitor takes your place. A conventional content-gap report may show no obvious problem because both sites target the same keywords.

    AI prompt gap analysis starts from the answer that changed. It compares prompts, recommendations, and cited evidence to determine whether the missing piece is product fit, content, authority, or simple measurement noise. That distinction prevents a visibility problem from turning into another generic article no buyer needs.

    An AI Prompt Gap Is an Answer-Level Difference

    An AI prompt gap exists when a brand, product, claim, or source is consistently present in relevant AI answers for competitors but missing or misrepresented for your brand. The unit of analysis is not the keyword. It is the prompt and the evidence path behind the generated response.

    There are at least four different gaps that can look identical in a visibility dashboard:

    • Recommendation gap: a competitor is selected and your brand is omitted.
    • Citation gap: your brand is mentioned, but the answer relies on competitor or third-party sources.
    • Attribute gap: the system cannot confirm a feature, price, policy, integration, or qualification.
    • Narrative gap: the brand appears, but with a weaker or outdated description.

    Each gap requires a different response. Publishing more category content may help a citation gap, but it will not make an unsupported integration exist or fix an outdated return policy in a product feed.

    Prompt Gaps and Keyword Gaps Answer Different Questions

    Traditional keyword gap analysis asks which queries competitors rank for and you do not. AI prompt gap analysis asks which decisions cause an AI system to prefer, cite, or describe competitors differently.

    Analysis typePrimary unitMain evidenceBest question answeredCommon blind spot
    Keyword gapSearch query and ranking URLRankings, clicks, impressionsWhere do competitors rank that we do not?Cannot see synthesized recommendations
    Content gapTopic and page inventoryCoverage, format, depthWhich useful topic or format is missing?May assume coverage creates visibility
    Citation gapSource URL or domainLinks used in AI answersWhich sources support competitor inclusion?Citation may follow rather than cause selection
    AI prompt gapPrompt, constraints, answer, and sourcesRepeated model outputsUnder which buyer conditions do we disappear?Requires controlled, repeatable sampling

    Google’s guidance says generative features can use query fan-out to issue related searches and build a response. A single prompt can therefore expose multiple evidence gaps at once. A request for payroll software for a multinational team may require country coverage, compliance details, integrations, and pricing clarity before any brand is considered suitable.

    The practical value is diagnosis. You are not merely learning that a competitor won. You are identifying which decision condition and source pattern accompanies the win.

    Build a Controlled Prompt Set Before Comparing Brands

    A reliable gap analysis needs prompt pairs or small prompt families that change one meaningful variable at a time. Begin with one decision, such as selecting a provider or comparing products, then create controlled variants around the constraints most likely to matter.

    For example:

    1. Recommend project management software for a small agency.
    2. Recommend project management software for a small agency with client portals.
    3. Recommend project management software for a small agency under $20 per user.
    4. Recommend project management software for a small agency with SSO and audit logs.

    Keep platform, language, region, and timing consistent. Run more than one observation because generated answers can change. Store the complete response, ordered recommendations, explanation, citations, and any follow-up questions.

    Do not expand the set with dozens of cosmetic paraphrases before you understand the important constraints. More rows do not automatically produce better evidence.

    Diagnose the Gap Across Four Evidence Layers

    Once a prompt reliably produces a difference, trace it through four layers. This prevents teams from jumping from “we were absent” to “write a blog post.”

    Layer one: product truth

    Confirm whether the brand actually satisfies the condition. Check the current product, plan, geography, integration, security, and policy facts. If the competitor has a capability you do not, the result may be accurate rather than an optimization failure.

    Layer two: owned evidence

    Check whether the fact is available on a crawlable, current page. Product details hidden behind login, rendered only in an interactive widget, or mentioned vaguely in sales copy may be difficult to verify.

    Layer three: independent corroboration

    Review the external sources the answer uses. Independent reviews, directories, documentation, research, and community discussions may confirm or contradict owned claims. Do not manufacture endorsements or attempt to manipulate community content.

    Layer four: answer behavior

    Determine whether the pattern persists across repeated observations and platforms. One missing mention is a clue, not a conclusion. A stable omission tied to one constraint is much more actionable.

    Four-layer diagnostic workflow moving from product truth to owned evidence, independent corroboration, and repeated AI answer behavior.

    The layer where the evidence breaks determines the next action.

    Classify the Root Cause Before Assigning Work

    Most prompt gaps fall into a small set of root causes. Naming the cause makes the response more precise.

    True fit gap: the product does not meet the requirement. Clarify positioning or route the prompt to a better-fit use case. Do not optimize around a false claim.

    Evidence availability gap: the product fits, but the supporting information is missing, vague, inaccessible, or outdated. Improve the authoritative page or documentation.

    Source authority gap: owned evidence exists, but independent sources consistently support the competitor. The response may involve analyst relations, digital PR, review programs, or stronger original research.

    Entity ambiguity gap: the brand, product, or feature name is confused with another entity. Consistent naming, organization data, and clear product relationships may be required.

    Measurement gap: the difference disappears when prompts are rerun or controlled. Increase the sample before changing strategy.

    This taxonomy also sets a boundary. A content team should not promise to solve product fit, policy, or reputation problems with copy alone.

    Turn the Diagnosis Into a Prioritized Action Queue

    For every stable gap, record the prompt cluster, missing brand or claim, winning competitors, cited sources, root-cause hypothesis, confidence, owner, and next test. Then prioritize by business value and evidence strength.

    Decision board comparing content, documentation, authority, product, and measurement actions for different AI prompt gap root causes.

    Use a simple decision rule:

    • Create a new content asset only when the buyer decision is distinct, recurring, supportable, and not already served.
    • Improve documentation when a verifiable product fact is hard to find or explain.
    • Pursue external authority when trusted third parties repeatedly shape the answer.
    • Escalate to product or operations when the gap reflects actual fit, availability, or policy.
    • Gather more observations when the result is volatile or the sample is too small.

    The queue should include rejection reasons. “No action” is valid when the prompt has weak relevance, the answer is factually correct, or the proposed asset would duplicate an existing page.

    Measure Whether the Gap Actually Closes

    Define the baseline before changing anything. At minimum, record brand inclusion, explicit recommendation, position when ordered, cited owned pages, cited third-party domains, competitor overlap, and sentiment or framing.

    After an intervention, rerun the same prompt versions under the same conditions. Compare the stable cluster rather than adding new prompts mid-test. Allow enough time for crawling, indexing, feed refreshes, or source changes before declaring success.

    Success is not limited to “brand mentioned.” A stronger result may be a correct attribute, an owned citation, a higher recommendation position, or the removal of an outdated caveat. The metric should match the diagnosed gap.

    Google advises site owners to focus on helpful, reliable, people-first content rather than pages designed only to attract search systems. That principle applies here. The asset should resolve the buyer’s evidence need even if no AI answer changes immediately.

    Use Topify to Connect Prompt Gaps With Sources and Competitors

    Topify can make the monitoring part of this workflow repeatable. Its current Prompt Discovery page describes visibility-gap detection, competition analysis, and prompt opportunity scoring. Use those signals to identify prompt clusters where competitors appear and your brand does not.

    Then inspect the answer and citation layer rather than treating an opportunity score as a content order. Compare controlled prompt variants, review which competitors persist, and map the sources supporting their inclusion. Tag each gap with the root-cause taxonomy before assigning work.

    Keep paid or high-volume prompt activation separate from planning. Approve the exact prompt set, platforms, regions, and cadence before it becomes a recurring monitor. A smaller stable baseline is usually more informative than a large, changing collection.

    The outcome should be a defensible action queue: which evidence is missing, why that matters to the buyer, who owns the fix, and how the same prompt set will verify the result.

    Conclusion

    AI prompt gap analysis is most useful when it explains why a recommendation changes, not merely where your brand is absent. A controlled prompt set lets you connect buyer constraints to product truth, owned evidence, independent sources, and repeated answer behavior.

    Start with one decision and vary one condition at a time. Classify stable gaps as fit, evidence, authority, ambiguity, or measurement problems. Then assign the fix to the right owner and retest the unchanged baseline. That process turns an opaque AI omission into a bounded business question without filling the blog with duplicate content.

    FAQ

    What is AI prompt gap analysis?

    AI prompt gap analysis compares repeated AI answers to find prompts where competitors are recommended, cited, or described more favorably, then traces the difference to its evidence source.

    How is prompt gap analysis different from keyword gap analysis?

    Keyword gaps compare search rankings. Prompt gaps compare generated answers, buyer constraints, recommendations, citations, and supporting evidence across AI experiences.

    Does every AI prompt gap require new content?

    No. The cause may be product fit, missing documentation, weak independent corroboration, entity confusion, or sampling noise. New content is only one possible response.

    How many times should an AI prompt be tested?

    There is no universal minimum. Use repeated observations sufficient to distinguish a persistent pattern from normal variation, and keep platform, region, language, and prompt version consistent.

    Read More

  • How to Diagnose Search Console AI Performance Trends Without Guessing

    How to Diagnose Search Console AI Performance Trends Without Guessing

    An AI impressions chart moves 35 percent in a week, and the meeting immediately produces three explanations. The content team credits a new guide. The technical team blames indexing. Leadership assumes buyer demand changed. All three stories may sound reasonable, yet the chart alone proves none of them.

    Search Console AI performance diagnosis is the discipline of eliminating reporting, scope, and site explanations before assigning a business cause. The workflow matters because the new generative AI report emphasizes impressions, uses specific aggregation rules, and covers Google experiences only. A useful diagnosis ends with a supported explanation, a bounded hypothesis, or an honest “not enough evidence.”

    Start by Defining the Movement Precisely

    Do not begin with “AI visibility is down.” Restate the observation using the report’s actual scope: property, metric, period, search type, filters, and comparison window.

    A defensible statement sounds like this:

    > Property-aggregated impressions from text-based generative AI features in Google Search decreased 35 percent week over week for complete Monday-to-Sunday periods, with no page filter applied.

    Google’s Generative AI performance report currently covers impressions from supported Google Search features including AI Overviews and AI Mode. It can group data by pages, countries, devices, and dates, and separate text-based from multimodal web search.

    That scope is narrower than total AI visibility. A change does not describe ChatGPT or Perplexity, and it does not automatically represent recommendations, clicks, or conversions.

    Rule Out Reporting Artifacts Before Looking for Causes

    The fastest diagnosis is often a reporting check. Confirm that both periods are complete, use the same filters, and have the same search type. Look for preliminary data marked by a dotted line and recheck after collection settles.

    Then consult Google’s Search Console data anomalies page. Google documented a generative AI Search logging issue for August 13 through August 17, 2026, later restoring the missing impressions. A visible dip during a recorded incident is not evidence of lost demand or weaker content.

    Exports introduce another trap. Google says interface values displayed as ~ or - become zeros in downloads. Preserve suppressed or unavailable status when possible instead of treating every exported zero as a measured absence.

    Finally, verify permissions and property selection. Domain properties, URL-prefix properties, and canonical URLs can change which rows appear even when the site itself has not changed.

    Decompose the Change by Search Type, Page, Country, and Device

    Once the report passes the basic checks, find where the movement is concentrated. Move from broad to narrow without changing several dimensions at once.

    Diagnostic cutQuestion answeredStrong signalCommon mistake
    Search typeIs the change text-based or multimodal?One type explains most of the deltaCombining two different discovery behaviors
    PageWhich canonical URLs moved?A small page set accounts for the changeSumming page rows as if they equal the property chart
    CountryIs the movement geographically concentrated?One market moves while others stay stableCalling a local rollout a global trend
    DeviceIs the change mobile, desktop, or tablet-led?One device diverges materiallyAssuming device mix proves interface cause
    DateDid the shift begin on a specific day?A clear breakpoint aligns with another eventChoosing dates after seeing the desired story

    Google explains that the chart can use property-level aggregation while page tables use page-level aggregation. Multiple links from one property in a result may count differently at those levels. Diagnose contribution directionally; do not force page-row sums to equal the property total.

    Diagnostic funnel narrowing a Search Console AI impression change by search type, page, country, device, and date.

    Stop narrowing when the remaining segment is too small or unstable to support interpretation.

    Separate Demand, Eligibility, Coverage, and Reporting Hypotheses

    After locating the segment, classify plausible explanations into four buckets. This prevents one favored cause from absorbing every movement.

    Demand hypothesis: the number or mix of qualifying searches changed. Seasonality, news, product launches, and market behavior can alter opportunity even when your site is unchanged.

    Eligibility hypothesis: indexing, canonicalization, snippet controls, or technical accessibility changed whether pages could appear. Google’s AI optimization guidance ties eligibility for generative features to established Search requirements rather than a separate AI-only index.

    Coverage hypothesis: Google’s systems selected different pages or sources for the same general demand. Content freshness, competing sources, and result composition may be involved, but the impression chart alone cannot identify the exact retrieval reason.

    Reporting hypothesis: filters, thresholds, aggregation, preliminary data, or a documented incident changed what the report shows.

    Write at least one disconfirming test for each hypothesis. A diagnosis becomes stronger when it can be proven wrong.

    Build an Event Timeline Without Claiming Causality

    Create a timeline around the first visible breakpoint. Include site releases, migrations, template changes, robots or indexing changes, major content publication, product announcements, campaign activity, and known Google incidents.

    Temporal alignment is evidence for investigation, not proof of causality. A guide published two days before an increase may have contributed, but the movement could also reflect market demand or a broader feature rollout.

    Use language that matches the evidence:

    • Observed: impressions rose after the release date.
    • Supported inference: the increase is concentrated on the released page and related pages.
    • Unproven hypothesis: the new guide caused the property-wide increase.

    This distinction keeps a performance note honest while giving the team a clear next test.

    Pair GSC With Page and Answer Evidence

    Search Console tells you that links appeared. To explain why a specific page moved, add evidence from indexing checks, page changes, server logs when available, analytics, and repeated answer observations.

    For a page-level increase, ask:

    1. Was the page indexed and canonical throughout both periods?
    2. Did its content, structured data, or internal links change?
    3. Did the country or device mix change?
    4. Do repeated AI answer checks show the page or brand more often?
    5. Did relevant demand or news change during the same period?
    Evidence board combining Search Console trends, technical checks, page changes, and repeated AI answers before accepting a cause.

    An answer-level tracker can reveal mentions, citations, competitors, or positions that GSC does not expose. It still cannot substitute for Google’s first-party impression count. Use the tools as complementary evidence, not as competing versions of one metric.

    Use Confidence Levels for Every Diagnosis

    Assign a confidence level based on how many independent observations support the explanation and whether alternatives were tested.

    High confidence requires a clear breakpoint, concentrated segment, verified event, matching technical or answer evidence, and no stronger alternative explanation.

    Medium confidence has consistent direction and some corroboration but cannot isolate the cause completely.

    Low confidence describes a plausible story based mainly on timing, a small sample, or a single volatile segment.

    Report the confidence beside the conclusion. “Multimodal impressions increased after new product imagery, medium confidence” is more useful than a precise percentage paired with an unsupported cause.

    When evidence is weak, define the next observation that would raise or lower confidence. That turns uncertainty into a measurement plan.

    Create a Weekly and Monthly Operating Rhythm

    Use weekly checks for anomalies and monthly reviews for decisions. A weekly review should confirm data completeness, scan the anomalies log, compare stable periods, and flag concentrated page or market movements.

    The monthly review should refresh the baseline, examine sustained changes, connect GSC with answer-level and business data, and decide whether a technical, content, authority, or monitoring action is justified.

    Topify can add the prompt and answer layer to this workflow. Track a stable set of relevant prompts, then compare brand visibility, recommendations, position, competitors, and sources with the Google impression trend. A divergence is not automatically an error. It may reflect platform scope, prompt selection, or a change limited to Google.

    Keep the prompt set versioned. If you add prompts during the same period you are comparing, the answer-level baseline changes and the trend becomes harder to interpret.

    Conclusion

    Search Console AI performance trends are signals to diagnose, not stories that explain themselves. Start by stating the movement with its full scope, rule out reporting artifacts, and decompose it one dimension at a time. Then test demand, eligibility, coverage, and reporting hypotheses against technical, page, and answer-level evidence.

    The final output should separate observation, inference, and hypothesis, include a confidence level, and name the next test. That approach may produce fewer dramatic explanations, but it gives content, SEO, and leadership teams a shared basis for action without mistaking correlation for cause.

    FAQ

    Why did Search Console AI impressions suddenly drop?

    Possible causes include demand changes, page eligibility, source-selection changes, filters, preliminary data, aggregation, or a documented reporting incident. Check reporting conditions before assigning a content cause.

    How long should I wait before analyzing recent data?

    Avoid treating dotted preliminary values as final. Recheck after Search Console finishes collecting the period and compare complete equivalent windows.

    Can page rows explain the property-level change exactly?

    Not always. Google uses different aggregation rules at property and page levels, so page-row totals may not equal the chart total.

    Can Topify confirm why a GSC AI trend changed?

    Topify can add prompt-level mentions, recommendations, competitors, position, and citation evidence. It cannot see Google’s internal reporting systems, so the combined evidence supports a diagnosis rather than absolute proof.

    Read More

  • How to Run a Multimodal Content Audit for Google Lens and AI Search

    How to Run a Multimodal Content Audit for Google Lens and AI Search

    A page can contain sharp product photography, complete copy, and valid schema while still failing as a multimodal result. The image may be loaded only as CSS, the useful detail may be cropped on mobile, the filename and alt text may describe nothing, or the landing page may omit the attribute a visual searcher needs to act.

    A multimodal content audit tests the entire image-page pair. It checks discovery, interpretation, evidence, mobile presentation, structured data, and measurement in one repeatable process. The outcome is not a count of images. It is a prioritized list of visual decisions your site can or cannot currently answer.

    Define the Visual Decisions Before Crawling the Site

    Start with the jobs people perform using an image. Common decisions include identifying an object, finding a similar product, comparing variants, diagnosing a problem, locating a place, or buying under a constraint.

    Choose the pages and image types that support those decisions. An ecommerce audit might sample product detail pages, category pages, buying guides, and support content. A travel audit might sample destination pages, maps, seasonal guides, and local listings.

    Record the intended query for every sampled image. “Blue shoe” is a label; “find this trail shoe in a wide size under $150” is a decision. The second reveals which page attributes the audit must verify.

    Check Whether Crawlers Can Discover the Image

    Google’s image SEO guidance recommends standard HTML <img> elements and notes that CSS background images are not indexed in the same way. Inspect the rendered page and source to confirm an accessible src exists, including a fallback when responsive srcset or <picture> markup is used.

    Test the page and image URL without authentication. Review robots rules, noindex, CDN restrictions, expiring URLs, lazy-loading behavior, and status codes. Confirm that canonical tags point to the intended destination and that image URLs remain stable across releases.

    For large libraries, inspect the image sitemap and CDN property setup. Discovery problems are technical blockers; do not compensate for them by rewriting captions.

    Audit Meaning, Context, and Accessibility Together

    Review alt text as a description of content and function, not a keyword field. It should help someone understand what the image contributes when the pixels are unavailable. Decorative images can use empty alt text; meaning-bearing images need specific, concise descriptions.

    Then inspect the visible context. Google’s guidance says page content, captions, titles, alt text, and computer vision can all contribute to understanding. The image should sit near text that names the entity and explains the relevant attributes.

    Use the same test for charts, product photos, and screenshots: can a reader identify the subject, understand why the image is present, and find the facts needed to act?

    Audit workflow moving from image discovery to meaning, page evidence, mobile presentation, structured data, and measurement.

    Avoid repeating a title as alt text when it adds no visual description. Also avoid embedding essential specifications only inside the image. Important facts belong in crawlable page text.

    Score Every Image-Page Pair Against One Rubric

    Use a consistent rubric so teams can compare pages and assign owners. A pass should mean the evidence is visible and verifiable, not merely present somewhere in the CMS.

    Audit dimensionPass conditionTypical failureOwner
    DiscoveryCrawlable page and stable HTML image URLCSS-only image or blocked CDNEngineering
    IdentitySubject and entity are unambiguousGeneric filename and no contextContent
    AccessibilityUseful alt text matches functionMissing, stuffed, or duplicated alt textContent / accessibility
    EvidenceRelevant attributes appear in visible textSpecs exist only in pixels or tabsProduct / content
    QualityDetail is clear at useful sizesBlur, heavy compression, misleading cropCreative
    MobileSubject and controls remain usableObject or caption disappears on mobileDesign / engineering
    Structured dataMarkup matches visible truthConflicting price, image, or availabilitySEO / engineering
    MeasurementPage and image changes can be trackedNo baseline, annotation, or report viewAnalytics

    Score blockers separately from improvements. A blocked image URL is more urgent than a filename that could be clearer.

    Inspect Image Quality and Variant Coverage

    Open the actual files, not only thumbnails in the CMS. Check resolution, compression artifacts, orientation, color accuracy, readable labels, and whether the focal subject survives responsive crops.

    For product pages, verify that the set covers scale, material, key details, available variants, and use. For troubleshooting, include both normal and failed states. For places, include recognizable viewpoints and seasonal or access conditions when they affect the decision.

    Reject deceptive or decorative variants that do not match the landing-page offer. Visual similarity may bring a user to the page, but inconsistent color, size, availability, or product identity breaks trust immediately.

    Google advises using representative, high-resolution preview images and avoiding extreme aspect ratios or generic images. Record which asset is declared in structured data and social metadata, then confirm it is the image the team actually wants associated with the page.

    Test the Mobile and Interaction Path

    Many visual searches begin on a phone. Audit at realistic mobile sizes and network conditions. Confirm that the image loads, the object remains visible, pinch or gallery controls are usable, captions stay associated, and the next action does not shift off screen.

    Inspect lazy-loaded galleries and carousels. Essential images should be discoverable without fragile interaction, and the fallback markup should remain meaningful. Test the page with scripts delayed or partially unavailable to expose hidden dependencies.

    Side-by-side audit showing a passing mobile image-page pair and a failing version with cropped subject, hidden attributes, and broken context.

    Measure layout stability and transfer cost, but do not optimize away the details required for recognition. The goal is a fast, useful visual, not the smallest possible file.

    Validate Structured Data and Product Feeds

    Use the appropriate validation tools for supported structured data. Confirm that image properties resolve, required fields exist, and markup agrees with visible content. Structured data does not guarantee a feature, but inconsistent markup creates avoidable ambiguity.

    For commerce, compare the page, Product markup, and merchant feed. Check identifiers, titles, descriptions, price, currency, availability, variants, shipping, return information, and image links. A visual result that lands on an unavailable or mismatched variant is a failed experience even if the image was retrieved correctly.

    Document the source of truth for each attribute and the expected refresh cadence. Conflicts often come from systems updating at different times rather than from one obviously incorrect page.

    Establish a Search Console Multimodal Baseline

    Google introduced web multimodal reporting for Lens, Circle to Search, uploaded images, and Chrome image search. Use the Web: multimodal filter in applicable Performance reports, then export a complete baseline before making changes.

    Record pages, countries, devices, dates, active filters, and property-level totals. Search Console does not reveal every submitted image or exact visual query, and page rows may aggregate differently from the chart. Treat impressions as property exposure under Google’s rules, not market-wide visual demand.

    Annotate audit fixes and compare equivalent complete periods. Pair GSC with image indexing checks, analytics landing-page outcomes, and support or sales evidence. A rising impression line is useful, but it does not prove the image answered the user’s decision well.

    Prioritize Fixes by Blocker, Decision Value, and Confidence

    Create a queue with page, image, intended visual decision, failure, evidence, owner, effort, and verification method. Prioritize in this order:

    1. Crawl and eligibility blockers.
    2. Wrong or misleading product and entity information.
    3. Missing decision-critical evidence.
    4. Mobile and performance failures.
    5. Context, accessibility, and asset-quality improvements.
    6. Nice-to-have naming or presentation refinements.

    Topify can add a prompt-level layer for the conversational questions surrounding those visual decisions. Monitor whether the brand and relevant pages appear in supported AI answers, while keeping Google’s private multimodal impression data in Search Console.

    Do not activate a large prompt set simply because the audit found many images. Start with a small approved set tied to high-value decisions and preserve the baseline long enough to measure change.

    Conclusion

    A multimodal content audit succeeds when it connects a visual input to a useful, verifiable destination. Discovery, alt text, image quality, mobile presentation, structured data, and reporting are parts of one system rather than separate checklists.

    Begin with the decisions users make from images, sample the pages that serve those decisions, and score each image-page pair with one rubric. Fix blockers and factual mismatches before polishing filenames or decorative assets. Then establish a Search Console multimodal baseline, annotate changes, and verify outcomes with both first-party exposure and on-site behavior.

    FAQ

    What is a multimodal content audit?

    It is a structured review of how images and landing pages support visual-plus-language search, including discovery, context, accessibility, attributes, structured data, mobile usability, and measurement.

    Which pages should be audited first?

    Start with high-value pages where users identify, compare, troubleshoot, visit, or buy from visual information, plus pages already receiving image or multimodal exposure.

    Does every image need descriptive alt text?

    Meaning-bearing images need useful alt text. Purely decorative images can use empty alt text so assistive technology can skip them.

    How do I measure the result of an audit?

    Use Search Console’s multimodal reporting where available, image indexing checks, page engagement or conversion data, and a dated log of the fixes applied.

    Read More

  • Publishers Are Buying Back Zero Click Search Traffic. Here’s the Math

    Publishers Are Buying Back Zero Click Search Traffic. Here’s the Math

    Your Google sessions are down a quarter from last year, and the rankings in your SEO report haven’t moved. Same positions, same keywords, fewer visits. Now finance wants to know if paid search can plug the hole, because that’s what the largest publishers are doing.

    Run the numbers before you sign off. The clicks you’d be buying cost more every year. The audience you lost didn’t disappear, either. It read the answer on the results page and never came to your site. That’s zero click search traffic in practice, and buying it back is a harder trade than it looks.

    $113 Million a Month to Rent Back Traffic Google Used to Send Free

    Here’s the number that started this conversation. The hundred largest media publishers spent an estimated $113 million on paid search in July 2026, according to Similarweb data reported by Adweek. That’s up 41% from a year earlier and 274% from three years ago.

    The spending is heavily concentrated. Forbes alone accounted for $72.2 million, roughly two thirds of the total, and the New York Times more than doubled its spend to $11.3 million.

    The motive is just as clear. Organic search traffic fell 26.7% year over year at Forbes, 28.9% at CNN, and 24.1% at USA Today. Similarweb’s David Carr said the pay-per-click surge has been building since about April.

    They aren’t buying growth. They’re buying back a baseline.

    The Zero Click Search Traffic Math Nobody Puts in the Deck

    The headline figures hide a more useful number: what each purchased visit actually costs. The July budgets bought 23.7 million visits, up 39% year over year and 148% over three years. Working backward from those growth rates gives you a cost-per-visit trend:

    PeriodEst. Paid Search SpendEst. Paid VisitsEst. Cost per Visit
    July 2023~$30.2M~9.6M~$3.16
    July 2025~$80.1M~17.1M~$4.70
    July 2026$113M23.7M~$4.77

    The 2023 and 2025 figures are derived from the reported growth percentages, so treat them as directional.

    Two things stand out. First, a bought visit costs about 51% more than it did three years ago. That’s what a crowded auction looks like: every publisher replacing lost organic traffic bids into the same inventory, so the clearing price rises for all of them.

    Second, the year-over-year cost per visit is nearly flat. This year’s pain isn’t mainly price. It’s volume. Publishers are buying far more visits at roughly the same rate, which means the bill scales directly with how much organic traffic keeps leaking.

    Now test whether a single visit can pay for itself. Say a paid visitor only monetizes through display ads. At an illustrative $30 RPM, earning back $4.77 takes about 160 pageviews from that one visitor. Almost nobody reads that much.

    That’s why the arbitrage only works on certain queries. Media consultant Scott Messer pointed out that publishers are targeting high-yield commerce keywords where the math holds up. U of Digital’s Shiv Gupta took the opposite view: the ad money flows straight back into the system that’s cutting publisher referrals. Both can be true at once.

    The Organic Units That Used to Pay Out Are Closing

    Paid search is becoming the default because the free click supply keeps shrinking.

    People Also Ask is a good example. It was one of the last large organic units still sending clicks to third-party sites. AlsoAsked’s Mark Williams-Cook analyzed roughly 19.2 million English queries and found AI-generated PAA answers rose to 86% in August and 97% by early September. Allintitle recorded 100%. Fourteen months earlier, the share was about 12%. Search Engine Roundtable covered the shift in detail.

    The click behavior follows. Pew Research found that users clicked a traditional result in 8% of visits when an AI summary appeared, versus 15% when none did. Clicks on links inside the summary itself happened in just 1% of visits. Sessions also ended outright more often after an AI summary: 26% compared with 16%.

    Zoom out and the pattern holds. In the Similarweb clickstream panel analyzed by SparkToro, 68.01% of Google searches in the first four months of 2026 ended without a click. Smaller sites have been hit harder, with one analysis finding small publishers lost 60% of their search traffic.

    The organic unit that once handed out clicks now answers the question in place. The ad auction on that same page is the only place left to buy the visit back.

    Forbes Can Fund This. Most Brands Can’t.

    Take Forbes out of the July total and the other 99 publishers split roughly $41 million. The New York Times accounts for $11.3 million of that. Everyone else is working with a much thinner budget.

    If you’re a SaaS company, a B2B brand, or an ecommerce team that built its funnel on informational content, you’re exposed to the same click loss without the same buying power. Your how-to guides and comparison posts are exactly the queries AI answers resolve on the page.

    The publishers with the most at stake are already changing how they’re organized. Digiday reported that USA Today Co. is building an audience and digital production team of 23 to 30 people. The New York Times moved an executive into a role overseeing AI and off-platform discovery, and the Washington Post created its first head of SEO and AI discovery.

    That’s the signal worth copying. The response isn’t only a bigger ad budget. It’s someone who owns how your brand shows up in answers.

    What Zero Click Search Traffic Is Still Worth When Nobody Clicks

    A search that ends without a click isn’t worthless. A brand can still shape consideration by appearing in an AI Overview, a generative answer, or a cited source, even if the user never lands on its site.

    The problem is that your analytics can’t see any of it. Google Analytics records sessions. Search Console records clicks and impressions for blue links. Neither tells you whether ChatGPT named you when someone asked for a recommendation, or whether Perplexity cited your research or a competitor’s. So a team can lose half its organic traffic, keep a strong presence in AI answers, and still report the quarter as a pure loss.

    You need a different set of metrics:

    • Mention rate. How often your brand appears across a fixed set of prompts.
    • Citation share. Which domains AI platforms cite for your topics, and how often yours is one of them.
    • Position. Where you land in a recommendation list relative to competitors.
    • Sentiment. Whether the answer describes you the way you’d want.

    Bottom line: if you’re going to pay $4.77 for a click, you should first know what you’re already getting for free in the answer.

    Tracking the Visibility That Never Shows Up in Analytics

    This is the gap AI visibility platforms are built to close. Topify is one option worth evaluating if your team is seeing a gap between stable rankings and falling sessions.

    Topify tracks brand performance across ChatGPT, Gemini, Perplexity, Google AI Overviews, DeepSeek, and other major AI engines. It uses seven metrics: visibility, sentiment, position, volume, mentions, intent, and CVR. In practice, that turns “our traffic dropped” into a more useful question: did we lose the click, or did we lose the answer too?

    Source Analysis is the most relevant feature for a buy-back decision. It shows which domains and URLs AI platforms cite for your prompts, so you can see whether your content, a competitor’s page, or a Reddit thread is shaping the answer. If you’re already cited, paying for the click may be optional. If you’re absent, the fix is earning the citation, and ads won’t do that for you.

    Prompt discovery and AI Volume Analytics help you decide where money should go at all. Some prompts carry real commercial intent and justify paid spend. Others are informational, and there you’re better off earning presence in the answer. CVR adds an estimate of how likely an answer is to lead the user toward engaging with your brand.

    For scale, the Basic plan runs $99 a month with 100 tracked prompts and a 30-day trial. That’s about the cost of 21 paid visits at July’s publisher rate. The Pro plan covers 250 prompts at $199 a month.

    Before You Buy Back a Single Click, Answer These Four Questions

    Does the query still convert after the click?

    Commerce and subscription queries can support a $4-plus visit. Ad-funded informational pages usually can’t. Map spend to queries with a real downstream conversion.

    Is your content already cited in the answer?

    If AI Overviews and chat assistants cite you, part of the value is already reaching the user. Measure that before you pay to reach them again.

    Who owns the answer right now?

    If a competitor or a third-party review site dominates the citations, bidding on the click won’t change what the user reads first. Earning those citations will.

    What’s your cost ceiling per visit?

    Set it before the auction sets it for you. Price per visit rose about 51% in three years, and nothing on the supply side suggests that trend reverses.

    Conclusion

    Publishers didn’t choose paid search because it’s efficient. They chose it because the organic clicks stopped coming and the auction was the fastest way to fill the gap. Spend is growing faster than visits, and each visit costs noticeably more than it did in 2023.

    For most brands, copying that playbook at scale isn’t realistic. The better first move is to measure where the value went: into AI answers, citations, and recommendations that never show up as a session. Once you can see that layer, you can decide which clicks are worth buying and which answers are worth earning. You can start tracking your AI visibility here.

    FAQ

    Q: What is zero click search traffic?
    A: It refers to searches that end without a visit to any website, usually because the answer appears directly on the results page through AI Overviews, featured snippets, or People Also Ask. One Similarweb panel put the zero-click share at 68.01% of Google searches in early 2026.

    Q: Why are publishers spending more on paid search?
    A: They’re replacing organic traffic lost to AI answers. The top 100 publishers spent about $113 million on paid search in July 2026, while organic traffic at Forbes, CNN, and USA Today fell by roughly 24% to 29% year over year.

    Q: Is buying back search traffic profitable?
    A: It depends on the query. At an estimated $4.77 per visit, the math tends to work only when the visitor converts through commerce or a subscription. Display-ad-funded visits rarely generate enough revenue to cover the cost.

    Q: How can brands measure visibility that doesn’t generate clicks?
    A: Track mention rate, citation share, position, and sentiment across a fixed set of prompts on major AI platforms. Traditional analytics only capture sessions, so you’ll need a dedicated AI visibility tool to see presence inside answers.

    Read More

  • Brand Analysis AI: How to Read Sentiment, Not Just Mentions

    Brand Analysis AI: How to Read Sentiment, Not Just Mentions

    Your monthly report says your brand appeared in 62% of tracked AI answers, up from 48% last quarter. Leadership is happy. Then a sales rep forwards a screenshot: ChatGPT did mention you, but only after naming your competitor as the enterprise standard, and it described you as a decent pick for smaller teams.

    Same mention. Opposite message.

    Counting appearances tells you AI knows your brand exists. It doesn’t tell you whether AI is selling you or quietly steering buyers somewhere else. That’s the real job of brand analysis AI: reading how you’re described, not just how often.

    Your Mention Count Went Up. That Might Be Bad News.

    Mention rate is the easiest AI metric to report and the easiest to misread. It treats a glowing recommendation and a lukewarm aside as identical data points.

    The scale of the blind spot is bigger than most teams assume. In one large dataset, 80.6% of AI brand mentions were classified as neutral, and positive mentions outnumbered negative ones by nearly 18 to 1. So the bulk of your “visibility” sits in a gray zone that a simple count can’t interpret.

    Negative mentions are rarer, but they behave differently than on a search results page. BrightEdge found Google AI Overviews surfaced negative sentiment in roughly 2.3% of brand mentions, versus about 1.6% for ChatGPT, and noted that a negative AI response gets served again to every user asking a similar question.

    A bad review on page two gets skipped. A bad sentence in an AI answer gets repeated.

    What Brand Analysis AI Actually Reads in an Answer

    Good AI sentiment analysis works at the phrase level, not the answer level. The question isn’t “was the brand mentioned?” It’s “what job did the answer assign to the brand?”

    Here’s how the same mention can carry very different weight:

    Answer phrasingCounts as a mention?What it actually signals
    “X is the go-to choice for this use case”YesStrong positive, primary recommendation
    “X could work, though you may also want to consider Y”YesHedged, buyer is being redirected
    “X offers basic features compared to Y”YesNegative by comparison, no negative words used
    “X is a cheaper alternative”YesPositioning drift if you sell premium
    “X had a data breach in 2024”YesControversy framing, top-of-funnel risk

    Every row scores the same on a mention dashboard. Only one of them is helping you.

    That comparative row matters more than it looks. Analysts tracking Claude’s answers note it often expresses sentiment through comparison, so a line that positions a brand as lesser than a rival works as a negative signal even when no negative words appear. Keyword-based sentiment scoring misses this almost entirely.

    Neutral Isn’t Safe: Where Brand Sentiment Hides

    Most teams treat “neutral” as a pass. In practice, neutral often means AI mentioned you without giving the buyer any reason to pick you.

    There are three places sentiment tends to hide:

    Hedges and qualifiers. Words like “could,” “might,” and “worth considering” signal uncertainty. They rarely trigger a negative flag, but they soften intent at exactly the moment a buyer is deciding.

    Attribute framing. Tone is only one layer. Brand perception also covers attributes, audience fit, objections, comparisons, factual accuracy, and answer position, and a brand can show up often while being framed as expensive or hard to implement. If AI keeps attaching “steep learning curve” to your product, that’s a sentiment problem wearing a neutral label.

    Factual errors. Some of what AI says about you simply isn’t true. A 2026 arXiv preprint found that 11.0% of 98,020 atomic claims in Google AI Overviews weren’t supported by the pages they cited. That’s why sentiment work needs a fact-check layer, not just a tone score.

    ChatGPT and Google Don’t Criticize the Same Brands

    If you’re running brand analysis AI on a single engine, you’re seeing a fraction of the picture. The engines don’t just differ in volume. They differ in when and why they turn negative.

    In BrightEdge’s analysis, Google AI Overviews was 44% more likely to surface negative brand sentiment than ChatGPT overall, yet ChatGPT concentrated its criticism about 13 times more heavily near the point of purchase. Specifically, 19.4% of ChatGPT’s negative sentiment landed in the consideration-to-purchase phase, compared with 1.5% for Google.

    The triggers split, too. Google’s negativity skewed toward controversies like lawsuits, recalls, and data breaches, while ChatGPT leaned on product-evaluation themes such as feature gaps and value for money. And on overlapping prompts where both engines went negative, they flagged different brands 73% of the time.

    Industry changes the math again. In apparel, the pattern flipped: ChatGPT was three times more negative than Google, because fewer controversy triggers pushed negativity toward product-evaluation queries.

    Here’s the thing: even the user changes the answer. A 2026 study of 71,147 responses found ChatGPT, Claude, and Gemini shifted their recommendations when age, income, gender, or occupation changed, with the underlying question held constant. One snapshot from one account on one engine isn’t a sentiment baseline.

    A 4-Step AI Sentiment Analysis Workflow

    A sentiment number is only useful if you can trace it back to a cause. This is the workflow that tends to hold up when someone in leadership asks, “Why did this drop?”

    Step 1: Build a Fixed Prompt Set by Funnel Stage

    Split prompts into informational (“what is the best CRM for startups”), comparison (“X vs Y”), and purchase-intent (“is X worth the price”). Keep the set stable. If prompts change every month, you can’t tell a sentiment shift from a sampling shift.

    Weight purchase-intent prompts heavily for ChatGPT, given where its criticism concentrates.

    Step 2: Score Each Engine Separately

    Don’t average ChatGPT, Gemini, Perplexity, and AI Overviews into one number. Because sentiment differs between models, a platform that scores each engine individually and stores the full response behind each score shows you how each one characterizes you, rather than an average that blurs the difference.

    Step 3: Store Full Responses, Not Just Scores

    A score of 58 tells you nothing about what to fix. The full answer tells you whether the problem is a hedge, a comparison, an outdated fact, or a controversy. Keep the raw text so you can compare this month’s wording against last month’s.

    Step 4: Trace Sentiment to Sources in Aggregate

    This is where most teams take a wrong turn. The common assumption is that if a positive page gets cited, the answer will inherit its tone. The data says otherwise. An analysis of 22,295 AI answers across ChatGPT, Perplexity, and Google AI Mode found that cited-page sentiment didn’t predict answer sentiment, with the answer acting as a synthesis of many sources rather than a transfer from one.

    So look at the full pool of cited domains for a prompt cluster, not the single top citation. Sentiment tends to move when the aggregate signal across many cited sources shifts, plus, on ChatGPT, the underlying training data. If that pool is dominated by one outdated review site or a stale forum thread, that’s your lever.

    Fixing Negative Framing Takes Longer Than Fixing Rankings

    Once you know where the framing comes from, the fix depends on the engine.

    For Google AI Overviews, controversy-driven negativity usually traces back to news coverage. The response is getting current, accurate context into the publications and pages AI is already pulling from: resolution notices, updated coverage, clear statements on your own site.

    For ChatGPT, product-evaluation criticism tends to come from reviews, forums, and comparison content. BrightEdge attributes ChatGPT’s pattern to heavier reliance on product reviews, forums, and social discussions. That points you toward review platforms, community threads, and third-party comparisons where the “feature gap” narrative lives.

    Set expectations internally. Because answer sentiment reflects the aggregate of many sources, one new blog post rarely moves the score. You’re usually looking at several months of consistent signal before the framing shifts, and you’ll only know it shifted if you’ve been tracking the same prompts the whole time.

    Bottom line: sentiment is manageable, just slower and broader than a ranking fix.

    Where Topify Fits in a Sentiment-First Brand Analysis Stack

    For brand and PR teams that need phrase-level sentiment across engines, Topify is built around the workflow above rather than bolting sentiment onto a mention counter.

    Its Sentiment Analysis assigns a 0-100 score to how AI describes your brand, and it sits next to Visibility and Position in the same view. In practice, that means you can see that you appear in 60% of answers, rank third on average, and carry a sentiment score that dropped 12 points on purchase-intent prompts, all for the same prompt cluster. That combination is what turns “we’re mentioned more” into “we’re mentioned more but recommended less.”

    Competitor Monitoring auto-detects rivals and benchmarks Visibility, Sentiment, and Position side by side, which is how you catch the comparative framing that hides inside neutral answers. Source Analysis tracks which domains and URLs AI cites for each prompt, so you can map the aggregate source pool behind a negative shift instead of guessing from one page.

    Coverage matters here too, given how differently engines behave. Topify tracks ChatGPT, Gemini, Perplexity, Google AI Overviews, DeepSeek, Doubao, Qwen, and others. The Basic plan starts at $99/month with a 30-day trial and 100 tracked prompts, which is enough to run a fixed funnel-stage prompt set for one brand and its main competitors.

    The trade-off: like any sentiment tracker, the scores are only as good as your prompt set. Spend the first week getting prompts right before trusting the trend lines.

    Conclusion

    Mention counts answer one question: does AI know you exist? Sentiment answers the one that actually affects pipeline: is AI recommending you, hedging on you, or steering buyers to someone else?

    Start small. Pick 30 prompts split across informational, comparison, and purchase intent. Score each engine separately, keep the full responses, and trace shifts back to the pool of sources behind them. Within a month, you’ll know whether your rising visibility is working for you or against you. If you want that workflow running without the spreadsheet, you can get started with Topify and build your first prompt set in an afternoon.

    FAQ

    Q: What is brand analysis AI?
    A: Brand analysis AI refers to tools and methods that evaluate how AI engines like ChatGPT, Gemini, and Perplexity describe your brand. Beyond counting mentions, it scores tone, comparative framing, attributes, and factual accuracy in AI-generated answers.

    Q: How accurate is AI sentiment analysis for brand mentions?
    A: It’s generally reliable for explicit tone but weaker on hedges and comparisons unless it scores at the phrase level. The most dependable setups pair a numeric score with the stored full response, so a human can verify what drove each change.

    Q: How often should I track brand sentiment in AI answers?
    A: Weekly or daily tracking on a fixed prompt set works for most brands. Review the underlying answers whenever you ship a pricing change, a major launch, or face news coverage, since those events tend to shift framing.

    Q: Can you change how ChatGPT describes your brand?
    A: Yes, but not quickly. ChatGPT’s framing reflects many sources at once, especially reviews and forum discussions, so improving it means shifting the overall pool of content it draws from rather than publishing a single page.

    Read More

  • How a Prompt Research Tool Finds the Questions Buyers Ask AI

    How a Prompt Research Tool Finds the Questions Buyers Ask AI

    Your keyword map has 1,400 terms, each with a monthly volume and a difficulty score. None of them looks like what a VP of Marketing actually typed into ChatGPT last week: a full paragraph naming her team size, her budget, and the tool she’s trying to replace. That’s not just a formatting difference. The constraints inside that paragraph decide which vendors the model recommends, and your keyword data can’t see them.

    A prompt research tool is built to close that gap. Done right, prompt research tells you which questions your buyers ask AI, which brands show up in the answers, and why yours doesn’t.

    Your Keyword List and Your Buyers’ AI Prompts Are Two Different Lists

    Search behavior changes with the interface. In Semrush’s analysis, ChatGPT prompts averaged 23 words, while Google queries sat around four words and Google AI Mode queries landed near 7.2. Similarweb’s numbers are even further apart. Its 2025 report put the average ChatGPT prompt at roughly 60 words, compared with 3.4 for a Google search.

    The exact figure depends on who’s measuring. The direction doesn’t.

    Length isn’t the real issue, though. What matters is what the extra words carry. A Search Engine Land panel found that about 60% of people phrase their AI queries as questions, while just 9% give direct commands. Those questions come loaded with context: “for a 12-person agency,” “that integrates with HubSpot,” “under $50 a seat.” Each constraint narrows the answer, and each narrowing is a chance for your brand to drop out.

    ApproachTypical inputHow intent shows upWhat you measureHow stable results are
    Keyword research2 to 5 word phraseImplied through modifiersRank on a results pageShifts over weeks
    Prompt researchFull question with contextStated outright, with constraintsPresence and framing in a generated answerVaries from run to run

    Bottom line: a keyword list tells you which topics matter. It won’t tell you which questions put a competitor on the shortlist instead of you.

    B2B Shortlists Now Form Inside Conversations You Can’t See

    Forrester reports that 94% of business buyers now use AI in their buying process, and twice as many buyers as before name generative AI or conversational search as a more meaningful information source than vendor websites, product experts, or sales. Its 2026 survey of nearly 18,000 buyers found that 55% compare vendors inside AI tools before any vendor contact.

    The starting point has moved too. G2’s 2026 buyer research shows that 51% of B2B buyers now begin vendor research in AI tools.

    Here’s the thing: none of this shows up in your analytics.

    There’s no Search Console for ChatGPT. You don’t get a report of which questions mentioned your category, which ones mentioned you, or which ones recommended a rival. Buyers do still verify, since TrustRadius found that 94% of buyers who used AI fact-check the responses at least some of the time. But verification happens after the shortlist exists. If you’re not on it, there’s nothing to verify.

    That’s why prompt research has become its own discipline rather than a subtask of keyword research.

    How Prompt Research Actually Works, Step by Step

    A solid prompt research workflow has five stages. A tool can automate most of them, but the logic is the same whether you run it by hand or through a platform.

    Step 1: Start From Buyer Situations, Not Seed Keywords

    Keyword research begins with a seed term. Prompt research begins with a situation: who’s asking, what they’re trying to get done, and what constraints they’re working under.

    For a project management SaaS, that might be “ops lead at a 40-person agency, moving off spreadsheets, needs client-facing views, budget under $2,000 a year.” Map five to eight of these situations per core persona. They become the backbone of your prompt set.

    Step 2: Mine the Language Your Buyers Already Use

    You likely have more real prompt data than you think. Similarweb suggests filtering Google Search Console with a custom regex that surfaces queries of ten words or longer, over a date range of at least six months. Those long, question-shaped queries tend to mirror how people talk to AI.

    Other sources worth pulling: sales call transcripts, support tickets, onboarding survey answers, Reddit threads in your category, and review site comments. What you’re after is phrasing, especially the constraints and comparisons buyers mention without being asked.

    Step 3: Group Prompts by Intent, Not Wording

    This is where most manual efforts break down. When SparkToro asked 142 participants to write their own prompts for the same headphone scenario, the semantic similarity score across those prompts was only 0.081. Almost no two prompts looked alike.

    The good news is that despite the wildly different phrasing, AI tools still returned similar brand sets for the same underlying intent. So you don’t need to guess every possible wording. You need enough variants per intent cluster, typically 5 to 15, to represent how different buyers ask. Then you measure results at the cluster level.

    One caution on synthetic prompts. Search Engine Land’s research notes that real prompts are shaped by conversation history and persistent memory in ways a crafted persona prompt can miss. Treat AI-generated variants as a map of intents, not a mirror of real behavior.

    Step 4: Run Every Prompt Many Times and Read the Answers

    One run tells you almost nothing.

    SparkToro found that ChatGPT and Google’s AI returned the same brand list less than 1% of the time across repeated runs of the same prompt, and the same list in the same order less than 0.1% of the time. What does hold up is frequency. Across the models tested, the three most-mentioned brands appeared in 64% to 73% of responses on average, depending on the platform. That’s why visibility rate, the share of sampled answers that mention you, is a far more reliable metric than position.

    While you’re sampling, capture what the model searched for. Nectiv’s analysis of more than 8,500 prompts found that ChatGPT ran a web search in 31% of prompts, averaging 2.17 searches each at about 5.5 words per query. Those fan-out queries, plus the pages cited in response, show you which content the model leans on.

    Step 5: Prioritize by Demand and Gap

    Now you’ve got a matrix: intent clusters on one axis, brands and visibility rates on the other. Prioritize clusters that combine real AI search demand with low or zero visibility for your brand, especially where one or two competitors show up again and again.

    Those are your content briefs. The cited sources tell you where to publish. The constraints in the prompts tell you what the content has to answer.

    What a Prompt Research Tool Should Do That a Spreadsheet Can’t

    You can run steps 1 through 3 in a spreadsheet. Steps 4 and 5 are where manual work collapses. Sampling 100 prompts 20 times each across four platforms means 8,000 answers per cycle, and those answers shift every time a model updates.

    CapabilityWhy it matters
    Volume signals from real AI search behaviorShows which intents have demand, not just which ones you can imagine
    Multi-platform samplingChatGPT, Perplexity, Gemini, and AI Overviews often favor different brands
    Repeated runs with visibility ratesTurns noisy single answers into a stable metric
    Intent clusteringMeasures outcomes by buyer need rather than exact wording
    Citation and source captureReveals which domains shape the answer
    Continuous prompt discoverySurfaces new questions as buyer language and models change

    If a tool shows you a single “rank” for a prompt from a single run, treat that number with suspicion. It’s a snapshot of noise.

    Where Topify Fits in a Prompt Research Workflow

    Topify is built around the loop described above, from finding prompts to acting on what the answers reveal.

    Its High-Value Prompt Discovery feature surfaces the high-volume AI prompts relevant to your category and keeps surfacing new ones as AI recommendations evolve, which covers the part of prompt research that goes stale fastest. AI Volume Analytics adds demand data based on real AI search behavior, so you can separate the prompts buyers ask constantly from the ones almost nobody asks. From there, Topify tracks each prompt across ChatGPT, Gemini, Perplexity, and engines like DeepSeek, Doubao, and Qwen. Results are scored on seven metrics: visibility, sentiment, position, volume, mentions, intent, and CVR.

    Two features matter most once the research is done. Dynamic Competitor Benchmarking shows which rivals AI recommends for each prompt cluster and flags new ones as they appear. Citation analysis reverse-engineers the exact domains and URLs the models cite, so you can see whether a competitor’s comparison page or a third-party review site is doing the heavy lifting.

    In practice, a SaaS marketing team might load 100 prompts across four buyer personas, notice that one competitor owns nearly every “alternative to [legacy tool]” prompt on Perplexity, and trace that to two review sites and a single listicle. That’s a content plan with sources attached. Plus, One-Click Execution turns a goal stated in plain English into a proposed strategy you can review and deploy.

    Pricing is usage-based. Basic starts at $99/month for 100 prompts with a 30-day trial, and Pro is $199/month for 250 prompts. Full details are on the pricing page, and you can get started with Topify directly.

    Three Prompt Research Mistakes That Skew Everything Downstream

    Tracking prompts only you would ask. Branded prompts like “Is [your brand] good for agencies?” feel reassuring because you’ll show up. Buyers early in their research usually don’t know your name yet. Keep branded prompts to a small slice of the set, roughly 10 to 20%.

    Chasing position instead of presence. Given how much answers vary, a jump from third to first in one run is usually noise. Watch visibility rate across repeated samples and look for shifts that hold over several weeks.

    Front-loading definitional questions. “What is project management software?” gets asked, but it rarely produces a shortlist. Weight your set toward comparison, alternative, and constraint-heavy prompts, since that’s where recommendations happen. SparkToro also found that in tight spaces like niche B2B tools, AI answers clustered around a few familiar names, so in smaller categories a well-chosen prompt set can reveal a lot.

    Conclusion

    Your buyers aren’t typing four-word keywords into AI. They’re describing their situation and asking for a recommendation, and that answer often decides who makes the shortlist. Prompt research is how you see those questions: start from buyer situations, mine real language, group by intent, sample answers repeatedly, and prioritize where demand meets absence.

    A prompt research tool doesn’t replace that thinking. It makes the sampling and monitoring possible at the scale the problem demands. Start with 50 to 100 prompts across your core personas, measure visibility instead of rank, and let the gaps write your next content brief.

    FAQ

    Q: What is a prompt research tool?

    A: It identifies the questions people ask AI assistants like ChatGPT, Perplexity, and Gemini in your category, then samples the answers to show which brands appear, how often, and which sources the models cite. Think of it as the AI search counterpart to a keyword research tool.

    Q: How is prompt research different from keyword research?

    A: Keyword research targets short phrases and measures ranking positions on a results page. Prompt research targets full, context-rich questions and measures whether your brand appears in generated answers. Most teams need both, since the two lists rarely overlap cleanly.

    Q: How many prompts should I track for AI search visibility?

    A: Most B2B brands start with 50 to 100 prompts, grouped into 8 to 15 intent clusters with several phrasings each. Expand once you know which clusters drive recommendations in your category.

    Q: How do I find the prompts my buyers ask ChatGPT?

    A: Combine long, question-style queries from Google Search Console with language from sales calls, support tickets, reviews, and community threads. Then use a prompt discovery tool to add volume data and surface prompts you haven’t considered.

    Read More

  • How to Tell If an AI Visibility Benchmark or Ranking Is Credible

    How to Tell If an AI Visibility Benchmark or Ranking Is Credible

    Three separate 2026 studies set out to answer the same question: how visible is the average brand in AI search? One landed on a cross-industry median of 49 out of 100. A different 2026 report put the cross-industry median at the same 49, but built it from Pondral’s 200-brand sample scoring 55.8 on average against Foglift’s 4,217-brand sample scoring a 62 median for SaaS alone. A third measured something else entirely: non-branded mention rate, landing at roughly 31% in the middle of the pack.

    Same general topic. Three numbers that don’t line up, because they’re not measuring the same thing the same way.

    That’s the problem with the term “AI visibility benchmark” right now. It gets used for wildly different research designs, and most reports don’t tell you which one you’re looking at. If you’re about to cite a ranking in a board deck or a client report, here’s how to check whether the number underneath it will hold up.

    Why AI Visibility Benchmark Studies Keep Disagreeing With Each Other

    Start with how unstable the underlying data actually is. One study tracked 1,127 unique URLs cited by ChatGPT, Perplexity, Gemini, Copilot, and Google AI Overviews across 30 queries over six weeks. Only 119 of those URLs were still being cited by the end of the study. The rest had already been replaced.

    That’s not a one-off glitch. Research comparing citation behavior across engines found that the same page can be a top citation on ChatGPT and completely invisible on Perplexity, with engines disagreeing on which hostnames matter 65 to 85% of the time. A benchmark run on ChatGPT in March and one run on Perplexity in April aren’t measuring the same reality, even if both call themselves “AI visibility.”

    Sample size compounds the problem. Statistically, a visibility rate near 25% measured over 72 answers carries a margin of error of about 10 percentage points, and it takes roughly 294 answers per period before a 10-point swing can be called a real trend instead of noise. A lot of published rankings never disclose how many answers they actually pulled.

    Definitions vary too. Some studies count any brand mention. Others only count citations where the AI links back to a source. Mentions, citations, and links are three separate signals that measure different things and should never be collapsed into one number. A “top 10” list built on mentions and one built on citations can rank the same set of brands in a completely different order.

    The Methodology Questions Most Reports Never Answer

    Before you trust a number, there are four questions almost every credible study answers upfront, and almost every weak one skips.

    How many prompts, and across how many platforms? One of the more rigorous studies manually checked 1,700 businesses across 32 industries and 3 countries, finding 88% weren’t appearing in ChatGPT at all. That’s a defensible sample. A report built on 20 queries against one engine is not, no matter how confidently it presents its findings.

    Is the sampling method disclosed? Most AI-visibility tools sample only a fraction of what they claim to measure, and the sampling method is rarely spelled out in the marketing copy. If a report can’t tell you how it queried the models, it can’t tell you how much noise is baked into its score.

    How current is the data? AI answers shift week to week as models update and content gets re-crawled. A benchmark that hasn’t been refreshed since last quarter is describing a version of the AI landscape that no longer exists.

    Is the score reproducible? A credible measurement asks for a disclosed sample, a repeatable test, and multi-turn buyer journeys before a score is treated as decision-grade, rather than presenting a single chart as if it were proof.

    Five Signals a Study’s Data Actually Holds Up

    Once you know what to ask, spotting a solid study gets faster. Look for these five signals together, not just one of them.

    A named, disclosed sample. Studies worth citing tell you the number of brands, prompts, and platforms up front. One 2026 benchmark evaluated 4,217 brands using 150-plus industry-specific prompts across multiple AI engines, and said so in the first paragraph.

    Multi-engine coverage. A single-platform study can only speak to that platform. Reports that separate results by engine, rather than blending them into one composite score, are being honest about a fragmented reality.

    Per-industry or per-segment breakdowns. Credible benchmark data shows median scores varying sharply by category, for example a blended median non-branded mention rate near 31% overall but ranging from under 12% at the bottom quartile to over 74% at the top decile. A single flat number across every industry is a warning sign, not a summary.

    A visible methodology section. Strong studies publish the actual formula behind their score, down to the weighting of each component, so a reader can check the math instead of taking the grade on faith.

    Willingness to show its own limits. Some research teams re-test their own scoring weekly and publish what changed and why, treating measurement error as something to audit rather than hide. That kind of self-correction is rare, and it’s a strong trust signal when you find it.

    What a Fake or Cherry-Picked Ranking Usually Looks Like

    Here’s the thing: bad AI visibility data rarely looks fake at first glance. It looks polished.

    A few patterns are worth watching for. A report that only tests prompts where the sponsoring brand already performs well. A “visibility score” built entirely on one AI engine but marketed as if it covers “AI search” broadly. A ranking with no sample size anywhere in the document, just a chart and a headline number.

    One team documented a case where an AI visibility audit looked entirely credible while actually measuring the wrong company, a failure traced back to entity resolution errors in how the tool matched brand names to citations. The dashboard looked fine. The underlying match was wrong.

    Vendor comparison content is its own category of risk. Many tools measure whether a brand simply appears somewhere in an AI answer, which is a vanity signal, rather than whether the AI treats that brand as the actual source behind the answer, which is the signal that actually moves business outcomes. If a comparison article only tracks the first kind, its rankings will flatter tools that are easy to get mentioned by and say nothing about which ones drive real citations.

    That’s the gap most brands still can’t see.

    How Topify Makes Its AI Visibility Benchmark Data Verifiable

    Topify builds its benchmarking around the standards above instead of around a single headline score. Rather than reporting one mention count, it tracks brand performance across seven separate metrics in one view: visibility, sentiment, position, volume, mentions, intent, and CVR, so a brand’s “we got mentioned” number never gets confused with what that mention was actually worth.

    Coverage runs across the engines that actually carry buyer intent. Topify tracks brands across ChatGPT, Gemini, Perplexity, DeepSeek, Doubao, and Qwen, which matters for any team selling into more than one market, since a brand’s standing on Perplexity often looks nothing like its standing on a regional engine.

    The sampling side addresses the noise problem directly. Instead of asking a question once, the platform probes each engine with multiple phrasings of the same query to build a statistically grounded picture of a brand’s presence, rather than relying on a single snapshot answer. That’s the same principle behind the sample-size math earlier in this article: more answers per comparison period means less noise in the trend line.

    The traceability piece closes the loop. Topify reverse-engineers the exact domains and URLs an AI platform cites, so when a competitor keeps showing up in an answer and a brand doesn’t, the gap can be traced to a specific source rather than left as a mystery. That’s what “verifiable” should mean in this category: every score traces back to a query, an engine, and a citation you can go check yourself.

    A Quick Checklist Before You Cite Any AI Visibility Study

    If you can’t reproduce a number, don’t cite it.

    Before a stat from any AI visibility report goes into a deck or a pitch, run it through four checks:

    • Does it name the sample size, the number of prompts, and the platforms tested?
    • Does it separate results by engine instead of blending them into one score?
    • Does it publish, or at least describe, the actual scoring formula?
    • Can you trace at least one data point back to a real, checkable citation?

    If a report fails two or more of these, treat its headline number as directional at best, not something to build a decision on.

    Conclusion

    Credibility in this space isn’t about how big the sample sounds or how confident the headline is. It comes down to whether the methodology can survive someone actually reading it. The studies that hold up disclose their sample, separate their engines, publish their formula, and let you trace a score back to a real citation. The ones that don’t are guessing with better formatting.

    Before you quote any AI visibility benchmark in a report or a client conversation, run it past the checklist above. It takes five minutes and it’s the difference between citing data and repeating a marketing claim.

    FAQ

    What is an AI visibility benchmark, exactly?
    It’s a comparison point for how often AI engines mention, cite, or recommend a brand relative to peers, usually expressed as a score or percentage. The term gets applied loosely, so the same phrase can describe a rigorous multi-engine study or a single-platform snapshot.

    Why do different AI visibility studies show such different numbers for the same industry?
    Different studies use different sample sizes, different sets of AI engines, and different scoring models, which is why three independent 2026 benchmarks covering more than 3,000 brands still landed on different median scores for comparable industries.

    Are AI visibility rankings from marketing vendors trustworthy?
    Some are, some aren’t. The deciding factor isn’t who publishes the study, it’s whether the methodology is disclosed. A vendor-published study with a named sample size, multi-engine coverage, and a visible formula can be more reliable than an “independent” one that hides all three.

    How often should AI visibility benchmark data be updated to stay accurate?
    AI answers shift as models update and content gets re-crawled, so data older than a quarter should be treated cautiously. Studies that re-test on a weekly or monthly cadence and publish what changed are the most defensible to cite.

    Can a small brand trust its own AI visibility number if the industry benchmark is based on huge brands?
    Only if it checks the segment breakdown, not just the overall median. Benchmarks with real per-quartile data show a nearly 62-point spread between the bottom quartile and top decile within the same industry, so comparing a small brand’s raw score to an industry-wide average without checking segment size is misleading.

    Read More