Blog

  • AI Search Volume Is a Vanity Metric. Here’s What to Pair It With

    AI Search Volume Is a Vanity Metric. Here’s What to Pair It With

    Your team found a topic pulling solid AI search volume, built three pieces of content around it, and watched it do nothing for pipeline. The number wasn’t wrong. It just wasn’t telling you what you assumed it was telling you. AI search volume shows how often people ask about something inside ChatGPT, Perplexity, or Gemini. It says nothing about whether your brand shows up in the answer, what it’s compared against, or whether anyone acts on what they read. Treat it as the whole story and you’ll keep chasing high-volume topics that never move a single metric your finance team cares about.

    What AI Search Volume Actually Measures

    AI search volume estimates how often a prompt, or a cluster of closely related prompts, gets submitted to AI platforms in a given month. It plays roughly the same role prompt volume plays for GEO that keyword volume plays for traditional SEO: a way to rank topics by demand.

    The scale behind that number is real. By July 2025, ChatGPT was fielding an estimated 2.5 billion prompts a day, according to OpenAI, up from 1 billion just eight months earlier. That’s the base a modern AI search volume tool is sampling from, and it’s why the metric exists at all.

    But the shape of the demand is different from what keyword tools were built to count. Google’s average US query held near 3.3 to 3.4 words for most of a year. Inside AI assistants, queries average roughly 23 words, about six times longer than a typical search box query. A volume number built on twenty-three-word prompts about someone’s team size, budget, and current tools isn’t measuring the same behavior a keyword tool measures. It’s measuring something closer to a conversation.

    Why a High Volume Number Can Still Mean Nothing

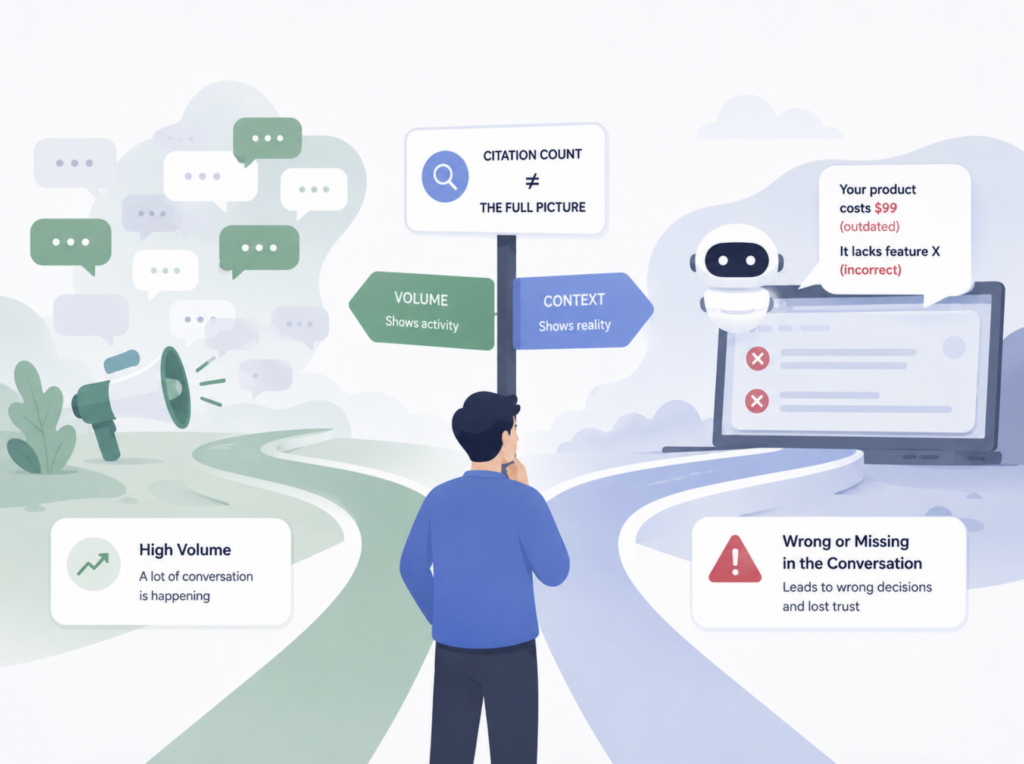
    Here’s the gap. A topic can carry heavy AI search volume while your brand gets zero mentions inside it. Or you get mentioned constantly, in a version of your positioning that doesn’t match reality. Volume alone can’t tell you which one is happening.

    Marketing teams already have a name for this pattern. A high AI visibility rate without citation share context can look strong right up until a competitor shows up twice as often in the same set of answers. The same logic applies to volume: a topic showing 8,000 monthly prompts means nothing if your domain never enters the conversation.

    That’s the gap most brands still can’t see.

    Citation count has the same blind spot. Being cited constantly with outdated pricing or the wrong feature set does more damage than being cited less often but accurately. Volume tells you a conversation is happening. It doesn’t tell you what’s being said about you inside it, or whether you’re in it at all.
    The Three Numbers That Turn Volume Into a Decision

    A useful measurement program treats volume as the entry point, not the scoreboard. One framework for AI visibility measurement breaks this into layers: a headline citation share number, a check on whether that citation is even accurate, and a downstream conversion metric that ties exposure back to revenue. Volume decides which topics deserve attention. These three numbers decide whether to act on them.

    Position or mention rate. For a given high-volume topic, what share of AI answers actually name your brand? This is the fastest way to separate topics worth investing in from topics where you’re simply not part of the conversation yet.

    Sentiment and accuracy. When you do get mentioned, is the description correct and on-message? A citation that gets your pricing tier wrong or calls you a budget option when you’re positioned as premium isn’t a win, even if it counts toward a visibility dashboard.

    Conversion signal. This is the number that matters most to leadership. AI-referred visitors tend to convert differently than standard organic traffic. Semrush research puts AI-sourced traffic’s conversion rate at roughly 2.3 times that of typical organic search, and separate data from Conductor found AI-referred visitors converting at close to twice the rateof regular organic visitors. Fewer visits, higher intent. That’s the trade the zero-click era makes: fewer sessions overall, since about 60% of searches now end without a click per Bain’s research, but the sessions that do land are worth more.

    How This Looks in Practice

    Take a topic showing strong AI search volume in your monthly report. Check position first: are you named in more than a token share of answers for that topic. If yes, check sentiment: is the description accurate. If both hold up, check conversion: is the traffic or lift you’re seeing from that topic actually landing somewhere. A topic that fails any one of these three checks isn’t dead, but it’s not the priority the volume number made it look like.

    Where Topify Fits

    This is the exact gap Topify was built to close. Most AI visibility tools stop at a volume or visibility dashboard and leave you to stitch position, sentiment, and conversion data together yourself, often across three separate subscriptions.

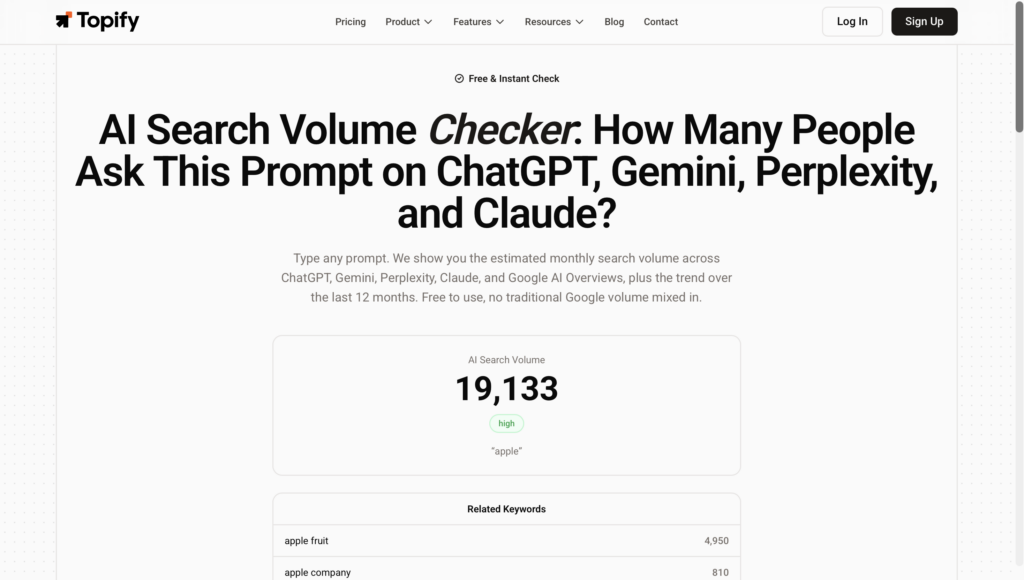
    Topify’s AI Search Volume Checker surfaces the raw demand signal, the same kind of prompt-level volume data covered above, and pairs it in one view with Position Tracking, Sentiment Analysis, and CVR, its own measure of how likely an AI answer is to send someone toward your brand. In practice, that means you can spot a high-volume topic, check in the same dashboard whether you’re actually named in it, and see whether that exposure is translating into anything, without exporting three reports and reconciling them by hand.
    volume

    If you want to see where your own volume data currently stands against those three checks, you can get started with Topify and run your first check for free.

    A Quick Way to Sanity-Check Your Own Volume Numbers

    Pull your top three to five topics by AI search volume this month. For each one, note your position or mention rate, whether the sentiment reads accurately, and whether there’s any conversion or branded search lift tied to it. Topics that score well on volume but fail on all three checks are candidates to deprioritize. Topics that score well on volume and position but haven’t been checked for conversion are your next test.

    Conclusion

    The high-volume topic that went nowhere wasn’t a fluke, and it wasn’t a reason to stop trusting AI search volume as a metric. It’s a reason to stop reading it alone. Volume tells you where demand exists. Position, sentiment, and conversion tell you whether that demand is worth anything to you specifically. Before your next content or PR decision leans on a volume number, check it against those three before you commit budget to it.

    FAQ

    Q: Is AI search volume the same as Google search volume? 

    A: No. Google search volume counts short keyword-style queries in a search box. AI search volume estimates demand for much longer, conversational prompts, often around 20 words or more, sent to platforms like ChatGPT, Gemini, and Perplexity.

    Q: How is AI search volume calculated? 

    A: AI platforms don’t publish prompt-level logs, so vendors model it from consented panels, sampling, and extrapolation. That makes it directional, useful for ranking topics and spotting trends, rather than a precise monthly count.

    Q: What’s a good AI search volume tool? 

    A: Look for one that pairs volume with position, sentiment, and conversion data in the same view, rather than a standalone volume number with nothing to check it against.

    Q: Should I create content for every high-volume AI topic? 

    A: Not automatically. Check your position and mention rate for that topic first. High volume with no brand presence usually means the topic needs a different strategy, not just more content.
    Read More

  • AI Search Volume Has Three Meanings. Buying the Wrong One Costs You

    AI Search Volume Has Three Meanings. Buying the Wrong One Costs You

    You pull up two GEO tools and ask both the same question: how much ai search volume does your category get each month. One says 40,000. The other says 2.1 million. Same topic, same month, off by two orders of magnitude. Nobody made a mistake. The two tools measured completely different things and shipped the number under the same label. Before you sign a contract, plan content, or report a number to your CMO, you need to know which of the three things it’s actually counting.

    AI Search Volume Isn’t One Metric. It’s Three.

    The term got popular fast, and vendors rushed to attach it to whatever data they already had. That’s the root of the confusion. Three genuinely different datasets are being sold under one name:

    • Keyword-style volume, traditional Google search demand, relabeled for the AI era.
    • Prompt volume, how often people actually type or speak a question to an AI assistant.
    • Citation volume, how often a brand gets named inside the AI’s answer to that question.

    Each one answers a different business question. Mix them up, and you’ll end up optimizing for the wrong thing, or worse, paying for a number that never moves the metric your team actually reports on.

    Keyword-Style Search Volume: The Google Habit Carried Over

    Keyword-style volume is the easiest number for a vendor to produce, since the infrastructure already exists. Take the query, run it through the same estimation methods used for Google Keyword Planner, and report a monthly figure. Keyword search volume estimates the number of times a specific keyword or phrase is entered into a search engine, typically Google, within a set period. That’s a perfectly good number. It’s just not an AI number.

    The gap shows up in what it leaves out. A growing share of queries now resolve inside an AI Overview or a chat answer without a click ever happening, and AI assistants generate roughly 45 billion monthly sessions globally, equal to about 56% of traditional search engine volume, though the genuinely search-equivalent share of that is closer to 28%. None of that activity shows up in a keyword tool, because a keyword tool was never built to see it.

    If a vendor’s “AI search volume” figure turns out to be their existing keyword database with a new label on top, you’re paying for old data in new packaging.

    AI Prompt Volume: How Often People Actually Ask AI

    Prompt volume is a different animal. It’s the estimated frequency of an actual question, phrased the way people phrase it, sent to ChatGPT, Perplexity, or Google’s AI surfaces. AI search volume, in this sense, is the estimated frequency with which topics or questions get entered into AI tools, typically modeled as intent clusters rather than exact-match keywords, since one underlying question can surface as dozens of prompt variations.

    Getting this number is harder than pulling keyword data. None of the major AI platforms publish query logs, so vendors work from consented panels or sampled prompt sets and extrapolate from there. That’s part of why prompt-volume figures shift around more than keyword estimates do.

    The payoff shows up downstream, once you know a prompt’s volume. When ChatGPT switched from citation chips to inline branded hyperlinks in May 2026, tracked OpenAI referral traffic across millions of visits jumped roughly 1.6x almost overnight, turning what used to be an abstract prompt count into a real traffic number. That’s the layer Topify‘s AI Volume Analytics is built to track: real prompt frequency across ChatGPT, Perplexity, and Google’s AI surfaces, refreshed as the underlying intent clusters shift rather than left to go stale between quarterly reports. You can check your own category’s prompt volume here.

    Why Most Tools Stop Here

    Most products marketed as AI search volume tools stop exactly at this layer. More than a dozen platforms now track prompt-level AI visibility, ranging from budget options around $29 a month up to enterprise tools processing hundreds of millions of real prompts. Knowing how big a topic is doesn’t tell you whether your brand gets to say anything when someone asks about it. That gap is exactly what the next layer closes.

    AI Citation Volume: How Often Brands Get Named in the Answer

    Citation volume answers the question marketing teams actually care about: when the AI generates an answer to that high-volume prompt, does your brand get named. AI share of voice is the percentage of AI-generated responses that mention, cite, or recommend a brand across a defined set of category prompts, measured against every brand mentioned in those same answers. It’s a completely separate number from prompt volume. A topic can pull millions of monthly prompts while your brand still gets zero mentions in the answers.

    This number also moves more than most people expect. Citation share can drift 40 to 60% month over month in active categories, which means a single snapshot report is close to meaningless on its own. Scale matters too. Research tracking citation patterns across brands found that global household names appear in roughly 73% of relevant AI answers, established mid-market brands in 44%, and niche or small brands in just 11%. If your team is buying “AI search volume” hoping it doubles as a brand health score, it won’t. Volume tells you the size of the room. Citation volume tells you whether anyone in that room is saying your name.

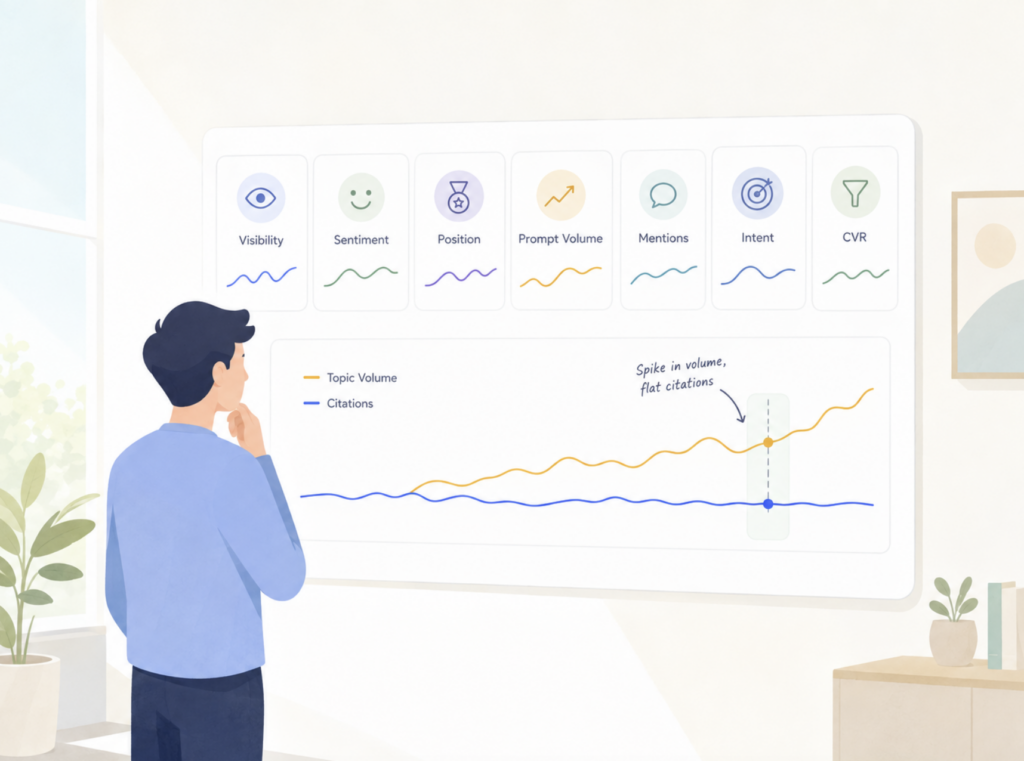
    This is why Comprehensive GEO Analytics keeps these numbers next to each other instead of splitting them across separate reports. Visibility, sentiment, position, prompt volume, mentions, intent, and CVR sit in one view, so a spike in topic volume and a flat citation line show up on the same chart instead of two different dashboards nobody cross-references.

    How to Check Which Volume You’re Actually Buying

    Before you compare a price tag, ask the vendor three questions.

    First, ask what’s actually being counted. If the answer sounds like a repackaged keyword tool with an AI label, that’s a signal.

    Second, ask whether you can see the underlying prompts, not just the aggregate number. A real prompt-volume dataset should let you read the actual questions behind the count, not just a chart.

    Third, ask whether the report separates prompt volume from citation volume, or bundles them into one blended score. Citation rate and mention rate measure genuinely different things, and treating them as interchangeable is one of the more common mistakes teams make when a high mention count with few sourced citations behaves very differently in terms of the traffic and trust it produces.

    If a vendor can’t answer these three questions clearly, you’re not buying a metric. You’re buying a guess with a decimal point attached.

    There’s a fourth question worth asking internally, before you even talk to a vendor: which layer actually matches the decision you’re trying to make. A content team deciding what to write next needs prompt volume, since that’s the demand signal. A brand or comms team reporting on AI visibility needs citation volume, since that’s the exposure signal. Buying the wrong layer for the decision in front of you is a more common mistake than buying from the wrong vendor entirely.

    Conclusion

    Two GEO tools showing 40,000 and 2.1 million for the same topic aren’t lying to you. They’re counting different things and calling it the same name. Keyword-style volume tells you what people typed into Google. Prompt volume tells you what people are actually asking AI. Citation volume tells you whether your brand shows up when they ask. Before your next renewal, or your next number in front of leadership, figure out which one you’re looking at, and make sure it’s the one that actually answers the question you were asked.

    FAQ

    Q: Is AI search volume the same as keyword search volume? 

    A: No. Keyword search volume estimates Google demand for a term. AI search volume, depending on the vendor, usually refers to prompt volume or citation volume, both measured from AI assistant activity rather than search engine queries.

    Q: How do vendors measure AI prompt volume if AI platforms don’t publish query data? 

    A: Most estimate it from consented consumer panels or sampled prompt sets, then extrapolate across intent clusters. That’s part of why prompt-volume numbers from different vendors can vary widely for the same topic.

    Q: What’s the difference between AI search volume and AI citation volume? 

    A: AI search volume, in its prompt-volume sense, measures how often a question gets asked. Citation volume measures how often your brand gets named in the answer to that question. A topic can carry huge volume and zero citation volume for your brand at the same time.

    Q: Which AI search volume tool is most accurate? 

    A: No single tool is definitively correct, since each uses its own panel or sampling method. The more useful question is which layer of volume a tool actually measures, and whether it lets you see the underlying prompts rather than just a final score.

    Read More

  • How AI Search Volume Is Estimated: 4 Methodologies Compared

    How AI Search Volume Is Estimated: 4 Methodologies Compared

    You pull up three GEO tools, type in the same topic, and get three different monthly volume numbers. Not close either, sometimes a 3x spread on the exact same query set. The instinct is to assume one tool got it right and the other two got it wrong.

    That’s not what’s happening. There’s no equivalent of Google Search Console for ChatGPT or Perplexity. No AI platform publishes query frequency data the way Google exposes it through Keyword Planner. Every tool reporting AI search volume is running its own estimation method, and those methods disagree by design, not by error.

    There’s No Google Search Console for ChatGPT

    Google gives you a number because it can. It owns the query log. ChatGPT, Perplexity, and Gemini don’t share theirs, and there’s no regulatory pressure forcing them to.

    That absence is the whole story. Every AI search volume figure you’ve ever seen is modeled, not measured. The question worth asking isn’t “which number is correct.” It’s “which modeling approach is this tool using, and does that approach fit how I plan to use the number.”

    Four distinct methodologies currently dominate the market. Each trades off accuracy, cost, and interpretability differently.

    Method 1: Keyword Volume Extrapolation

    The simplest approach takes a keyword’s existing Google search volume and multiplies it by an estimated AI adoption rate for that topic category. If a keyword gets 10,000 monthly Google searches and the adoption rate for that category sits around 18%, the tool reports roughly 1,800 as the AI-equivalent volume.

    This method is cheap to build and easy to explain. That’s its appeal.

    It’s also directionally weak. AI platforms are absorbing an uneven 15 to 20 percent of informational query volumeglobally, but that share varies wildly by category, and the adoption rate itself is an estimate layered on top of another estimate. You end up compounding uncertainty rather than resolving it.

    Where this actually helps: early-stage GEO planning, when you just need a rough sense of which topics are worth investigating further, not a number you’d defend in a board meeting.

    Method 2: Repeated Query Sampling

    The second method borrows its logic from election forecasting. You don’t ask one voter. You poll a representative sample repeatedly and track how the distribution shifts.

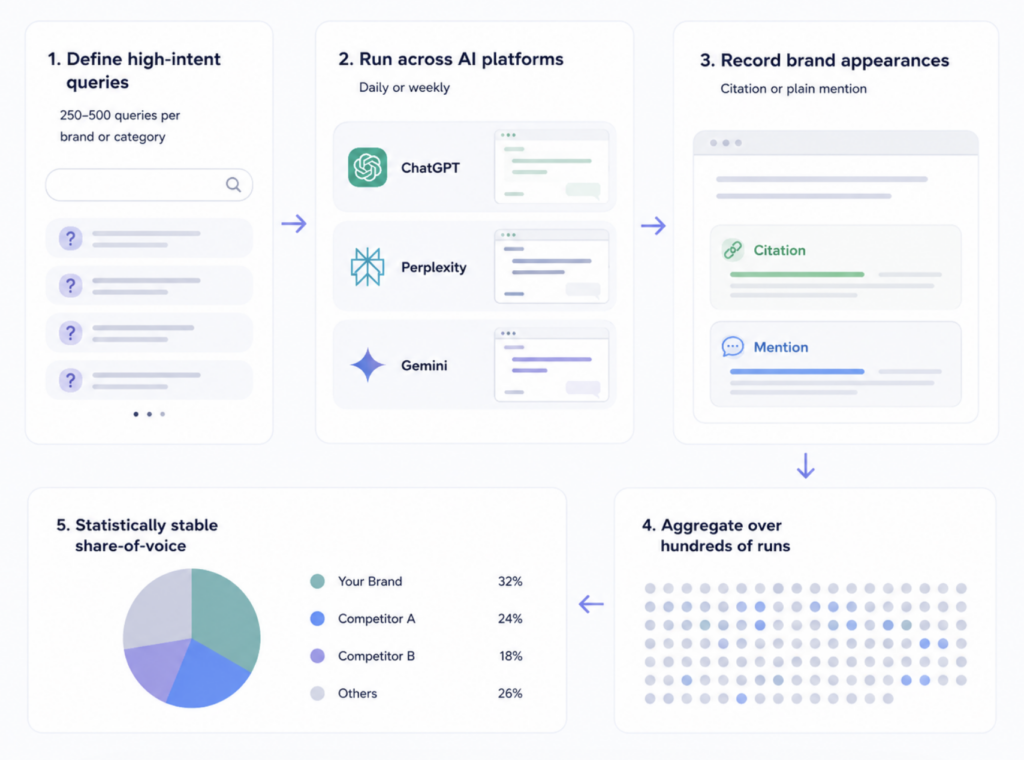
    Tools using this approach define a fixed set of high-intent queries, typically 250 to 500 per brand or category, and run them daily or weekly across ChatGPT, Perplexity, and Gemini. Each run records whether a brand appears as a citation or a plain mention. Over hundreds of runs, the aggregate produces a statistically stable share-of-voice figure.

    ai search volume

    A single screenshot of a ChatGPT answer isn’t your position. It’s one draw from a probability distribution, since LLM outputs vary run to run even for identical prompts.

    That’s why the sampling method treats volume less like a fixed number and more like a moving average. Top brands typically capture 15% or more share of voice across their core query sets, and specialized enterprise verticals can reach 25 to 30%.

    The trade-off is cost. Running hundreds of queries across multiple platforms on a recurring schedule takes real compute, which is why tools using this method tend to sit at a higher price point than simple extrapolation tools.

    Method 3: Semantic Clustering of Observed Prompts

    The third method solves a different problem entirely. People don’t type keywords into ChatGPT. They ask full questions, and the same underlying intent can surface in dozens of different phrasings.

    “Best design tools for freelancers,” “what software should a solo designer use,” and “affordable design tool recommendations” are the same question wearing three different outfits. Keyword-matching tools would count these as three separate, low-volume queries. Clustering tools embed each observed prompt and group them by semantic similarity, then report one consolidated demand signal for the whole cluster instead of a scattered list of long-tail fragments.

    The data feeding this method usually comes from opt-in browser panels and aggregated clickstream data, since that’s currently the closest proxy available to actual prompt logs.

    The upside is a more realistic picture of true demand. The downside is that clustering quality depends entirely on how much raw prompt data the tool has access to, and that dataset size varies enormously between vendors.

    Method 4: Multi-Source Ensemble Modeling

    The most complex approach blends everything above. Proprietary panel data, public market indicators, and partner datasets get combined into a single model, then run through a correction factor designed to offset known biases in each individual source.

    The logic is straightforward: any single data source has blind spots, so stacking multiple imperfect sources and statistically adjusting for their known weaknesses should land closer to the truth than trusting one source alone.

    This tends to produce the most stable numbers over time, since a spike or dip caused by one input source gets smoothed out by the others. The cost is transparency. The more layers a model has, the harder it is for an outside marketer to explain why a number moved between reports, and that opacity can be a real problem when you’re presenting volume data to a client or exec who wants to know why.

    So Which Number Should You Actually Trust

    Wrong question. The right one is which methodology matches your use case, your budget, and how much explainability you need.

    MethodData SourceUpdate CadenceExplainabilityBest Fit
    Keyword ExtrapolationGoogle volume + adoption rateStatic, rarely updatedHigh, easy to explainEarly topic scoping
    Repeated SamplingLive query runs across platformsDaily or weeklyMedium, statistically groundedOngoing share-of-voice tracking
    Semantic ClusteringObserved prompt panelsWeeklyMedium, depends on data volumeContent and intent mapping
    Ensemble ModelingMultiple blended sourcesWeekly to monthlyLow, harder to auditLong-term trend stability

    In practice, the most reliable teams don’t pick one method and stop there. They cross-reference at least two, typically repeated sampling for the day-to-day visibility number and clustering for figuring out which content angles actually match how people phrase their questions.

    That’s the design behind Comprehensive GEO Analytics, which pairs volume estimates with visibility, sentiment, and position data in the same view rather than isolating volume as a standalone metric. If you want to see where your own topics land, the AI Search Volume Checker runs the estimate for free before you commit to a full GEO strategy around it. If your volume number spikes but your citation share doesn’t move with it, that gap tells you more than either metric alone would.

    Conclusion

    There isn’t a single correct AI search volume number waiting to be discovered. There are four different modeling approaches, each built on a different set of trade-offs between cost, accuracy, and transparency.

    The practical move is to know which method any tool you’re using relies on, then decide how much weight that number deserves in your planning. If a figure from one method disagrees sharply with another, that’s not a bug. It’s two different models looking at the same shadow from different angles. Cross-check before you build a content strategy around either one alone.

    FAQ

    Q: Is AI search volume the same thing as traditional keyword search volume?
    A: No. Keyword volume is a direct count from Google’s own query logs. AI search volume is always modeled, since no AI platform publishes raw query frequency data the way Google does.

    Q: Why do different AI search volume tools show different numbers for the same topic?
    A: Because they use different methodologies, not because one is broken. Extrapolation, sampling, clustering, and ensemble modeling each weigh data sources differently, so disagreement between tools is expected rather than a sign of error.

    Q: How often should I check AI search volume for my key topics?
    A: Monthly works for most categories. Fast-moving verticals like AI tools, finance, or breaking news topics often need weekly checks, since prompt patterns in those spaces shift faster than average.

    Q: Why does my brand’s AI search volume differ between ChatGPT and Perplexity?
    A: Each platform has its own user base, retrieval logic, and citation behavior, so the same topic can generate very different demand patterns depending on which platform’s users are asking about it.

    Read More

  • Best Healthcare SEO Companies: How to Choose an Agency for Medical and Healthcare Practices

    Best Healthcare SEO Companies: How to Choose an Agency for Medical and Healthcare Practices

    Google’s search quality rater guidelines put most health and medical content into a category called Your Money or Your Life, or YMYL: the same bucket it uses for legal and financial advice, reserved for pages that could affect a reader’s health, finances, or safety if the information is wrong or misleading. It’s a real, publicly documented classification, and it’s the reason healthcare SEO isn’t simply local SEO with a different logo on the proposal.

    A marketing agency that’s good at general local SEO has usually never had to build around that classification. It knows how to write a service page and manage a Google Business Profile. It hasn’t necessarily worked out what a scheduling widget quietly collects, who reviews a claim about a procedure before it goes live, or why a provider can’t respond to a negative review the same way a restaurant would. Those gaps are where a healthcare SEO agency either earns its higher price tag or turns into a liability, and the next section covers what to actually check for.

    Most practices build their shortlist of candidates through the same handful of channels: a referral from another practice administrator, a look through a healthcare marketing association’s member directory (groups like SHSMD keep one), a review of case studies from agencies that list medical or dental clients, or outreach that lands in an inbox on its own. None of those sourcing paths tell you whether an agency actually understands the parts of this work that differ from marketing anything else, and that’s the harder, second step. This guide covers that step: how to sort the agencies on your shortlist by the kind of practice you run, what to ask before signing, and which red flags carry more weight here than in most other industries.

    Where General SEO Experience Runs Out in a Medical Setting

    That gap shows up first in content review. A healthcare SEO company needs someone with relevant clinical or subject-matter background reviewing medical claims and terminology before a page publishes, even for something as routine as a service description or a provider bio. A generalist content team that’s used to writing about anything will usually move faster, but speed is exactly what YMYL content should be trading off against a real review step.

    Patient privacy is the second layer specific to this industry. Scheduling widgets, patient portals, symptom checkers, and some analytics setups can end up handling information that deserves extra care. A healthcare SEO agency doesn’t need to act as your compliance department. It does need to know enough to flag a tracking setup for your own privacy officer to review, rather than installing it and moving on.

    Reviews management carries a genuinely medical-specific constraint too: patient confidentiality generally means a provider can’t confirm or deny, in a public reply, that the person who left a negative review was ever a patient, even when the review is inaccurate and the provider knows exactly who wrote it. That limits how a practice can respond in ways a restaurant or retail business never has to think about. An agency used to handling reviews for retail or hospitality clients, where confirming a customer’s identity in a reply is routine, may default to a response style that creates a real problem here.

    Five Practice Types, Five Different Agency Fits

    Before comparing proposals, it helps to know which category of provider is realistically sized for your organization. Here’s roughly where five common practice profiles land.

    Solo practitioner or small group practice, one location. Think a single dentist, family physician, or therapist’s office. A local SEO freelancer or a small agency with healthcare experience can usually cover this: Google Business Profile management, a handful of well-written service pages, and a steady, modest content cadence.

    Multi-location group practice or dental service organization, several offices in one region. This is where thin, templated “city plus service” pages start to hurt more than help. A specialist medical SEO services provider that has actually built location pages with real local detail, not just a swapped city name, tends to earn its higher price tag here.

    Medspa, aesthetics, or elective-care practice. These businesses often face tighter ad platform restrictions and closer scrutiny on before-and-after content and outcome claims. An agency without specific experience in this space may not know what gets flagged until it happens to your account.

    Telehealth or direct-to-consumer health brand. Content here often spans multiple states and regulatory environments, and the marketing funnel looks more like a SaaS or ecommerce brand than a traditional practice. A generalist agency used to SaaS marketing may fit better than a local healthcare specialist, depending on the model.

    Hospital system or multi-specialty health network. This tier usually supports an in-house marketing or digital team, backed by a specialist agency or healthcare search engine optimization company for service-line content, technical SEO across a large site, and overflow capacity the in-house team doesn’t have.

    Watch for the same pattern at every tier. Agencies built on general local SEO may not have a real review process for medical claims. Agencies that also run paid media sometimes let SEO get whatever attention is left after the ad budget is set. A freelancer, however skilled, usually hits a ceiling once a practice passes a handful of locations or adds a second regulated service line.

    Vetting Questions for a Healthcare SEO Company

    Once you know roughly which category fits, the vetting conversation should cover:

    • Can you show me healthcare-client work specifically, ideally in a practice type similar to mine, and how visibility trended over time?
    • Who reviews medical claims and terminology before content publishes, and what’s their background?
    • How do you build location pages for a multi-office practice? Real local detail, or one template with the city swapped in?
    • How do you approach reviews management, including responding to negative reviews without confirming a patient relationship?
    • What’s your process for anything touching scheduling tools, intake forms, or patient portals, and do you loop in our privacy or compliance team before anything goes live?
    • What do you report on beyond keyword position, and do you track how the practice shows up when someone asks an AI engine a comparable question?
    • What happens to our content, backlink history, and account access if we end the engagement?

    An agency that answers all of these directly, even when the honest answer is “we’d need to check with your compliance team on that,” is usually a safer bet than one that only wants to talk about ranking positions.

    Signals an Agency Doesn’t Understand Medical Marketing

    Some warning signs apply to any SEO purchase. These five are worth weighing more heavily specifically because a medical practice is on the other end of the contract.

    • A guaranteed ranking position or a specific number of new patients written into the proposal. Nobody, including the agency pitching you, gets a vote on how a search algorithm ranks pages, and nobody gets a vote on whether a patient who finds the practice actually decides to book. Treat that kind of promise as a reason to keep looking, not as a selling point.
    • A team that can’t explain, even at a basic level, how it thinks about patient privacy on scheduling pages, intake forms, or analytics.
    • Reviews tactics that involve selectively soliciting only satisfied patients, or public responses to negative reviews that reveal or imply a specific patient’s visit details.
    • Dozens of near-identical location or service pages with no real local detail, especially for markets where the practice has limited or no actual clinical presence.
    • No one on the team who can describe a content review process for medical claims, or say who signs off before something publishes.

    Where AI Search Visibility Fits for Healthcare Practices

    People are starting to run comparison questions through ChatGPT, Gemini, Perplexity, and Google’s AI Overviews instead of typing them into a search bar: “best pediatric dentist in [city] for a nervous kid,” or “how urgent care and ER pricing usually compare.”

    There’s a second pattern worth naming on its own. These engines will often answer a general symptom or condition question in full, inside the chat window, without sending anyone to a website at all. Practically, that means the purely explanatory content every practice site has some version of, the “what is X” and “how do I manage Y” pages, is exactly the content most likely to get summarized and answered without producing a click, even when the practice’s own site is one of the sources behind the answer. Pages built around a judgment call an AI answer can’t responsibly make on its own, like whether a particular symptom combination warrants an in-person visit, or what to expect from a specific provider’s approach to a procedure, are more likely to still earn a visit. That’s a real shift in where content investment should go, not just a footnote for a healthcare SEO company’s monthly report.

    Nobody, including Topify, is in a position to say for certain whether an AI engine’s recommendation reliably turns into a booked visit. What’s reasonably clear is that this is worth tracking as an additional layer on top of local SEO fundamentals, not a replacement for a strong Google Business Profile and a healthy base of patient reviews.

    Topify’s free AI Visibility Report can show you, in a few minutes, how your practice and nearby competitors currently show up across ChatGPT, Gemini, Perplexity, and Google AI Overviews. Running it before you sign with any agency gives you a baseline to compare against later, with no commitment required.

    Frequently Asked Questions

    How long does healthcare SEO take to show results?

    It varies by practice type, market competitiveness, and how much content work is needed upfront. A single-location practice in a less competitive market may see movement sooner than a multi-location group competing in a dense metro. No agency can responsibly give you a fixed, guaranteed timeline, since neither they nor anyone else controls how quickly a search engine’s rankings or an AI engine’s answers shift.

    Do I need a healthcare-specific SEO agency, or will a general local SEO company work?

    It depends on your setup. A solo or small practice in a less competitive niche may do fine with a general local SEO provider that understands YMYL content basics. A multi-location group, a medspa, or a telehealth brand tends to get more value from a specialist with documented healthcare-client experience, largely because of the content review and privacy considerations involved.

    What should a healthcare SEO agency know about HIPAA?

    An experienced agency should be aware that patient privacy considerations can touch scheduling tools, intake forms, and analytics setups, and should know to loop in your practice’s own privacy or compliance officer rather than making that call unilaterally. Specific compliance questions belong with your compliance team or legal counsel, not with an SEO vendor.

    Can an SEO company guarantee more patients or a page-one ranking?

    No legitimate agency can guarantee this. Rankings depend on a search engine’s algorithm, and patient volume depends on many factors outside any vendor’s control, including a prospective patient’s own decision to book. Treat a guarantee attached to either outcome as a reason to walk away, not as a selling point.

    Does AI search visibility matter yet for medical practices?

    Enough to be worth a quick check, not enough to reorganize your whole strategy around yet. Patients are increasingly running comparison questions through AI engines that they used to type into Google, so knowing whether your practice shows up in those answers is useful information. It hasn’t been established that AI visibility reliably converts into booked visits the way ranking well in Google once did, and it’s additive to local SEO fundamentals rather than a substitute for them, but a baseline check costs nothing and takes a few minutes.


    Curious how your brand shows up in AI search right now?

    Topify tracks and improves brand visibility across ChatGPT, Gemini, Perplexity, and Google AI Overviews. Want to run the analysis yourself, or have a team run GEO and SEO for you end to end?

  • Best SEO Agencies for Law Firms: A Buyer’s Guide for Legal Marketers

    Best SEO Agencies for Law Firms: A Buyer’s Guide for Legal Marketers

    A marketing director at a personal injury firm in Tampa pulls up the firm’s Google Ads account and looks at the cost per click sitting next to “car accident lawyer tampa.” Whatever the exact figure on screen, it isn’t the cost of one signed case. It’s the cost of one click.

    Legal is one of the most expensive verticals in paid search. Based on Semrush data across a broad set of competitive legal search terms, CPCs on keywords like “personal injury lawyer,” “DUI attorney,” and “immigration lawyer” typically fall somewhere between $40 and $84, averaging around $60 a click.

    That backdrop changes what’s at stake when a firm hires an SEO agency. When paid clicks cost that much, organic and AI-driven visibility becomes a channel worth real investment. It also means a wasted year with the wrong agency, generic tactics, thin content, or a risky backlink strategy, tends to cost a firm more than a similar mistake would in most other industries.

    The right SEO agency for your firm isn’t the one with the longest client list or the flashiest case study. It’s the one whose team, process, and pricing actually match your firm’s size, practice area, and number of office locations, and who can walk you through a plan for your specific market instead of a template pitch deck.

    The YMYL Factor: What Sets Legal SEO Apart From a Typical Local Business

    Google classifies legal content as “Your Money or Your Life” (YMYL) content, the same bucket as medical and financial advice. Pages that could affect someone’s legal rights, custody arrangements, or finances get held to a higher bar for expertise and trust signals than a typical blog post.

    In practice, that means attorney bios, credentials, and who actually wrote or reviewed a page carry more weight for a law firm’s SEO than for most small businesses. An agency that treats a personal injury FAQ page the same way it treats a landscaping company’s blog post is missing something specific to this category.

    Most states also regulate how attorneys can advertise, through bar association rules on claims, disclaimers, and solicitation. An SEO agency is not your compliance department, and it shouldn’t try to be.

    One structural point is worth flagging before any pricing conversation starts: many states’ attorney conduct rules restrict or outright bar fee-splitting and pay-per-referral arrangements between lawyers and non-lawyers. That’s a real reason an SEO contract priced as “pay per signed case” can cross an ethics line in some jurisdictions, not just an aggressive pricing structure. Anything priced against case outcomes rather than the SEO work itself is worth running past your own compliance contact before you sign.

    What a legal-experienced agency should do is know these rules exist and build in a step where your firm reviews and signs off on wording before it publishes. For what your specific state bar actually requires, that conversation belongs with your own counsel or compliance team, not with an SEO vendor.

    Which Provider Tier Actually Fits Your Firm

    Before comparing proposals, it helps to know which category of provider is even sized for your firm.

    Firm profile Best-fit provider Why
    Solo practitioner or a 2 to 3 attorney firm, single office, one core practice area (family law, estate planning) Freelancer or a small local SEO consultant Local citations, a clean Google Business Profile, and a modest, steady content cadence usually cover it
    Boutique firm, roughly 4 to 10 attorneys, one or two offices in the same metro, a competitive practice area (personal injury, criminal defense) Legal-niche SEO or GEO specialist Compliance considerations and keyword competition are both heavier, which is where the specialist’s higher price tag starts to earn itself
    Regional firm, multiple offices across a state or a few neighboring states, several practice areas Specialist agency or a larger full-service shop with documented multi-location legal experience Needs a dedicated account team rather than a rotating pool of juniors
    National or multi-state firm, dozens of attorneys, a substantial ad budget In-house SEO hire, backed by a specialist agency retainer In-house covers day-to-day; the retainer handles overflow, technical audits, and strategy work the internal team doesn’t have bandwidth for
    Firm that just hired its first marketing coordinator but isn’t ready for a full internal team Hybrid: in-house point person plus an outside specialist retainer Common bridge setup for the heavier technical and content work

    The gap to check for at every tier is the same: local and boutique agencies that built their playbook on general local SEO may never have written content that satisfies legal YMYL expectations. Full-service shops that also run paid ads sometimes let SEO get whatever attention is left after the ad budget is spent. Freelancers, however good, usually hit a ceiling once a firm passes two or three offices or adds a second competitive practice area.

    Vetting Questions for a Law Firm SEO Agency

    Once you know roughly which category fits, the actual vetting conversation should cover:

    • Can you show me legal-client work specifically, not just your biggest client overall, and how that work has trended over time?
    • Who writes and reviews the content, and does someone with subject-matter knowledge sign off before it publishes?
    • How do you build pages and profiles for each office location? Are location pages written for that specific market rather than one template with the city swapped in, and does every Google Business Profile you manage for us correspond to a location where an attorney actually works?
    • Where do your backlinks come from, and can you name the sources? Real legal directories like Avvo, FindLaw, Justia, and Super Lawyers can send genuine referral traffic and reputable placements; the red flag is the network of look-alike directories built mainly to sell links, not the category of legal directories itself.
    • How do you handle attorney advertising compliance in practice, including fee arrangements, and will our firm get a review step before anything goes live?
    • What do you report on beyond keyword position, for example contact form submissions, call tracking, and how the firm shows up when someone asks an AI engine a comparable question?
    • What’s the minimum contract term, and what happens to our content, backlink history, and account access if we end the engagement?

    A firm that answers all of these clearly, even if the price is on the higher end, is usually a safer bet than one that talks mainly about rankings and deflects everything else.

    The Legal-Specific Red Flags a Generic SEO Checklist Won’t Catch

    Some warning signs apply to any SEO purchase. A few carry extra weight specifically for law firms:

    • Watch for any promise of guaranteed rankings, guaranteed lead volume, or guaranteed signed cases. Search rankings aren’t something any outside vendor controls, and neither is a prospective client’s decision to hire your firm, so treat a guarantee here as a reason to walk, not a starting point for negotiation.
    • Dozens of near-identical city or practice-area pages targeting markets where the firm has no licensed attorney or physical presence. Beyond the thin-content problem this creates on its own, it’s the same underlying pattern that gets Google Business Profiles suspended when it shows up in the map pack instead of in organic results.
    • A Google Business Profile pinned to an address where no attorney actually works, sometimes just a mailbox or a rented conference room, purely to rank in that city’s map pack. Google’s own guidelines on business locations rule this out, and it’s a shortcut common enough in local legal SEO that it’s worth asking a vendor directly whether they’ve ever set one up for a client.
    • No one on the team who can explain, even briefly, how they think about attorney advertising compliance or fee-splitting rules.
    • A backlink profile concentrated in low-quality legal directory networks that look built for links rather than for people actually looking for a lawyer.
    • Reporting that stops at rank position, with no visibility into actual contact form or call volume, and no clarity on who is producing the content itself.

    Where the High Cost of Legal Clicks Fits Into the Decision

    None of this means organic and AI-driven visibility can replace paid search for a law firm, or that investing in SEO guarantees a lower cost per lead than running ads. Both channels tend to work best together, and how they perform depends heavily on practice area, market, and competition.

    What the CPC backdrop does mean is that the downside of picking the wrong agency compounds faster in this vertical than in most others, simply because the paid alternative is already so expensive. A firm that spends a year on templated content and low-quality links isn’t just losing that year; it’s losing it in a market where the cost of testing an alternative, like paid search, is unusually high.

    Does a Law Firm SEO Agency Also Need to Track AI Search Visibility?

    People are increasingly running comparison-style questions through ChatGPT, Perplexity, Gemini, and Google’s AI Overviews instead of a traditional search bar: “best divorce lawyer in [city],” “how do I find an immigration attorney who handles asylum cases.”

    Nobody in legal marketing has solid data yet connecting an AI engine’s answer to an actual signed client, and any agency that tells you otherwise is guessing. For now, the honest framing is that this is a channel worth watching and measuring alongside traditional rankings, not one you can build a firm budget, or a vendor’s sales pitch, around just yet.

    Many legal-focused SEO shops built their entire reporting process around Google rankings and the local map pack, simply because that’s what mattered when they started. It’s fair to ask a prospective agency directly whether they track AI visibility at all, and to treat “we haven’t looked into that yet” as useful information rather than a dealbreaker on its own.

    Topify’s free AI Visibility Report can show you, in a few minutes, how your firm and your competitors currently show up across ChatGPT, Gemini, Perplexity, and Google AI Overviews. Running it before you sign with anyone gives you a baseline you can compare against later, no vendor commitment required.

    Frequently Asked Questions

    How long does law firm SEO take to show results?

    It varies significantly by practice area and market competitiveness. Meaningful movement in a competitive practice area like personal injury tends to take longer, often many months to over a year, than in a less contested niche like a single-attorney estate planning practice. No agency can responsibly give you a fixed, guaranteed timeline, since neither they nor anyone else controls how quickly a search engine’s rankings or an AI engine’s answers shift.

    Should I hire a legal-niche SEO agency, or is a general local SEO company fine?

    It depends on your practice area and footprint. A solo or small firm in a less competitive niche may do fine with a general local SEO provider that understands YMYL content basics. A firm competing in a crowded practice area, or managing several offices, tends to get more value from a specialist with documented legal-client experience, largely because of the compliance and content-review layer involved.

    What’s a reasonable monthly budget for law firm SEO?

    There’s no single number that applies across every market and practice area, and treat any blog post that hands you one precise figure with some skepticism. As a rough point of reference, a boutique firm in a single competitive metro tends to sit a notch below what a regional firm managing several offices typically budgets, and a national firm with dozens of attorneys tends to operate a tier above that again. Ask a prospective agency for a plan scoped to your specific offices, practice areas, and competition, and compare that scope, not just the sticker price, across proposals.

    Can an SEO agency guarantee my firm will rank on page one or bring in more cases?

    No legitimate agency can guarantee this. Rankings depend on a search engine’s algorithm, which no outside party controls, and case volume depends on a prospective client’s own decision to hire your firm, which no SEO tactic can control either. A guarantee attached to either outcome is one of the clearest signals to walk away.

    Do SEO agencies need to know my state’s attorney advertising rules?

    An experienced legal-marketing agency should know these rules exist, including the fee-splitting restrictions that shape how SEO work can be priced, and build a review step into their process before anything publishes. For what your specific state bar actually requires, that’s a question for your own counsel or compliance team, not something to rely on an SEO vendor to interpret for you.

    Does AI search visibility matter yet for law firms?

    It’s an emerging layer worth monitoring, since prospective clients are starting to ask AI engines the kind of comparison questions they used to type into Google. It’s not yet established that this reliably drives signed clients, and it doesn’t replace traditional local SEO or paid search, but checking your current baseline costs nothing.


    Curious how your brand shows up in AI search right now?

    Topify tracks and improves brand visibility across ChatGPT, Gemini, Perplexity, and Google AI Overviews. Want to run the analysis yourself, or have a team run GEO and SEO for you end to end?

  • 12 Months of AI Search Volume: What’s Growing, What’s Collapsing

    12 Months of AI Search Volume: What’s Growing, What’s Collapsing

    Your top keywords held position. Your domain authority didn’t move. Then the quarterly report came back with informational pages down double digits, and no core update to point at. The gap isn’t in your rankings. It’s in the layer above them, where an answer gets written before anyone scrolls to a blue link. AI search volume didn’t just grow over the past 12 months. It reallocated, fast enough that a year-old measurement setup is now reporting on a search experience that no longer exists.

    Your Rankings Held. The Clicks Didn’t.

    Start with what collapsed, because it’s the part most dashboards still can’t show you.

    The share of Google searches producing at least one click fell 9.51 percentage points between 2024 and 2026, a relative decline of 22.9%, according to SparkToro data. That figure includes paid clicks and clicks to Google-owned properties, so the drop reaching independent sites is steeper than the headline suggests.

    Position one absorbed most of the damage. When an AI Overview appears, the top organic result’s CTR falls from 31.7% to 19.8%, a 37.5% relative decline, while positions two through five lose about 12%. Ranking first stopped meaning what it meant two years ago.

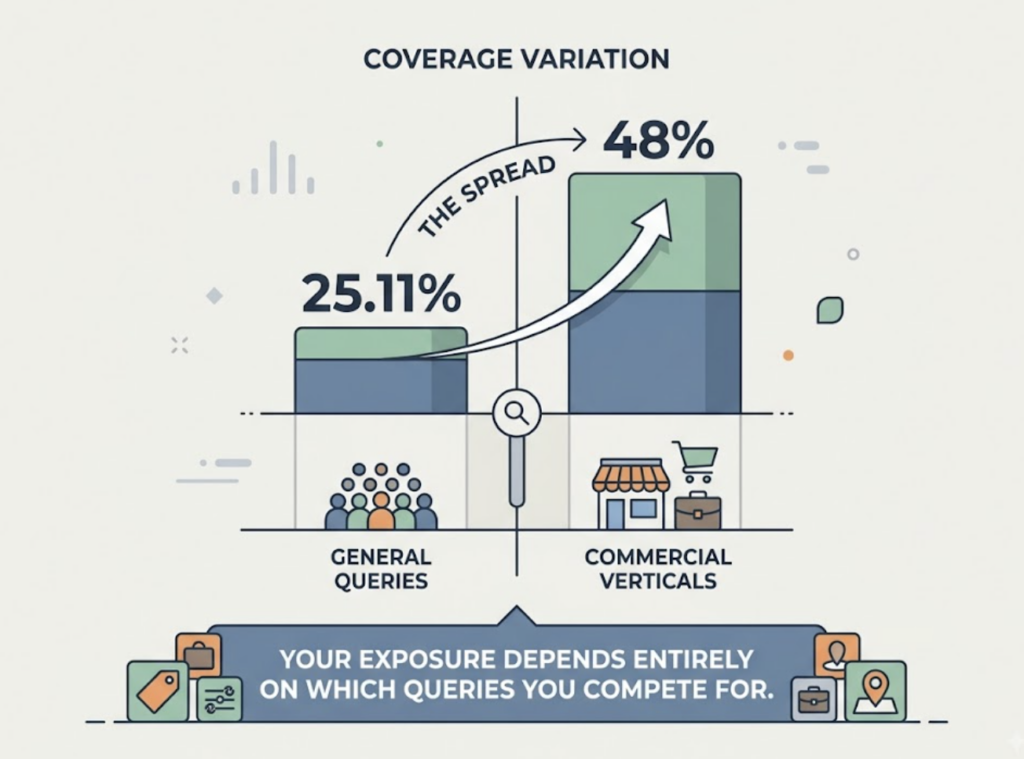
    Coverage kept expanding through the year. Conductor’s Q1 2026 benchmark across 21.9 million queries put AI Overview prevalence at 25.11%, while trackers focused on commercial verticals recorded roughly 48% by March 2026. The spread between those two numbers is itself useful: your exposure depends almost entirely on which queries you compete for.

    Behavioral data confirms the pattern rather than modeling it. Pew Research tracked real browsing sessions and found users clicked a traditional result 8% of the time when an AI Overview was present, against 15% when it wasn’t.

    That’s the collapse. Now the harder question: where did the demand go?

    What Grew in AI Search Volume Was Citation Frequency, Not Traffic

    The instinct is to measure AI search volume the way we measured Google, by counting sessions. That undercounts the shift by an order of magnitude, because most AI answers never produce a session at all.

    The number that actually moved is how often AI systems cite anything. Citation presence in US ChatGPT prompts rose from about 1.6% in June 2025 to roughly 6.8% by May 2026, and the rate splits hard by vertical: around 23% in Travel and Hospitality, around 20% in Automotive, under 4% in Professional Services. If you sell professional services, a citation-only strategy is competing for a very thin slice. If you sell travel, the slice quadrupled while most teams weren’t watching.

    Referral volume grew too, from a small base. One panel of 166 GA4 properties measured 6.77 million LLM-driven sessions and 12.8x growth over 19 months, from 47,606 sessions in November 2024 to 610,910 by May 2026.

    Here’s the part that changes how you value it. LLM-referred visitors convert at roughly 4.4x the rate of organic search visitors, because they arrive with intent already validated by the AI’s recommendation. A channel at 2% of your traffic doing 4x the conversion rate isn’t a rounding error in your reporting. It’s a line item you don’t have.

    Three Reports, Three Different Numbers for the Same Year

    This is where a lot of GEO strategy quietly goes wrong.

    Ask three credible sources what happened to ChatGPT’s share of AI referrals over the last 12 months and you get three incompatible answers. Similarweb’s traffic data shows ChatGPT sliding from roughly 76% of worldwide generative AI web traffic a year ago to around 53%, with Gemini past a quarter and Claude the fastest-growing platform in the category. The GA4 panel above reports 92.4% of AI referral traffic still coming from ChatGPT. A third study of B2B brand sites landed near 62.6%.

    None of them is wrong. They’re measuring different things: total platform web traffic, referral clicks landing on a specific panel of sites, and B2B-weighted brand referrals. Panel composition decides the answer.

    The takeaway isn’t that the industry data is unreliable. It’s that industry averages can’t tell you your number.

    Your category’s platform mix, citation rate, and answer position are properties of your queries, not of the market. That’s the gap a GEO rank tracker fills, and it’s why the tooling question stopped being optional sometime around the middle of last year.

    Why AI Search Volume Doesn’t Show Up in a Keyword Rank Tracker

    Two structural differences make the old instrument unusable here.

    The first is instability. A citation isn’t a ranking that decays over months. SISTRIX’s April 2026 citation drift study across six countries found 54 to 59% of cited domains shift week over week, with ChatGPT replacing roughly 74% of its cited domains each week. Monthly snapshots of something that turns over weekly produce noise, not trend lines.

    The second is that the query you optimize for isn’t the query the engine runs. ChatGPT produced 91% unique queries with only 13% word overlap with what the user typed, while Perplexity stayed close to the original phrasing at 88% overlap. Your keyword list and the engine’s internal fan-out are two different vocabularies, which is why keyword volume alone can’t stand in for AI search volume.

    DimensionKeyword rank trackerGEO rank tracker
    Unit of measurementPosition on a results pageFrequency of appearance inside an answer
    Query inputFixed keyword listPrompt sets, expanded to match engine fan-out
    Update cadence that makes senseWeekly to monthlyDaily to weekly, given citation drift
    Competitive readWho outranks you on one pageWho gets named alongside you, and in what order
    Failure mode it catchesRanking dropSilent removal from the answer with rankings intact

    That last row is the one worth sitting with. A brand can hold every ranking it had in 2025 and be absent from every AI answer in its category, and no traditional report will flag it.

    The Query Types Gaining Volume and the Ones Being Absorbed

    Aggregate volume hides the actual reallocation. Break it down by intent and the picture gets far more actionable.

    AI Overviews started as an informational feature and didn’t stay one. In January 2025, 91.3% of queries triggering an AI Overview were informational. By October 2025 that share had dropped to 57.1%, while navigational triggers went from 0.74% to 10.33%. Commercial intent moved into the overview layer during the same window.

    Comparison queries are now almost fully absorbed. Seer Interactive’s analysis of 49,353 queries found X vs Y comparison formats trigger AI Overviews 95.4% of the time, question formats 85.9%, and review queries 86.3%. If your content strategy leans on comparison and review pages, that traffic is being answered upstream of your page.

    The AI-native platforms tilt the other way. Informational and research queries make up about 58% of ChatGPT Search volume, while purely transactional queries account for roughly 3%. Publishers and top-of-funnel content took the hit first. Ecommerce and transactional pages have been slower to feel it.

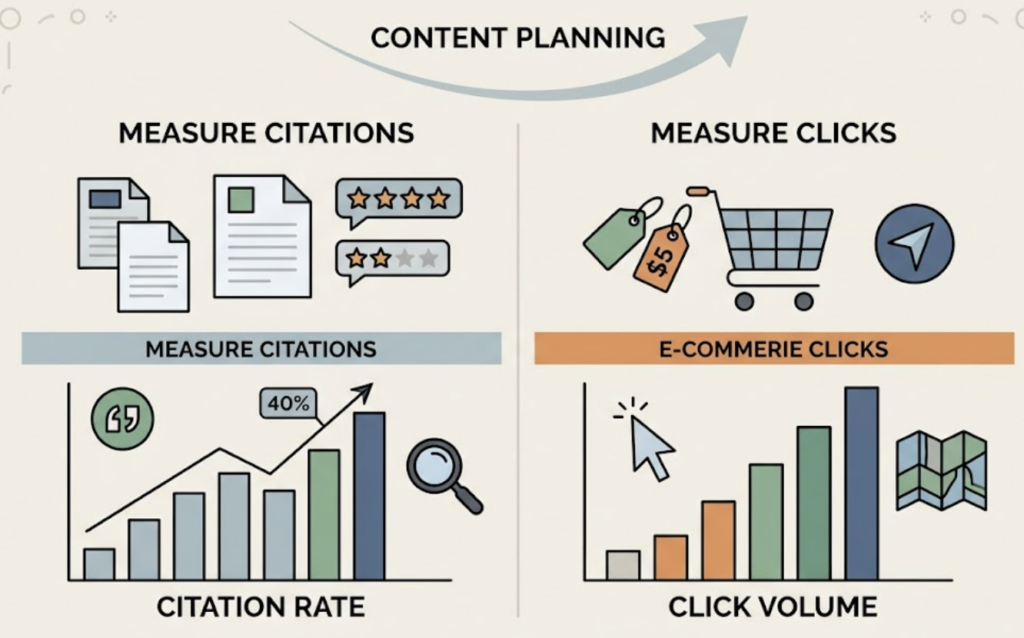
    Read those three datasets together and the planning implication is clear. Comparison, review, and definitional content should be measured on citation rate, not click volume. Transactional and navigational pages should still be measured on clicks, for now.

    Being cited still pays, even on the click side. Per million impressions on informational queries, cited brands take roughly 20,743 clicks against 9,445 for uncited brands on the same AI Overview query. Citation is worth more than double the residual traffic of non-citation.

    What Belongs on Your GEO Rank Tracker for the Next 12 Months

    Given the drift rates and the intent reshuffling above, four things need continuous measurement rather than quarterly audits.

    Cross-platform visibility, weighted to your audience. Platform share disagreements in the public data mean you need your own read on which engines actually send and influence your buyers.

    Prompt-level volume, not keyword volume. Prompt demand and keyword demand are related but not interchangeable, and brand-direct prompts behave differently from open-ended ones: they trigger a site-specific query against the named brand’s domain 40% of the time versus 16% for open-ended prompts. Those are two separate markets inside one category.

    Position relative to competitors, not just presence. Being named third in a five-brand answer is a different outcome from being named first, and presence-only tracking flattens that distinction.

    The source domains behind each answer. With most cited domains rotating weekly, knowing which third-party pages carry your mentions is what makes a visibility drop diagnosable instead of mysterious.

    Topify is built around that combination. It monitors brand performance across ChatGPT, Gemini, Perplexity, and other major engines on seven metrics: visibility, sentiment, position, volume, mentions, intent, and CVR. In practice, that means a drop in ChatGPT mentions can be traced back to a specific source domain that stopped citing you, inside the same view where you spotted the drop. High-value prompt discovery keeps surfacing new prompts as recommendation patterns shift, and competitor benchmarking shows who the engines are naming instead of you. Plans start at $99 per month for 100 tracked prompts, which is roughly the size of a first serious prompt set for a single category.

    Whatever tool you use, the cadence matters more than the vendor. Weekly, at minimum, on a fixed prompt set.

    Conclusion

    The last 12 months didn’t reduce search demand. They relocated it, from a ranked list you could measure with one tool into a synthesized answer that changes composition every week. Clicks fell hardest on the query types that used to feed top-of-funnel content. AI search volume grew fastest in categories most brands weren’t tracking at all.

    Start with your 30 highest-intent prompts, not your keyword list. Measure how often you appear, in what position, and which domains carry the mention. Run it weekly for a quarter. That baseline is worth more than any industry benchmark, because it’s the only number that describes your brand. You can get started with Topify on a single project to see where the gaps sit before committing to a full prompt set.

    FAQ

    Q: What is AI search volume, and how is it different from keyword volume? 

    A: Keyword volume counts how many times a phrase is typed into a search engine. AI search volume describes how much demand flows through prompts on platforms like ChatGPT, Gemini, and Perplexity. The two overlap but don’t map cleanly, since a single keyword can fan out into hundreds of distinct prompts phrased in natural language.

    Q: How do I get AI search volume or prompt volume data? 

    A: There’s no public equivalent of Keyword Planner for AI prompts. Most teams use two proxies: existing keyword volume as a demand signal, and prompt-level tracking of a fixed prompt set to measure how often the brand surfaces. Segment brand-direct prompts from open-ended ones, since they behave differently.

    Q: How is a GEO rank tracker different from a traditional rank tracker? 

    A: A keyword rank tracker answers “where does this page sit on a results page.” A GEO rank tracker answers “does the answer mention us at all, and why.” The difference matters because rankings can stay flat while AI mentions disappear, and no SERP-based report will surface that.

    Q: How often should I track AI citations? 

    A: Weekly at minimum. With more than half of cited domains rotating week over week on major platforms, monthly checks smooth over the exact movements you’d want to act on.

    Read More

  • AI Search Volume: 12 Prompts Google Keyword Tools Can’t See

    AI Search Volume: 12 Prompts Google Keyword Tools Can’t See

    Export your keyword list, sort by monthly volume, delete every row that reads zero. SEO teams have run some version of that cleanup for a decade, and it worked fine when Google was the only front door.

    Then the questions moved into chat. Seer Interactive tracked 501 prompts through Gemini 3 and found that 95% of the queries the model generated had zero global search volume. The rows you deleted are the ones AI engines are actually running, and AI search volume is the metric that finally puts a number on them.

    Keyword Volume Comes From Google. AI Search Volume Doesn’t Exist There.

    Keyword volume is built from clickstream data and Google’s own reporting. AI platforms don’t publish prompt counts, so nothing that happens inside ChatGPT, Gemini, or Perplexity flows back into your keyword database.

    Demand didn’t disappear. It fragmented.

    When someone types “best CRM” into Google, that phrase aggregates across millions of users and registers as volume. When the same person asks an AI assistant which CRM fits a ten-person sales team that lives in Gmail, that sentence may never be typed the same way twice. Seer found only 1% overlap across its full fan-out dataset, meaning almost every query the model wrote was unique.

    There’s a second problem, and it’s on the tracking side. AirOps analyzed 245,000 prompts its customers were monitoringand found the list peaked at six to seven words, with very little coverage past ten. Teams that have started tracking AI prompts are still tracking keywords with extra words attached.

    Real prompts run longer, carry constraints, and end in a question mark.

    What AI Search Volume Measures That Keyword Volume Can’t

    The two metrics answer different questions. One tells you how many people typed a string. The other tells you how often a question gets asked in a chat window, and whether your brand survives the answer.

    Keyword Search VolumeAI Search Volume
    Data sourceClickstream and search engine reportingPrompts run directly against AI platforms, modeled from panels and APIs
    Query length3 to 4 words15 to 30 words, often multi-turn
    PrecisionReported with reasonable accuracyDirectional, with wide error bars
    What a win looks likePosition in a list of 10 linksBeing named in one synthesized answer alongside two or three rivals
    Refresh logicMonthly averagesAnswers change between runs, so tracking has to be continuous

    That fourth row is the one that reframes strategy. A search results page gives ten brands a shot at the click. An AI answer names three, maybe five, and the rest of the category is invisible for that prompt.

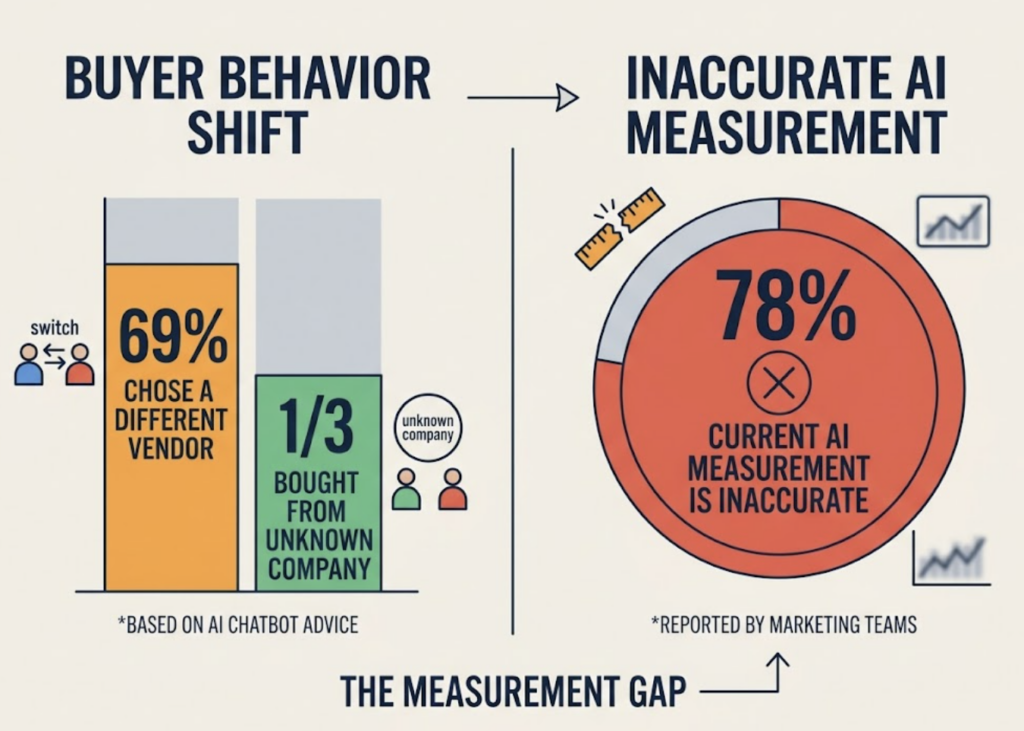
    The stakes show up in buyer behavior. In G2’s March 2026 survey of 1,076 B2B software buyers, 69% chose a different vendor than they originally planned based on what a chatbot told them, and a third bought from a company they’d never heard of. Measurement hasn’t kept pace: 78% of marketing teams say their current approach to measuring AI visibility is inaccurate.

    12 Prompts With Zero Google Volume but Real AI Search Volume

    Every prompt below returns a brand recommendation from at least one major AI platform. None of them will show meaningful volume in a standard keyword tool, because nobody types sentences like these into a search box.

    B2B SaaS

    1. “Which CRM works for a 10-person sales team that already lives in Gmail and doesn’t want a paid onboarding package?”
    2. “We’ve outgrown our help desk tool but the support team hates migrations. What should we shortlist?”

    Software is where the shift is furthest along. G2 found that 51% of B2B software buyers now start research in an AI chatbot more often than in a search engine, up from 29% a year earlier. It’s also the vertical where models work hardest: software prompts fan out into more sub-queries than any other category, which means more chances for a competitor’s comparison page to get pulled in ahead of yours.

    Ecommerce and Retail

    1. “I need a winter coat that handles a Chicago commute and weekend hikes, under $300, not too bulky.”
    2. “My kid’s school banned peanut products. Which lunchbox snack brands are actually safe?”

    Roughly 2% of ChatGPT queries involve shopping, which works out to about 50 million shopping queries a day against an estimated 2.5 billion daily prompts. Retail prompts stack constraints the way shoppers actually think: use case, budget, climate, dietary restriction. Category pages built around head terms rarely satisfy all four at once.

    Healthcare

    1. “My mother is 78 and on blood thinners. Which home blood pressure monitors are easiest for her to read and use?”
    2. “Is there a dermatology clinic near me that takes my insurance and does mole mapping?”

    Healthcare buyers arrive with context they’d never put in a search bar. That context is exactly what makes the prompt convert. ChatGPT referral traffic in healthcare converts at about 4.5%, well above typical site baselines, because the model has already filtered for age, condition, and constraint before the visitor lands.

    Travel and Hospitality

    1. “Where should we stay in Kyoto with a stroller and no car, walking distance to a train station?”
    2. “We have 26 hours in Doha on a layover. Is it worth leaving the airport, and where would we stay?”

    Travel leads every industry in AI adoption. 47% of travel and hospitality customers now use ChatGPT somewhere in their purchasing journey, ahead of retail and CPG at 36% and IT services at 34%. Hotels and resorts also post the highest AI referral conversion rate in First Page Sage’s dataset, near 7.0%. A property either makes the model’s three-hotel list or it doesn’t exist for that trip.

    Legal and Professional Services

    1. “My landlord kept my deposit after I moved out of a Chicago apartment. Do I need a lawyer or can I handle this myself?”
    2. “We’re a 12-person agency hiring our first employee in another state. What do we need to get right?”

    Legal prompts almost never match a keyword, because the facts of the situation are the query. They also convert unusually well, around 5.6% from ChatGPT traffic, since anyone describing their own dispute to a model is already past the browsing stage.

    Finance and Fintech

    1. “I’m self-employed with irregular income. Which business checking accounts don’t charge fees for low balances?”
    2. “We have $40K in savings and a 6.8% mortgage. Should we refinance or pay down principal first?”

    Financial prompts carry numbers, timelines, and eligibility conditions in a single sentence. That’s four or five retrieval dimensions from one question, and each dimension pulls its own set of sources. Brands that publish only rate tables tend to lose these answers to explainer content from someone else.

    Why These Prompts Never Show Up in Search Volume Data

    Three structural reasons, and none of them are going away.

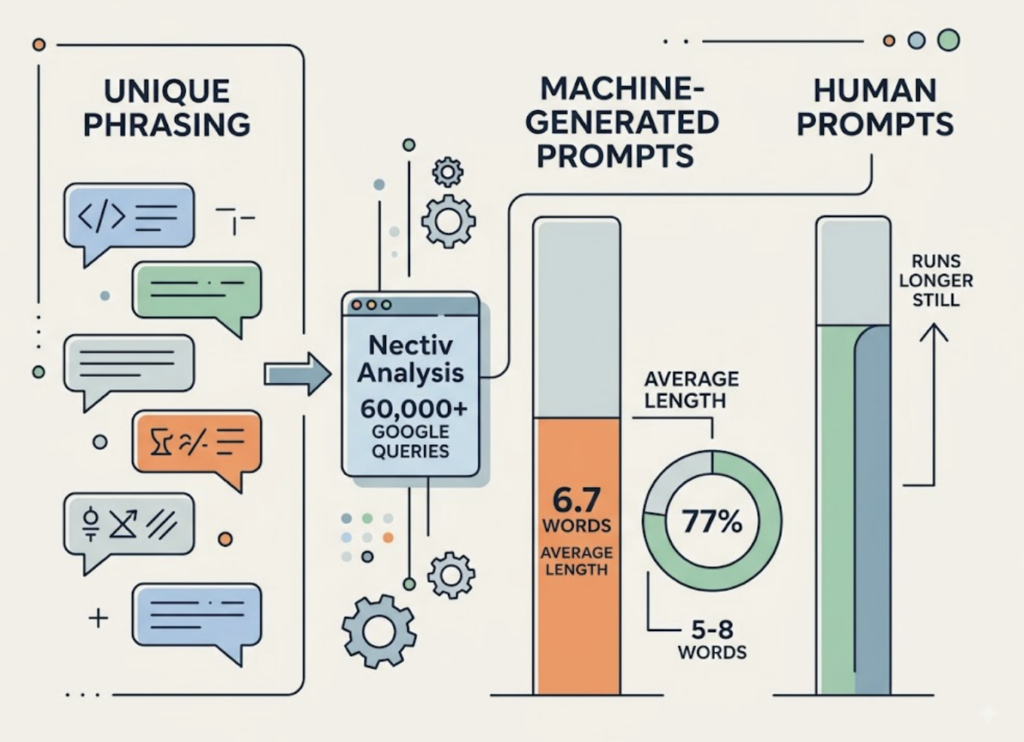
    Phrasing is unique. Every user describes their own situation, so demand never aggregates into a countable string. Nectiv’s analysis of more than 60,000 Google fan-out queries found an average length of 6.7 words on the machine-generated side alone, with 77% falling between five and eight words. Human prompts run longer still.

    Follow-ups are invisible. The second and third turns of a conversation are where the shortlist gets built, and no keyword tool has ever seen a second turn.

    Many questions are new. Roughly 15% of daily searches are queries with no historical data at all. A tool that reports averages can’t report on something that happened for the first time this week.

    Zero volume doesn’t mean zero demand. It means zero measurement.

    How to Estimate AI Search Volume for Your Own Category

    Start with real language, not exports. Pull the phrasing from sales call recordings, support tickets, and Reddit threads in your category. You want the sentence the buyer actually said, including the constraint that makes it specific.

    Add persona variables. Take a base prompt and layer on team size, industry, budget, and use case. One question becomes eight, and each version can return a different brand list. This is how models personalize, so your tracking set should mirror it.

    Balance the intent mix. Most brands over-index on comparison prompts and ignore the rest. Cover awareness, consideration, comparison, transactional, and generative intents, with a handful of prompts per type before you scale up the count.

    Automate the runs. Answers shift between platforms and between days, so a screenshot is a data point with a shelf life of about an hour.

    That last step is where a purpose-built platform earns its cost. Topify runs high-value prompt discovery continuously, surfacing new questions as AI recommendation patterns move, then works as an AI search rank tracker across ChatGPT, Gemini, Perplexity, DeepSeek, and other major engines so you can see where your brand sits relative to competitors in each answer. Source analysis closes the loop by showing which domains the models cited to build that answer, which is usually the fastest route to understanding why a competitor made the list and you didn’t. Seven metrics sit behind it: visibility, sentiment, position, volume, mentions, intent, and CVR.

    Three Mistakes Teams Make With Zero-Volume Prompts

    Tracking only head terms. A list of 40 category keywords with question marks appended is not a prompt set. It’s your old keyword list in costume, and it will report healthy numbers while you lose the specific, constrained questions where buying decisions get made.

    Treating screenshots as data. Manual spot checks can’t produce trend lines, and trend lines are the only way to tell a real drop from normal answer variance.

    Ignoring competitors. Your own mention rate means little without the relative view. Crackle PR’s Q2 2026 benchmark found 51% of B2B tech brands have zero citations across ChatGPT, Perplexity, and Gemini. In a category that empty, the brands that do show up own the whole answer.

    Conclusion

    The rows you deleted from that keyword export are now the competitive surface. Prompts with no measurable Google volume are where buyers describe their actual situation, and where models decide which three brands are worth naming.

    Start small. Pick 20 prompts your customers have literally said out loud, run them across the platforms your buyers use, and see who the models recommend today. The gap between that answer and your positioning is your real GEO backlog. You can start tracking with Topify and have a baseline before your next reporting cycle.

    FAQ

    What is AI search volume? 

    AI search volume estimates how often a specific prompt gets asked inside AI platforms like ChatGPT, Gemini, and Perplexity over a given period. It’s the closest equivalent to keyword search volume, with one important difference: platforms don’t report it, so figures are modeled from panels and API sampling and should be read as directional rather than exact.

    Can prompts really have zero Google search volume but high AI usage? 

    Yes, and it’s the norm rather than the exception. Research on Gemini’s query fan-out behavior found 95% of generated sub-queries carried no global search volume, largely because models write those queries at runtime and users phrase their own prompts differently every time.

    How do I find AI search volume for my industry? 

    Start from real buyer language in sales calls, support tickets, and community threads, then run those prompts across multiple AI platforms and log how often your brand appears. Coverage across intent types tells you more than a single volume figure for any one prompt.

    How many prompts should I track? 

    Most teams start between 50 and 100, weighted toward consideration and comparison intent, then expand as they see which themes actually return brand recommendations. Coverage matters more than raw count.

    Read More

  • AI Search Volume vs Google Volume: Why They Barely Correlate

    AI Search Volume vs Google Volume: Why They Barely Correlate

    Your keyword list is sorted by search volume. It always has been. The top rows get the content budget, the bottom rows wait until next quarter, and nobody questions the ordering because the numbers come from a tool everyone trusts.

    Then you run those same top-row keywords through ChatGPT and the answers come back about something adjacent. Not wrong, just different. The prompts people actually type look nothing like the four-word strings in your spreadsheet.

    There are two demand numbers for the same topic now. One is measured and familiar. The other, AI search volume, is estimated, invisible to keyword tools, and moving in a direction the first one can’t predict. Closing that gap is what a geo rank tracker exists to do.

    The Same Keyword Has Two Demand Numbers, and They Don’t Move Together

    Start with how differently people phrase the same need. Semrush found the average AI Mode query runs 7.22 words against 4.0 words for a traditional Google query, and full ChatGPT prompts average around 23 words when the search interface is off.

    That isn’t noise around a shared average. It’s a different input format producing a different retrieval path.

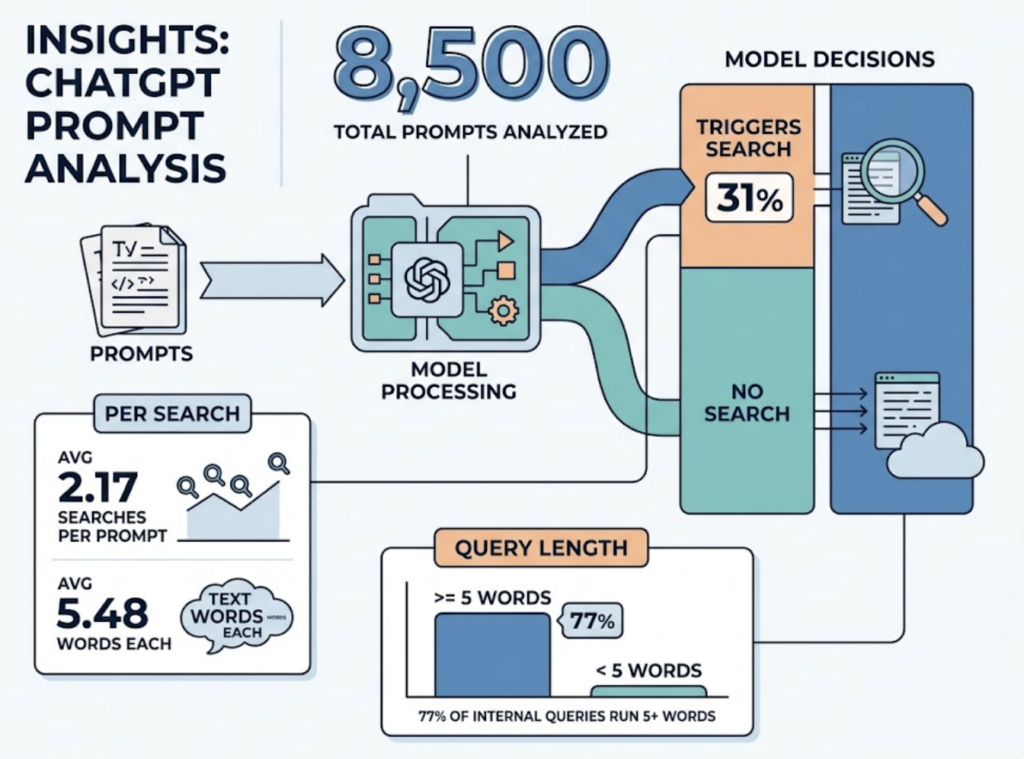
    What the model does with that input widens the gap further. Nectiv analyzed 8,500 prompts and found ChatGPT triggered a search in 31% of them, averaging 2.17 searches per prompt at about 5.48 words each. Nearly 77% of those internal queries ran five words or longer.

    So a single prompt fans out into two or three machine-written queries that were never in anyone’s keyword database. Your Google volume figure describes none of that.

    Why Keyword Tools Can’t See AI Search Volume at All

    The blind spot is structural, not a lag in tool development. Keyword Planner, clickstream panels, and search console exports all measure queries typed into a search engine. Prompt data sits inside OpenAI, Anthropic, and Google, and none of them publish it.

    The scale of what’s missing is the uncomfortable part. AI assistants now generate an estimated 45 billion monthly sessions globally, roughly 56% of traditional search engine volume, with the genuinely search-equivalent share closer to 28%. None of that activity registers in a keyword tool.

    Ahrefs framed the measurement problem cleanly: AI breaks the three assumptions rank tracking was built on. Results are probabilistic rather than deterministic, positions aren’t fixed, and prompt volume is hidden demand that no one can query directly.

    Here’s the practical read. AI search volume, wherever you get it, is a sampled estimate rather than a census. That’s a real limitation, and it’s still more information than an empty column.

    Head Terms Are Shrinking Exactly Where AI Search Volume Is Growing

    The structure of keyword demand is shifting underneath the numbers you already have. Brainlabs pulled 1.35 million keywords across nine UK categories and found head terms in structural decline in seven of the nine, with longtail growing.

    Pair that with what Semrush saw in 260 billion rows of clickstream data: users who adopted ChatGPT showed no statistically significant drop in daily Google sessions. People didn’t leave Google.

    They changed what they ask it.

    That combination is the one most teams miss. If session counts hold steady while head terms decay and longtail expands, the loss isn’t traffic volume in aggregate. It’s the predictive power of the specific metric your priority list is sorted by.

    Rankings Break the Same Way Volume Does

    Volume isn’t the only SEO signal that stops transferring. Ahrefs ran 15,000 long-tail queries through Google, Bing, and four AI assistants and measured an average citation overlap of about 11% with the top 10. Looked at from the other direction, roughly 12% of AI-cited URLs rank in Google’s top 10 for the original prompt.

    Longitudinal data points the same way. Research summarized by 5WPR tracked the overlap between top-ranking pages and AI-cited sources falling from around 70% to under 20%, and still declining.

    At the brand level it gets concrete. An analysis of 150 SaaS companies across 120 keywords found 44% of Google top-10 brands received zero ChatGPT citations for the same keywords, and organic traffic correlated with ChatGPT citations at only r = 0.23.

    One caveat worth keeping, because the picture isn’t uniform across platforms. Ahrefs’ study of AI Overview citations found 76.1% of cited pages rank in Google’s top 10. Google’s own answer layer still leans heavily on Google’s index. ChatGPT is the outlier, and it’s also where most of the prompt volume sits.

    Treat “AI search” as one channel and you’ll average away the differences that matter.

    What a GEO Rank Tracker Measures That a Keyword Tool Doesn’t

    The unit of measurement has to change before the metrics mean anything. Keyword tools count queries and positions. A geo rank tracker samples prompts and measures how often a brand shows up inside the answer.

    DimensionTraditional rank trackerGEO rank tracker
    Unit trackedKeyword stringPrompt and its query fan-out
    Result typeFixed position, 1 to 100Mention, order within answer, cited or not
    Demand signalGoogle search volumeEstimated AI search volume across platforms
    CoverageOne engine’s indexChatGPT, Gemini, Perplexity, AI Overviews and others
    StabilityDeterministic, repeatableProbabilistic, needs repeated sampling
    Competitive viewWho outranks youWho gets recommended instead of you

    The sampling requirement is the part teams underestimate. One prompt run once tells you almost nothing, because the same prompt can return different brands on the next call. Directional accuracy comes from running many prompts repeatedly and reading the aggregate, which is why prompt count and refresh frequency matter more in AI visibility tracking than they ever did in rank tracking.

    How to Rebuild Your Keyword Priority List Around AI Search Volume

    Four steps, in order.

    Sample real prompts before estimating anything. Pull the questions your sales team, support tickets, and community threads actually contain, then compare them against synthetic prompt lists. Real user phrasing tends to be longer and more problem-shaped than what a keyword-to-prompt converter produces.

    Run both numbers side by side. Keep Google volume in the sheet. Add estimated AI search volume as a second column rather than a replacement, and sort by the gap between them. Keywords where AI search volume runs high and your mention rate runs low are the underpriced ones.

    Don’t apply this to every keyword. Intent decides. NP Digital’s analysis found navigational queries account for 34.6% of search volume but trigger AI Overviews only 1.5% of the time, while informational queries make up 49.6% of volume and trigger them 45.9% of the time. Branded and navigational terms still behave like classic SEO. Informational and comparison terms are where AI search volume changes the ranking of your priorities.

    Recheck weekly, not quarterly. Prompt phrasing and citation patterns move faster than SERPs do. A priority list built on a single snapshot ages out in about a month.

    Where a Platform Fits in This Workflow

    Running the loop manually across four platforms is where most teams stall out. Topify tends to fit here because volume isn’t a standalone report inside it. Prompt-level volume sits in the same view as visibility, mentions, position, sentiment, intent, and CVR, so a keyword with strong AI demand and a zero mention rate surfaces as one row rather than as a manual join between two exports.

    Its prompt discovery works on the hidden-demand problem directly, surfacing high-volume prompts in a category as AI recommendations shift, then tracking whether the content you publish against them actually changes the citation pattern. Competitor benchmarking runs on the same prompt set, which answers the question rank tracking can’t: not who outranks you, but who the model names when you aren’t mentioned. You can get started on a single project before rolling it across a full keyword library.

    Conclusion

    Google search volume and AI search volume describe two different populations asking two differently shaped questions, and the published data gives no reason to expect the first to predict the second. Keyword demand is shifting toward longtail while head terms decay, and citation overlap with Google’s top 10 keeps falling. The fix isn’t abandoning search volume. It’s stopping the practice of using one number to price both channels. Add AI search volume as a second column, sort by the gap, and let a geo rank tracker tell you which of your best-ranked keywords the models have never heard you associated with.

    FAQ

    Q: What is AI search volume? 

    A: An estimate of how often a given prompt or topic gets asked across AI platforms like ChatGPT, Gemini, and Perplexity. Since none of those platforms publish prompt data, every AI volume figure is modeled from sampling rather than reported directly, which makes it useful for ranking priorities and unreliable as an absolute count.

    Q: Does Google search volume predict AI visibility? 

    A: Weakly at best. Research on 150 SaaS brands found organic traffic correlated with ChatGPT citations at r = 0.23, and 44% of brands ranking in Google’s top 10 got no ChatGPT citations at all for the same keywords. Google AI Overviews are the exception, since they still pull most citations from top-10 pages.

    Q: How do I find high-volume AI prompts? 

    A: Start with real user language from sales calls, support tickets, and community threads, then expand it with prompt discovery that samples live AI answers. Converting existing keywords into questions is a reasonable starting point, though it tends to produce shorter and more generic prompts than what users actually type.

    Q: How is a geo rank tracker different from a traditional rank tracker? 

    A: A traditional rank tracker returns a fixed position for a keyword in one index. A geo rank tracker samples prompts repeatedly across several AI platforms and reports whether your brand is mentioned, where it falls in the answer, and which sources the model cited. The output is a share of answers over time rather than a single number.

    Read More

  • The GEO Rank Tracker Report Your CMO Will Actually Read

    The GEO Rank Tracker Report Your CMO Will Actually Read

    You open the quarterly review with a visibility chart that’s up 12 points. The room nods. Then your CMO asks what that number means for pipeline, and the honest answer is that you don’t have one. Three slides later she’s checking her phone. The tracking wasn’t the failure. The report was, because nothing on it answered a question anyone in that room was accountable for.

    Your GEO Rank Tracker Isn’t the Problem. The Translation Layer Is.

    Budget has already moved. Marketers now route roughly 24% of search and content budgets toward AI visibility work, and among 300 enterprise marketing executives surveyed by Search Engine Journal, 65% are allocating at least a quarterof their entire marketing budget to AI.

    Measurement didn’t move with it. In the same survey, two-thirds said they were very confident in measuring outcomes, then 66% reported challenges with the basics of measurement when asked in more detail. Confidence and capability are running on separate tracks.

    The gap shows up at the reporting layer, not the collection layer. Only 14% of marketers track AI visibility at all, and among those who do, Semrush found just 22% describe their SEO and AI search work as fully integrated across strategy, execution, and reporting. Reporting is the word that keeps falling off the end of that list.

    So the constraint isn’t your GEO rank tracker. It’s that raw tracker output is written for the person who set up the prompts, and your CMO is not that person.

    The First Page: Five Numbers, and Nothing Else

    An executive report has one page that matters. Everything else is defense material for questions that may never come.

    Put five rows on it:

    RowWhat it showsThe question it answers
    AI Visibility Score, 90-day trendOne weighted number across your priority prompt setAre we gaining or losing ground?
    Share of voice vs top 3 competitorsYour mention share against named rivals, by categoryIs the gap widening or closing?
    Platform splitChatGPT, Gemini, Perplexity, AI Overviews as four barsWhere do we win, and where are we absent?
    Sentiment mixPositive, neutral, negative, qualifiedIs AI describing us the way we position ourselves?
    Attributable outcomesAI referral sessions, AI-attributed conversions, branded search liftWhat did this produce?

    Two of those rows carry most of the weight.

    Share of voice is the one that survives scrutiny, because a number with a competitor next to it can’t be dismissed as noise. Semrush’s study of 481 marketers found 37% say competitors are mentioned more often than they are in AI answers. That’s a comparison your CMO already suspects is true and has no data on.

    Sentiment is the second, and it’s usually underplayed. In the same study, 30% reported their brand is described inaccurately by AI systems and 29% said their positioning comes across as generic. A brand manager who has spent two years on category positioning will care more about that row than about any score.

    Flag any category where negative or qualified mentions exceed 10% of total mentions. That’s the threshold worth escalating.

    What Belongs in the Appendix, Not the Headline Row

    Here’s the filter that keeps executive trust intact: if finance can’t tie a metric to a dollar, it doesn’t belong in the headline row. Raw mention counts, per-prompt screenshots, single-day scores, and unweighted prompt coverage all fail that test. They belong in the appendix, where they’ll do their real job of answering follow-up questions.

    The cost of getting this wrong isn’t a boring meeting. It’s cumulative. Only 32% of CEOs currently trust their CMOs, and 34% of Fortune 500 companies have removed the CMO role from the C-suite entirely. Your report is one input into that dynamic, and a page of impressive-looking activity metrics pushes in the wrong direction.

    The Spring 2026 CMO Survey puts a number on the pressure your CMO is passing down. Marketing leaders rate their partnership with the CFO at 4.8 on a 7-point scale for growth planning, and the case-building score has crept from 4.3 to 4.5 over four years. Your CMO isn’t asking about revenue to be difficult. She’s asking because someone is asking her.

    Translating AI Visibility Into Revenue Language

    The conversion data is the strongest card you have, and most reports leave it in the deck.

    AI referral traffic is small. Conductor’s study across 13,770 domains put it at roughly 1.08% of total sessions. If you lead with volume, you lose.

    Lead with quality instead. Semrush’s research across 500-plus high-value topics found AI search visitors converting at 4.4x the rate of traditional organic visitors. Ahrefs published its own numbers showing 0.5% of sessions from AI platforms driving 12.1% of all signups. In Seer Interactive’s multi-vertical data, ChatGPT referrals converted at 15.9%against 1.76% for Google organic.

    The mechanism is worth saying out loud in the meeting, because it’s what makes the multiple believable: the AI answer does the shortlisting before the click. By the time someone arrives, they’ve already been pre-qualified by the model.

    One more line for context. Conductor pegs ChatGPT at roughly 87.4% of average AI referral traffic across industries. If your platform split shows you strong on Perplexity and weak on ChatGPT, that’s not a balanced scorecard. That’s a concentrated risk, and it’s worth naming as one.

    The Volatility Problem Your CMO Will Find Before You Do

    AI answers are not stable, and your report has to say so before someone else discovers it.

    AirOps found that only 30% of brands stay visible from one answer to the next, and just 20% remain visible across five consecutive runs of the same prompt. A single run tells you almost nothing. A month of runs tells you something real.

    That leads to three reporting rules worth adopting permanently:

    Report trends, never single points. A 90-day line with a stated sample size is defensible. A screenshot from Tuesday is not.

    Disclose the sample. How many prompts, how many runs per prompt, which platforms, over what window. One sentence in the footer. It costs you nothing and it’s the first thing a skeptical CFO will ask for.

    Reset the baseline when models change. A platform’s model update can shift citation behavior across your whole prompt set. When that happens, annotate the chart rather than explaining the dip verbally three weeks later.

    Volatility disclosed is credibility. Volatility discovered is a problem.

    Say the Attribution Gap Out Loud

    Most AI-driven visits don’t identify themselves. Analysis of 446,000 visits found 70.6% of AI traffic landing as “Direct”in GA4, because the user read your name inside a chat interface, opened a new tab, and typed your URL.

    That means your AI-attributed conversion row is a floor, not a total. Say exactly that in the footnote.

    Teams hide this because it feels like admitting weakness. It’s the opposite. A report that overstates attributable outcomes gets audited once and never trusted again. A report that states its own floor and shows branded search lift alongside it survives the audit.

    Pair the referral number with branded search volume and direct traffic trend. When all three move together and your visibility score climbs, you have a correlation story that holds up in a room full of people who don’t take single-source numbers at face value.

    Where a GEO Rank Tracker Earns Its Line Item

    The five-row first page only works if one system produces all five numbers on the same sampling basis. Stitching visibility from one tool, sentiment from a second, and competitor data from a spreadsheet gives you five numbers that can’t be compared to each other.

    That’s the practical case for consolidation. Topify tracks seven metrics across major AI platforms in a single view: visibility, sentiment, position, volume, mentions, intent, and CVR. The mapping to an executive page is close to one-to-one. Visibility feeds the trend line, position and mentions feed share of voice, sentiment feeds the description row, and CVR carries the conversion likelihood argument that most dashboards leave to the analyst’s judgment.

    Competitor coverage is what makes the chart defensible rather than self-reported. Dynamic competitor benchmarking detects which brands AI engines recommend in your category and tracks your position against them over time, which turns “our score went up” into “we closed four points of gap on the two rivals your board already knows by name.”

    Then there’s the question every report should be able to answer: why did the number move? Citation-level analysis shows the exact domains and URLs AI platforms pulled from, so a drop traces back to a specific source that stopped citing you rather than a shrug. Platform coverage spans ChatGPT, Gemini, Perplexity, DeepSeek, Doubao, Qwen, and others, which matters if your market isn’t only North America.

    Plans start at $99 per month for 100 prompts and 9,000 AI answer analyses, with the $199 tier moving to 250 prompts and 22,500 analyses. Full details are on the pricing page. Against a search budget where a quarter is already flowing to AI visibility, the tracking line item is rarely the number a CFO objects to. The missing report is.

    If you want to establish a rough baseline before committing budget, a set of free GEO tools will get you a first read, and you can start tracking properly once you know which prompts matter.

    Make the Report End With a Decision, Not a Chart

    The most common failure mode isn’t a bad number. It’s a report that gets circulated, skimmed, filed, and changes nothing about what the content team publishes next month.

    Close every report with three lines:

    • What we’re doing this quarter, tied to a specific gap in the data
    • What we’re stopping, because it hasn’t moved a tracked metric in 90 days
    • What success looks like next quarter, stated as a number before the quarter starts

    Monthly cadence for the working team, quarterly for leadership. The monthly version can be one page of the five rows plus a changelog. The quarterly version adds the revenue translation and the decisions.

    Bottom line: your CMO doesn’t need to understand how a GEO rank tracker works. She needs to walk out of the room able to defend a budget line with three sentences.

    Conclusion

    The report that dies on slide three isn’t failing because the data is weak. It’s failing because it was written for the person who built the prompt set instead of the person who has to defend the spend.

    Fix it in this order. Cut the first page to five rows. Put a competitor name next to your score. State your sample size and your attribution floor before anyone asks. End with a decision instead of a chart.

    Do that once and the quarterly review stops being a defense of the channel. It becomes the meeting where the channel gets funded.

    FAQ

    Q: What should a GEO rank tracker report include for executives? 

    A: Five things on the first page: a weighted visibility score with a 90-day trend, share of voice against your top three named competitors, a platform-by-platform split, sentiment mix, and attributable business outcomes. Everything else belongs in an appendix.

    Q: How often should we report AI search visibility to leadership? 

    A: Monthly for the working team, quarterly for leadership. AI answers shift week to week, so weekly executive reporting tends to surface noise rather than signal. The monthly version keeps the working team responsive without pulling leadership into volatility.

    Q: How do we connect AI visibility to revenue? 

    A: Report AI referral sessions and AI-attributed conversions alongside branded search lift, and state clearly that the referral number is a floor because most AI-driven visits arrive without a referrer. Published studies put AI referral conversion rates several times higher than organic, so the argument is about traffic quality rather than traffic volume.

    Q: Is AI share of voice a vanity metric? 

    A: Not when it’s competitive and category-scoped. A raw mention count is a vanity metric because it has no reference point. Share of voice against three named competitors in a defined category is a market-position metric, and it’s typically the most defensible number on the page.

    Read More

  • GEO Rank Tracker: Reverse-Engineer Why Competitors Get Cited

    GEO Rank Tracker: Reverse-Engineer Why Competitors Get Cited

    Your competitor shows up in ChatGPT’s answer for your highest-intent category prompt. You don’t. So you open their page next to yours and look for the difference. Their content is thinner. Their domain authority is lower. Their page loads slower.

    Nothing on that page explains the gap, because the answer wasn’t assembled from that page. It was assembled from a set of third-party sources that mention them and skip you, and that never surfaces in a two-tab comparison. It only surfaces in citation-level data, which is exactly what a GEO rank tracker exists to capture.

    Your Competitor Isn’t Winning on Content. They’re Winning on Sources.

    The default assumption is that AI engines reward better pages. The citation data says otherwise.

    Muck Rack’s 2026 analysis of 25 million cited links across ChatGPT, Claude, and Gemini found that 84% of AI citations trace back to earned media rather than owned content, paid placements, or SEO pages. CiteMetrix, tracking 680 million citations, put the performance gap between earned and owned placements at 325%. AirOps research landed in the same place from a different angle: brands are 6.5x more likely to be discovered through third-party sources than through their own domains.

    The source pool is also narrower than most teams expect. A synthesis of six citation studies covering more than 680 million citations found that the top 15 domains absorb roughly 68% of everything ChatGPT, Claude, Gemini, Perplexity, and Google AI Overviews produce, with Reddit alone cited at around 40% frequency across engines.

    So when a competitor gets recommended and you don’t, the useful question isn’t “what’s better about their page.” It’s “which sources did the model read, and why does your brand not appear inside them.”

    That’s a different investigation, and it needs different data.

    What a GEO Rank Tracker Records the Moment a Competitor Gets Cited

    Most tools marketed as AI rank trackers record a position and stop. Position tells you the outcome. It doesn’t tell you the mechanism.

    A tracker built for attribution captures five layers on every run: the prompt that triggered the answer, which brands were mentioned, the order they appeared in, the specific URLs cited, and the domains those URLs belong to. The last two layers are where reverse-engineering actually happens. Everything above them is a scoreboard.

    The gap between layers is measurable. ChatGPT cites an average of 15 sources per response while Gemini cites 3, and on Gemini the overlap between brands mentioned in the text and domains cited underneath can fall to 30%. ChatGPT is also selective about what makes the cut, citing only about 15% of the pages it retrieves for a given query.

    Read those two numbers together and the implication is uncomfortable. A competitor can be named in an answer built almost entirely from sources they don’t own, and your absence can be decided at a retrieval step you never see.

    The Four Citation Gaps Behind Every “Why Them and Not Us”

    Once you have prompt-level citation logs for both brands, the gaps sort into four types. Each one produces a distinct signature in the data, and each one needs a different response.

    Gap typeWhat the tracker showsWhat it actually meansFirst action
    Owned-content gapCompetitor’s own pages cited, yours absentThey have a comparison, pricing, or use-case page that answers the prompt directlyBuild the specific page the prompt asks for, not a broader guide
    Third-party citation gapCited domains are review sites, forums, or editorial, none mentioning youThe sources the model trusts have no record of your brandTarget placement in the exact domains already cited for that prompt cluster
    Narrative gapYour brand appears, but framed as niche, cheap, or secondaryThe model has signal about you, and the signal is off-positionCorrect the description at its source, then re-measure sentiment and position
    Technical gapYour pages are indexed but never retrievedStructure, access, or clarity is blocking the retrieval stepAudit crawler access and answer formatting for the failing prompts only

    A caution on the technical bucket, because it collects a lot of wasted effort. Zyppy’s citation factor analysis scored LLMs.txt at 2.0 out of 10 for influence on AI citations, with no credible evidence it moves the number. Fixing files nobody reads is a comfortable way to avoid the harder source-placement work.

    Mentioned but Never Cited Is a Different Problem Than Never Mentioned

    This distinction decides your entire remediation plan, and most dashboards blur it.

    Being mentioned means the model names your brand. Being cited means the model treats your domain as the source behind the claim. A brand can be recommended by name while the model cites a review site or a competitor’s pageinstead. That gap is diagnostic: absent from the answer entirely points to an awareness problem, while present but never sourced points to a trust problem.

    Academic work supports the split. A 2026 study analyzing 602 controlled prompts across ChatGPT, Google AI Overviews, and Perplexity treated citation and absorption as two discrete stages, not one metric.

    Benchmarks give you a rough read on severity. Category leaders rarely clear 60% AI share of voice because engines diversify sources by design, so treat anything under 15% as a structural citation gap rather than a bad month.

    Five Steps to Reverse-Engineer a Competitor’s Citation Advantage

    Here’s the workflow that turns citation logs into a queue of fixes.

    1. Define the prompt cluster, not the keyword. Pick 30 to 50 prompts a real buyer would type at the comparison stage. Commercial phrasing matters for retrieval: prompts carrying words like reviews, comparison, or a year trigger live web search in ChatGPT 53.5% of the time versus 18.7% for informational queries.

    2. Lock a competitor set of three to five. Include the brands buyers compare you against, plus any name that keeps appearing in answers even though it never showed up in your SEO reports. Those are the ones winning on sources.

    3. Log every cited URL, then classify it. Own domain, review platform, community thread, editorial, directory. The distribution is the finding. If 70% of a competitor’s citations come from community and editorial sources, no amount of on-site optimization closes that.

    4. Map your absence inside their winning sources. Not “do we have a page on this,” but “does the cited page mention us at all.” This is the step teams skip, and it’s the one that produces an actionable target list.

    5. Rank fixes by leverage, not effort. Off-site signals carry the most weight. Ahrefs’ data put branded web mentions at a 0.664 correlation with AI Overview visibility, with YouTube mentions at 0.737, the strongest single factor measured. SE Ranking’s 129,000-domain study found citation rates nearly doubling once a site crossed roughly 32,000 referring domains.

    Bottom line: earn mentions on the pages the engine already cites, before you write anything new.

    Where the Data Lies to You: Volatility, Platform Split, and Sample Size

    One run proves nothing. AI answers regenerate a different brand set on repeat queries, so a single screenshot of a competitor beating you is noise until it repeats.

    Platform differences are larger than most teams budget for. A 2026 study of 34,234 AI responses found a 46-times spread in brand citation rates, with ChatGPT citing brands 0.59% of the time and Perplexity at 13.05%. Semrush’s 126-million-prompt analysis found only 36 brands held top-100 visibility across all four major AI platforms.

    A finding on one engine is not a finding on the others. Wikipedia strategy is a clean example: it carries meaningful citation weight inside ChatGPT and close to none inside Claude or Perplexity.

    The practical guardrail is boring. Same prompt set, same competitor set, weekly cadence, raw answers preserved so a change can be audited later. Trend lines survive volatility. Screenshots don’t.

    Turning Citation Intelligence Into an Action Plan

    Most platforms stop at reporting the gap. The work that matters starts one layer down, at the domain and URL level, and it needs to run continuously because citation patterns shift in weeks.

    Topify is built around that layer. Its Reverse-Engineer AI Citations function analyzes the exact domains and URLs AI platforms cite for your prompt set, then shows whether you or your competitors dominate those references at scale. Paired with Dynamic Competitor Benchmarking, you can see which rival is gaining position on a specific prompt cluster and trace the movement back to the sources driving it.

    The seven-metric view matters here more than the feature count. Visibility, sentiment, position, volume, mentions, intent, and CVR sit in one place, which is what lets you separate the mention problem from the citation problem without exporting three dashboards into a spreadsheet.

    Coverage spans ChatGPT, Gemini, Perplexity, DeepSeek, Doubao, Qwen, and other major engines, which matters given how little findings transfer between platforms. High-Value Prompt Discovery keeps surfacing new prompts as recommendation patterns shift, so the tracked set doesn’t go stale while you’re working the current backlog.

    Plans start at $99 per month for 100 prompts and 9,000 AI answer analyses, with a 30-day trial. You can get started on a single prompt cluster before expanding the tracked set.

    Conclusion

    The side-by-side page comparison fails because it’s the wrong unit of analysis. Your competitor’s advantage is usually sitting in a Reddit thread, a review roundup, or an editorial piece that a model trusts and that doesn’t mention you.

    Start narrow. Take the ten prompts closest to purchase in your category, log every cited URL for you and three competitors over four weeks, and classify the sources. The pattern will point at one of the four gaps, and the fix follows from the classification rather than from guesswork.

    Track it. Classify it. Then go earn the mention.

    FAQ

    Why does AI cite my competitor instead of me when my content is better? 

    Because page quality is not the primary input. With 84% of AI citations tracing to earned media, the deciding factor is usually whether the third-party sources an engine trusts mention your brand at all. A competitor with weaker content and stronger source presence will win that prompt.

    What’s the difference between mention share and citation share? 

    Mention share counts how often your brand name appears in AI answers. Citation share counts how often your domain is credited as the source. Being mentioned without being cited signals a trust gap in your content, while being absent from both signals an awareness gap. The two require different fixes.

    How many competitors should a GEO rank tracker cover? 

    Three to five direct competitors is the practical starting point for core category prompts. Add any brand that appears frequently in AI answers even if it never ranked against you in traditional search, since those are often the brands winning on third-party citations.

    How often should I run competitor citation gap analysis? 

    Weekly for measurement, monthly for action. Answers vary between runs, so single-run comparisons are unreliable. Consistent cadence on a fixed prompt set is what makes a genuine competitive shift distinguishable from normal output variance.

    Read More