Category: Knowledge

  • Is Your Brand Invisible in AI Search? Find Out Now

    Is Your Brand Invisible in AI Search? Find Out Now

    Your brand ranks on page one of Google. Your SEO reports look clean. Traffic is stable.

    And yet, somewhere right now, a potential customer is asking ChatGPT which tools to use in your category. ChatGPT answers. Your brand isn’t in it.

    You don’t know that happened. You have no alert, no report, no data point that tells you. That’s the AI citation blind spot, and in 2026, it’s quietly doing more damage to brand equity than most marketing teams realize.

    Most Brands That Rank on Google Are Invisible to AI. Here’s Why That’s a Problem Now

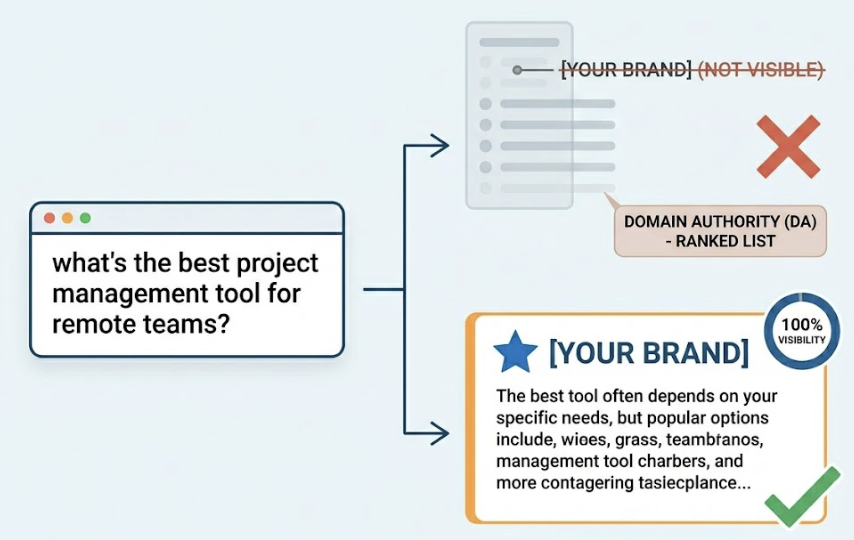
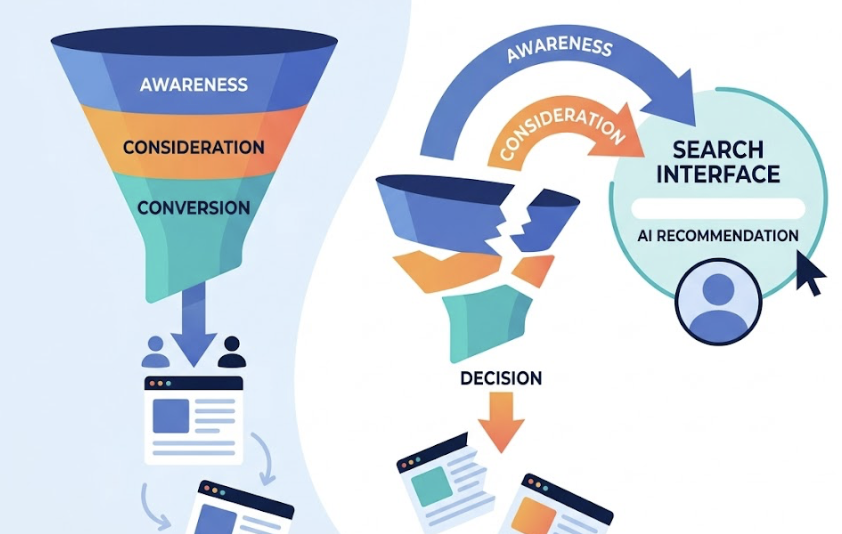
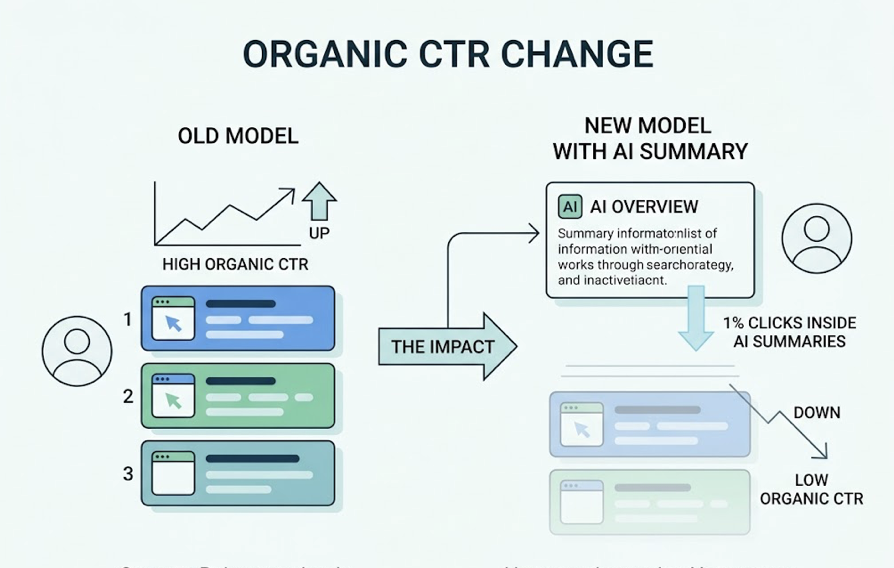
    Google rankings and AI visibility run on completely different logic.

    When you rank on Google, you control a URL in a list. When AI recommends a brand, it synthesizes an answer from sources it deems authoritative and cites who it trusts. Those two lists often don’t overlap.

    The scale of this shift matters. AI assistants now handle nearly 50% of discovery-oriented queries, approaching parity with traditional search. At the same time, research shows that 73% of B2B buyers regularly use AI tools for vendor research and purchase comparisons. These buyers aren’t googling a list of options. They’re asking a question and accepting an answer.

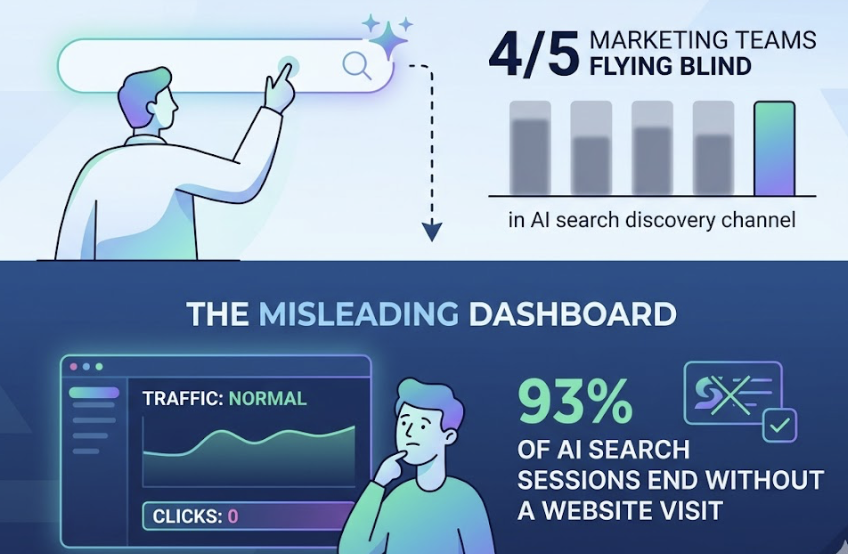
    The core problem: only 22% of marketing teams have any infrastructure to track whether they appear in those answers.

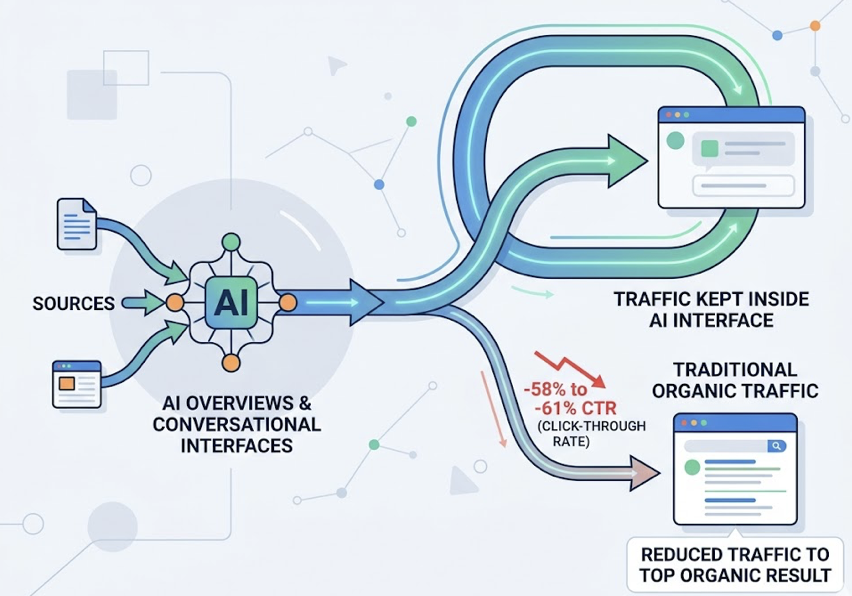
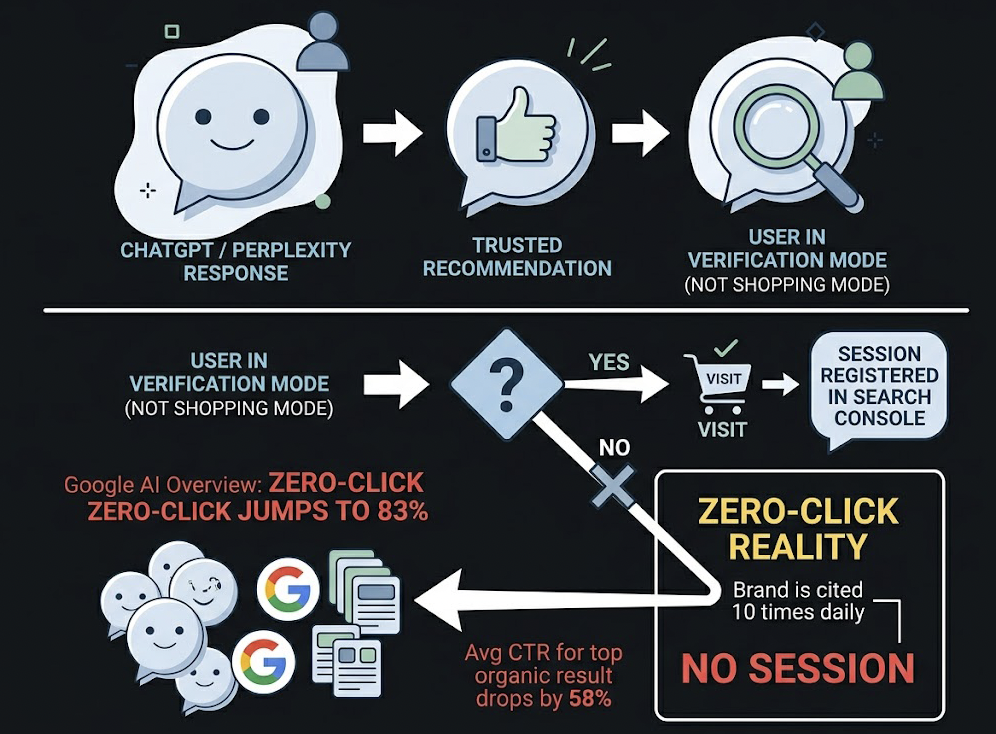
    That means roughly 4 out of 5 marketing teams are flying blind in a channel that’s influencing nearly half of discovery. And unlike traditional search, there’s no click to track. 93% of AI search sessions end without a website visit. Your brand can be excluded from the consideration set entirely, and your dashboard shows nothing unusual.

    You’re Not Ranked. You’re Not Cited. But You Don’t Know Which One.

    Here’s a distinction that most tools don’t help you make.
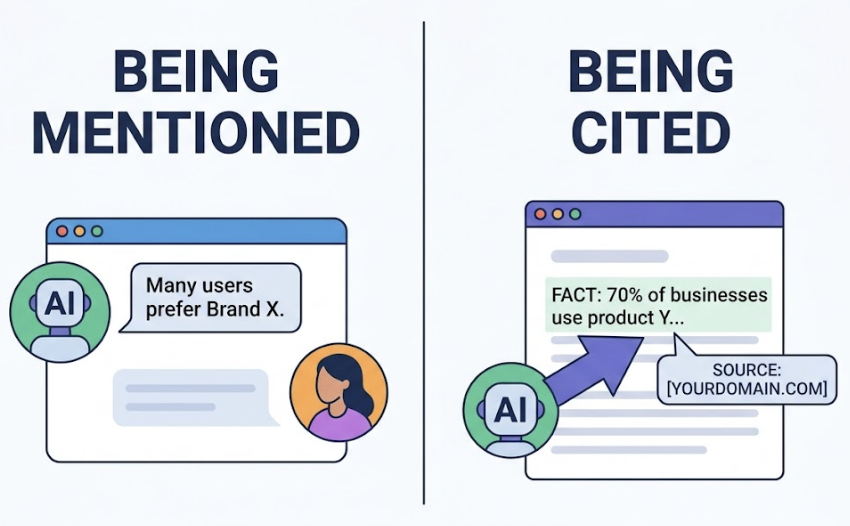
    brand mention is when the AI includes your name in its response text. A citation is when the AI links to or references a URL as a source. A recommendation is when the AI explicitly positions you as the answer to a question.

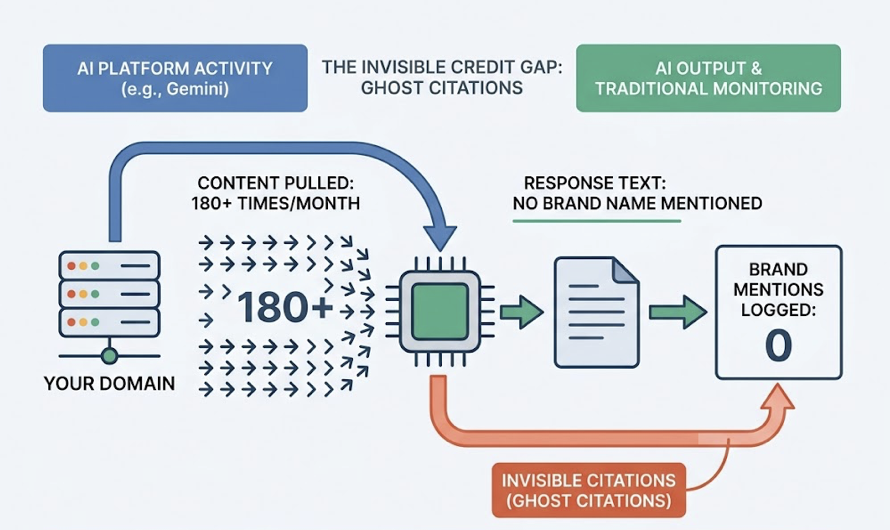
    You can be mentioned without being cited. You can be cited without being recommended. And here’s the part that makes standard brand monitoring tools useless: up to 73% of a brand’s AI presence can consist of “Ghost Citations.”

    A Ghost Citation is when an AI platform links to your domain as a source but never mentions your brand name in the response text. Take a concrete example: Gemini might reference a specific domain over 180 times in a single month but mention the brand name zero times. A keyword alert for your brand name catches none of this.

    That’s why an AI citation tracker works differently from traditional monitoring. It watches for URL references, domain-level attribution, and source patterns, not just text strings. Without it, you lose credit for the authority you’re actually providing to these models.

    Run Your First AI Citation Audit in 3 Steps

    Before investing in any tool, you can run a manual baseline. It won’t scale, but it tells you where you stand.

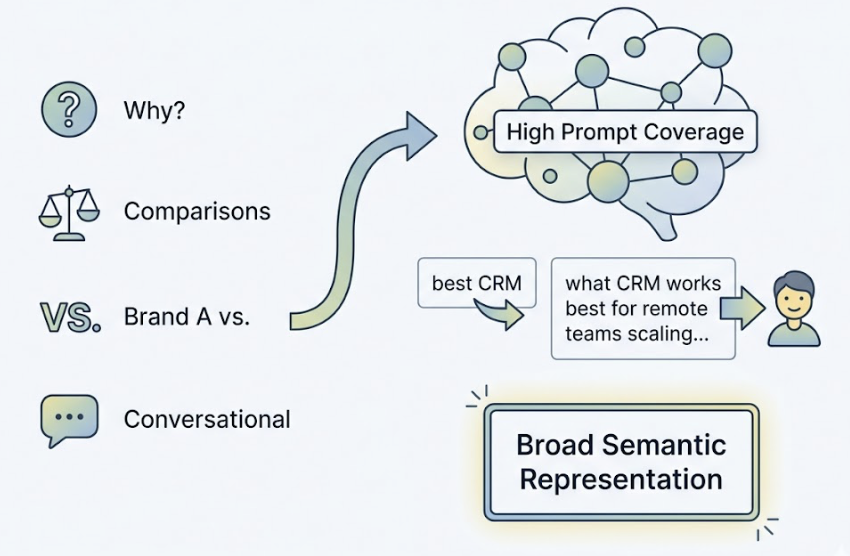
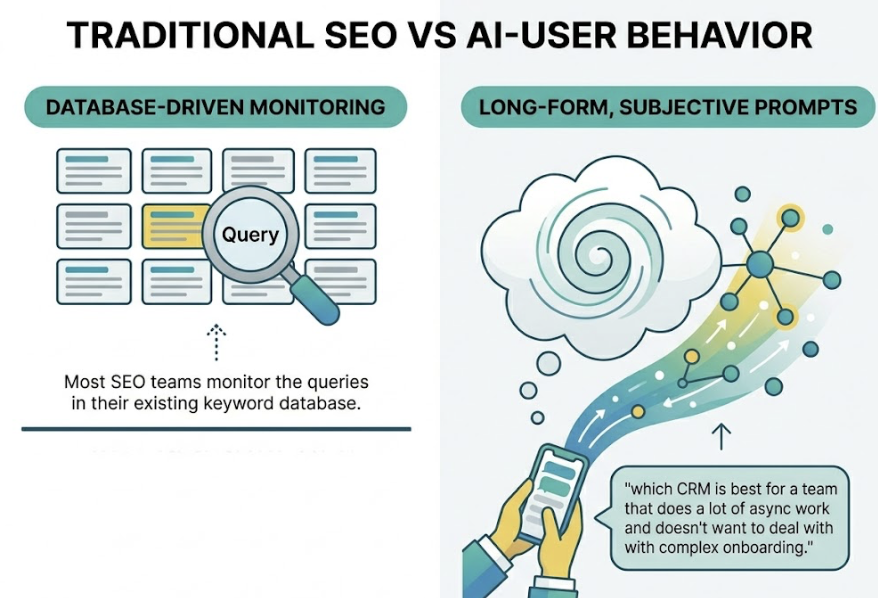
    Step 1: Build a prompt list, not a keyword list.

    AI responses are triggered by conversational queries, not head terms. Research shows that “Why” queries trigger AI answers at a 59.8% rate, and long-tail queries of 7+ words trigger AI responses 46.4% of the time. Start with 10-15 prompts that your target customers would actually say, covering purchase intent, comparisons, and informational questions in your category.

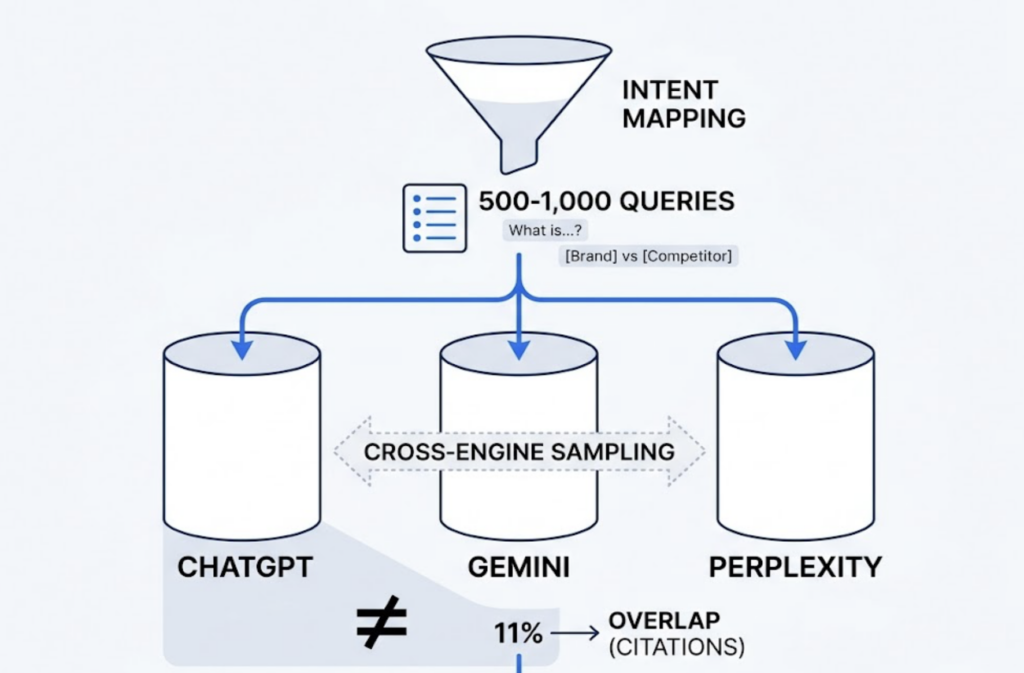
    Step 2: Test across platforms and document what gets cited.

    Run each prompt through ChatGPT, Perplexity, and Gemini. Note: does your brand appear? Does it appear as a recommendation, a mention, or a source link? Which competitor names come up instead?

    Step 3: Check the citation sources, not just the brand names.

    Look at what links or domains each platform is referencing. This is the data most manual audits miss. Which sources is the AI pulling from? Your blog? A Reddit thread? A G2 review? That sourcing pattern tells you exactly where to focus content investment next.

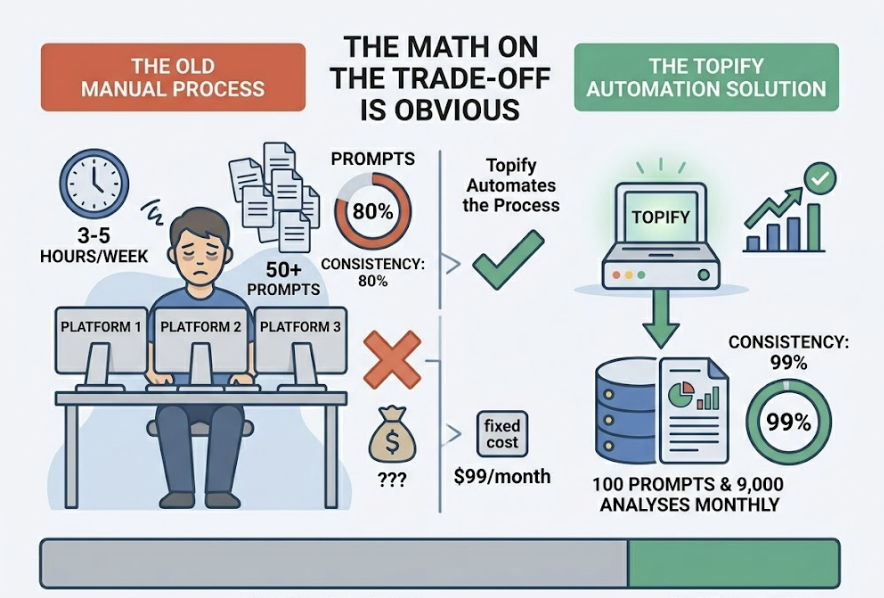
    The limitation of this approach is obvious. Doing it manually across 50+ prompts, 3+ platforms, and weekly cadence takes 3-5 hours per week with ~80% consistency. Topify automates the same process at 99% consistency for $99/month, covering 100 prompts and 9,000 AI answer analyses monthly. For most teams, the math on that trade-off takes about 30 seconds.

    5 Signs Your Brand Has a Serious AI Citation Problem

    You might not need a full audit to know something is off. These patterns tend to show up first.

    1. Your competitors appear in AI answers for your core category queries, and you don’t. Run a single test: ask ChatGPT “What are the best tools for [your category]?” If a direct competitor shows up and you don’t, that’s a displacement event.

    2. Your organic traffic looks stable, but your pipeline is softening. Because 93% of AI sessions don’t result in a website click, the exclusion from AI answers often doesn’t register in GA4. The brand is being filtered out before the website visit ever happens.

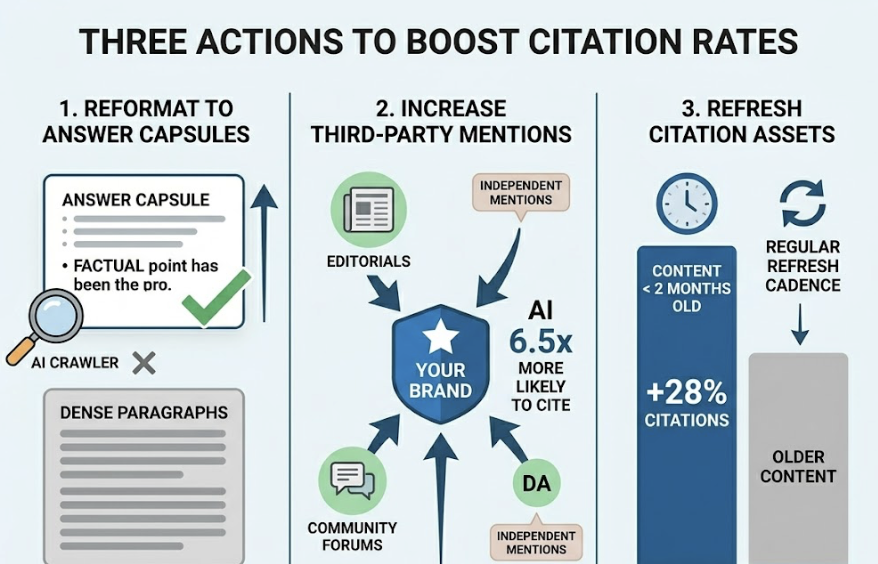
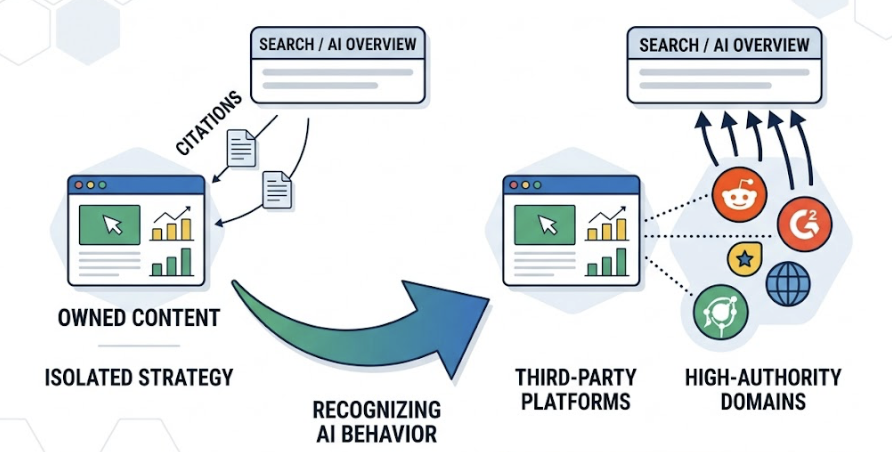
    3. AI is citing your category, but crediting third-party sources rather than your own. This is critical: AI models are 6.5 times more likely to cite a brand through an external authoritative source, such as Reddit, G2, or a trade publication, than through the brand’s own website. If your only content investment is your blog, you’re structurally at a disadvantage.

    4. You can’t answer “what does ChatGPT say about our brand?” If the question produces silence in your team, that’s the signal. It means no one has the data.

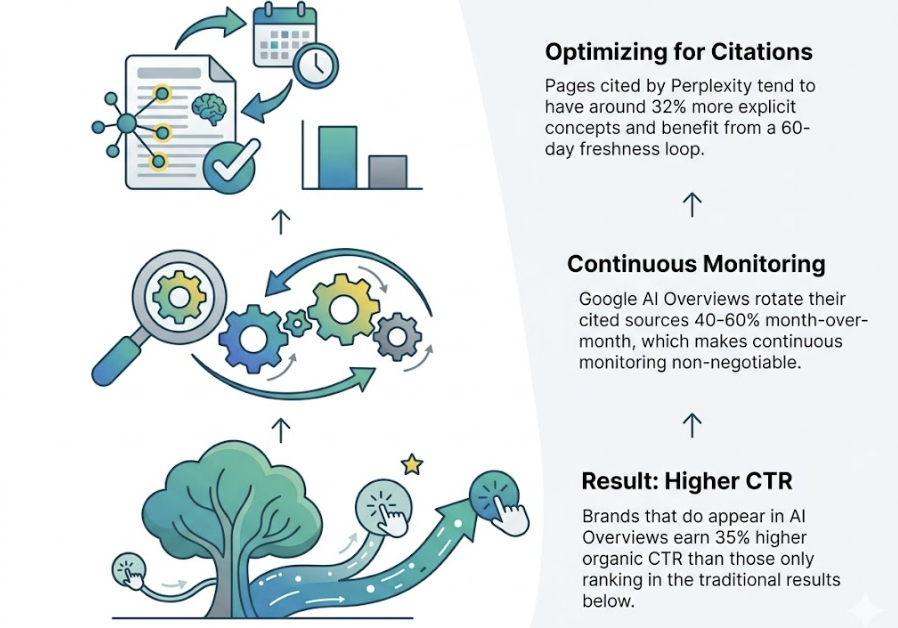
    5. Content freshness has stalled. Content updated within the last two months earns 28% more citations than older material. If your key pages haven’t been touched in 6+ months, your citation rate is likely decaying in real time.

    One of these signals is worth investigating. Three or more means the problem is already in motion.

    What a Real AI Citation Tracker Measures (It’s Not Just Mentions)

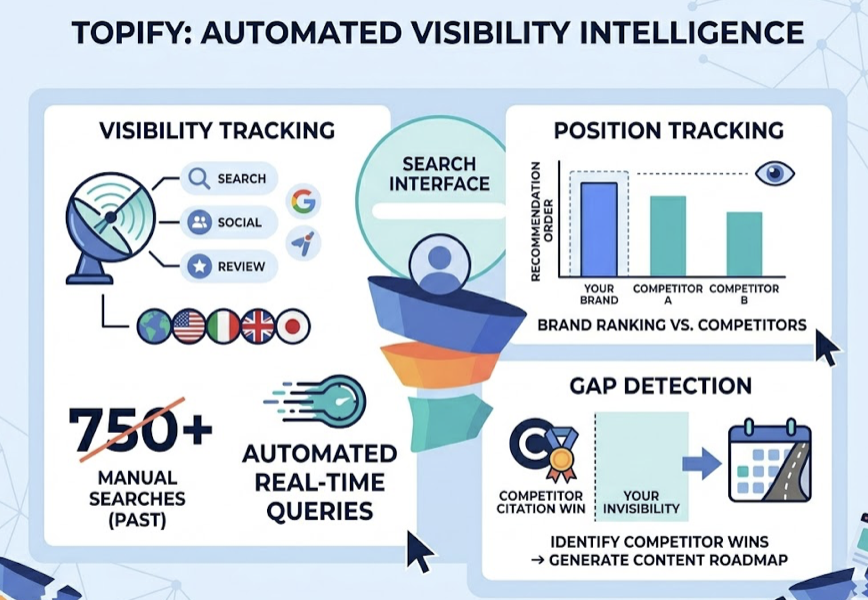
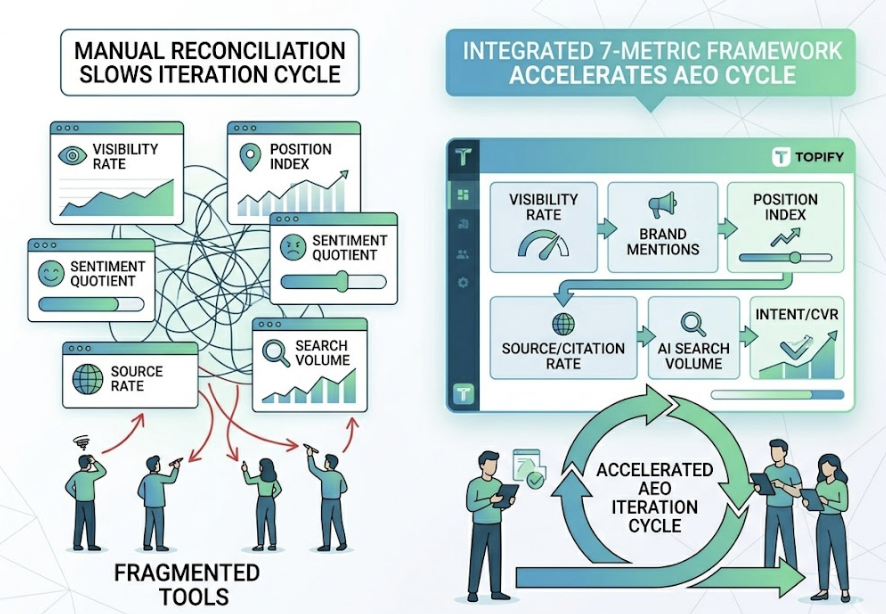
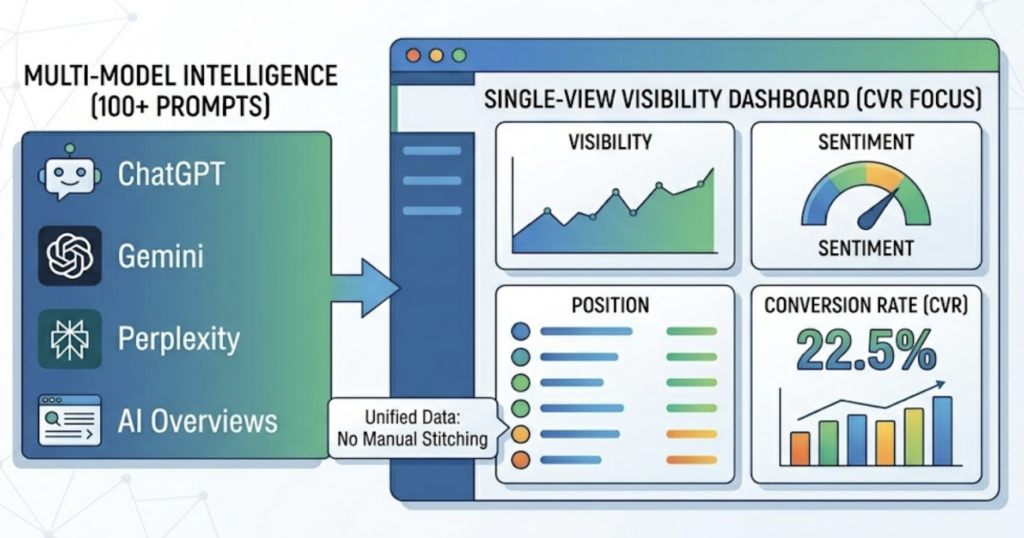
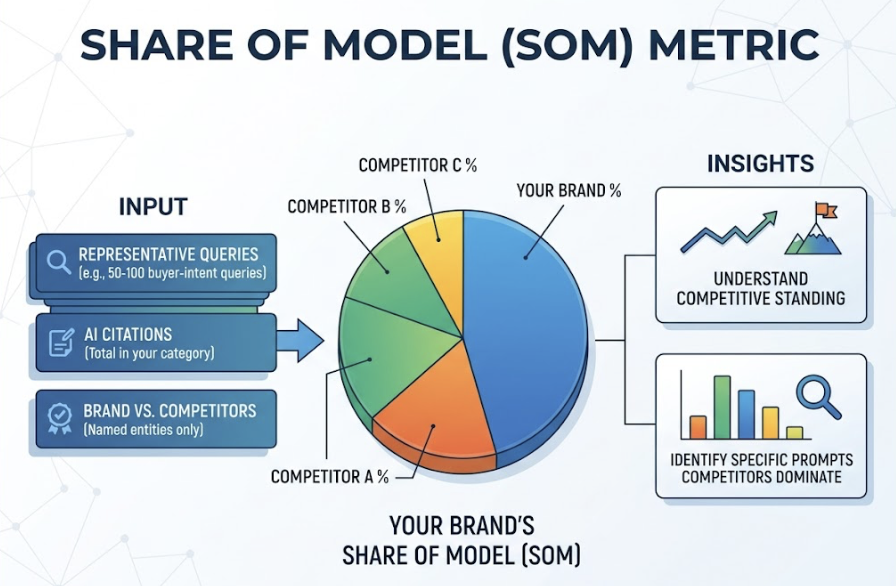
    A purpose-built AI citation tracker operates across four dimensions of brand presence, and all four matter.

    Citation frequency (sometimes called Share of Model) tracks what percentage of relevant queries include your brand. For B2B SaaS categories in 2026, category leadership is typically defined by a 40-50% citation rate across a defined prompt library. Below that threshold, a competitor is likely filling the gap.

    Source attribution identifies exactly which URLs and domains the AI uses to retrieve information about your brand. This is the most actionable data layer. If the AI is pulling from your competitor’s case studies instead of your own, you know what content to build.

    Competitive displacement tracking monitors the prompts where a competitor appears and you don’t. These “displacement prompts” are the highest-priority targets for GEO strategy because the query is already relevant to your category; you’re just not the answer.

    Sentiment and contextual framing tracks how your brand is characterized when it does appear. There’s a meaningful difference between being cited as “the leading platform” and being mentioned as “a lower-cost option.” Both are presence. Only one helps your positioning.

    Topify covers all four dimensions across ChatGPT, Gemini, Perplexity, DeepSeek, and other major platforms. Its Source Analysis feature surfaces the specific domains AI platforms are citing for your brand and your competitors, giving content and PR teams a direct brief on where external authority needs to be built. The Basic plan starts at $99/month and includes a 30-day trial.

    And because 40-60% of AI-cited sources rotate within a single month due to model updates and content freshness changes, this isn’t a quarterly audit. Weekly tracking is the practical minimum to catch competitive shifts as they happen.

    Conclusion

    The pattern is consistent: brands don’t know they have an AI visibility problem until they look for it.

    Traditional analytics can’t surface it. GA4 classifies AI-driven visits as “Direct.” Referrer headers get stripped by mobile apps. Zero-click sessions leave no trace. The tools that built the last decade of search measurement weren’t designed for this environment.

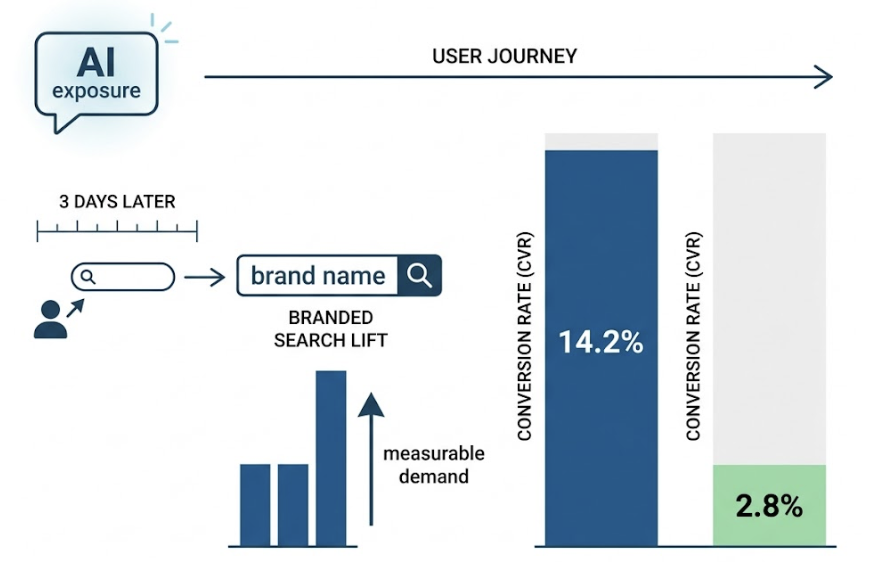
    An AI citation tracker doesn’t replace your existing analytics stack. It fills the layer above it, the layer where modern buyers are actually making decisions. And given that AI-referred traffic converts at 5.1x the rate of traditional organic search, even a modest increase in citation frequency has real pipeline impact.

    The first step isn’t optimization. It’s measurement.

    You can’t improve what you can’t see, and right now, most brands can’t see the most important channel in their discovery funnel.


    FAQ

    What is an AI citation tracker? 

    It’s a tool that monitors how often your brand, domain, or content appears as a source in AI-generated responses from platforms like ChatGPT, Perplexity, and Gemini. It tracks URL references and domain-level attribution, not just brand name mentions.

    What’s the difference between AI mentions and AI citations? 

    A mention is when your brand name appears in the AI’s response text. A citation is when the AI links to or references your domain as a source, which can happen without your brand name ever appearing. Research suggests the majority of brand AI presence falls into the citation-only category, which standard monitoring tools miss entirely.

    Which AI platforms should I track for brand citations? 

    At minimum: ChatGPT, Perplexity, and Gemini. These three cover the broadest reach for B2B and B2C discovery. Tools like Topify extend coverage to DeepSeek, Doubao, and other regional platforms depending on your target markets.

    How often does AI citation data change? 

    Frequently. Research shows 40-60% of cited sources can rotate within a single month due to model updates and changes in content freshness. Weekly tracking is the recommended minimum cadence.

    Can I track competitor citations with the same tool? 

    Yes. Competitive displacement tracking, seeing which prompts your competitors appear in but you don’t, is one of the highest-value outputs from a citation tracker. Topify’s Competitor Monitoring feature benchmarks your visibility against rivals across the same prompt sets.

    Is AI citation tracking only relevant for large brands? 

    No. Smaller brands can use strong AI citation positioning to appear alongside much larger incumbents in AI recommendations, provided their content is structured for AI retrieval and they have third-party mentions on authoritative sources.


    Read More

  • Is ChatGPT Citing Your Brand? Most Marketers Don’t Know

    Is ChatGPT Citing Your Brand? Most Marketers Don’t Know

    Your quarterly report looks clean. Organic traffic is stable, keyword rankings are holding, and the team has nothing to flag. Meanwhile, a potential customer asked ChatGPT to recommend a tool in your category—and your brand wasn’t mentioned once. No alert fired. Nothing in the dashboard moved. You had no way to know.

    That’s the AI citation blind spot. And for most marketing teams, it’s been open for longer than they realize.

    Most Brands Have No Idea AI Is Ignoring Them

    The scale of the problem is hard to overstate. Only 22% of marketing teams currently have the infrastructure to track their brand’s visibility inside AI models—yet 73% of B2B buyers now routinely use AI tools to research vendors and compare options before making contact.

    That math doesn’t work in your favor.

    What makes it worse: 93% of AI search sessions end without a website visit. The buyer researches, gets an answer, and moves on. If your brand wasn’t cited in that answer, you weren’t part of the decision. Your analytics will never show a dip. Your rankings stay exactly where they were. Nothing changes—except you lost the deal.

    What “AI Citation” Actually Means in 2026

    Most marketers treat “appearing in AI” as a single thing. It isn’t. There are three distinct forms of presence, and they require different tracking logic.

    brand mention is when the AI includes your brand name in the text of a response. It signals that the model has learned your brand exists, but it doesn’t mean you’re being recommended.

    An AI citation is when the model links to or references a specific URL or domain as a source. This is about authority. The AI is treating your content—or content about you—as a credible information source.

    An AI recommendation is the highest-value outcome: the model explicitly names your brand as a solution to a problem. This is what drives pipeline.

    Here’s the thing most teams miss: you can have plenty of citations without a single recommendation. And you can be recommended without ever being cited. Each of these has its own tracking requirement.

    There’s also a fourth scenario that almost no one is monitoring: ghost citations. Research from early 2026 found that up to 73% of a brand’s AI presence can consist of invisible citations—cases where a platform like Gemini pulls from your domain over 180 times in a month but never mentions your brand name in the response text. Traditional brand monitoring tools, which scan for brand name mentions, will log zero activity. The citations are real. The credit is invisible.

    Why Your Analytics Dashboard Can’t See Any of This

    GA4 wasn’t built for a zero-click, non-linear, conversational discovery environment. It runs on referrer headers. When AI discovery happens, those headers often don’t survive the journey.

    When a user taps a link inside the ChatGPT or Perplexity mobile app, the in-app browser strips the referrer data. The visit lands in GA4 as “Direct” traffic. When a user reads an AI answer, copies the URL, and pastes it into a new tab, there’s no referral signal at all. When a click comes from Google’s AI Overviews, it gets grouped into “Google Organic”—making it impossible to tell whether your traditional SEO or your AI visibility is driving the result.

    The AI traffic you can see in GA4 is a floor, not a ceiling. The actual volume of AI-influenced discovery is higher, and there’s no native tool to close the gap. This is why a new category of AI citation tracker platforms has emerged: they measure presence at the source—inside the LLM response—rather than at the destination.

    What a Real AI Citation Tracker Actually Monitors

    An effective ai citation tracker isn’t doing keyword scans. It’s simulating the conversational queries your buyers are actually running, then extracting structured data from the responses. Four dimensions matter.

    Citation frequency. What percentage of relevant queries include your brand? For B2B SaaS, category leadership in 2026 is typically defined by a 40-50% citation rate across a defined prompt library. If you don’t know your number, you’re making content decisions without a baseline.

    Source attribution. Which domains and URLs is the AI pulling from when it talks about your brand? This is where things get counterintuitive. AI models are 6.5 times more likely to cite a brand through an external authoritative source—like Reddit, G2, or a trade publication—than through the brand’s own website. If you’re only publishing on your blog, you’re contributing less to your AI visibility than you think.

    Competitive displacement. Visibility is always relative. The critical metric isn’t just “did I appear?”—it’s “when I didn’t appear, who did?” Tracking displacement prompts tells you exactly where your competitors are taking citations you’re not.

    Sentiment polarity. How is the AI characterizing your brand when it does mention you? There’s a meaningful difference between being cited as “a leading enterprise platform” and being cited as “a budget-friendly legacy option.” Both count as mentions. Only one helps your positioning.

    Topify tracks all four of these dimensions across ChatGPT, Gemini, Perplexity, and other major AI platforms. Its Source Analysis feature identifies the specific domains the AI is using to retrieve information about your brand—not just whether you’re appearing, but why. For teams moving from manual spot-checks to systematic tracking, the platform’s Basic plan covers 100 prompts and 9,000 AI answer analyses monthly for $99/mo.

    How to Set Up AI Citation Tracking in 3 Steps

    Step 1: Build a prompt matrix.

    Don’t start with generic keywords. AI Overviews and assistants are triggered most reliably by conversational queries. Question-based prompts (“How do I choose…?”) carry a 57.9% AI trigger rate. “Why” queries hit 59.8%. Long-tail queries with 7+ words land at 46.4%. Your prompt matrix should mirror how your buyers actually talk—covering purchase intent, comparison, and informational scenarios.

    Step 2: Run a baseline.

    Before you automate anything, manually test 10-20 core prompts across ChatGPT, Perplexity, and Gemini. Record not just whether your brand appears, but how it’s described. This “sentiment audit” often surfaces narrative drifts—cases where the AI is characterizing your product in ways that no longer match your current positioning. It’s better to find this in a baseline than to discover it six months into a tracking program.

    Step 3: Automate the cadence.

    Manual tracking breaks down fast. AI-cited sources rotate 40-60% within a single month due to model updates and content freshness changes. A weekly monitoring cadence is the practical minimum to catch competitive displacements as they happen. Manual audits run 3-5 hours per week with roughly 80% consistency. Automated tracking through a platform like Topify runs at 99% consistency and cuts active time to about one hour per week.

    Scaling across 50-100+ prompts and multiple competitors is where spreadsheets stop working. Automation isn’t just about efficiency—it’s about catching the signal before your competitor does.

    What to Do After You See Your Citation Data

    The data is only the first half. The second half is acting on it.

    When you identify a displacement prompt—a query where a competitor is cited but you’re not—the Source Analysis data tells you exactly why. If the AI is citing a competitor’s Reddit thread, your gap is in community presence. If it’s citing a competitor’s structured how-to guide, your gap is in content architecture. The citation data doesn’t just tell you where you stand. It tells you exactly what to build next.

    Three actions tend to move citation rates the fastest. First, reformatting high-value pages into concise “answer capsules”—factual blocks at the top of the page that AI crawlers are far more likely to extract than dense paragraphs. Second, increasing third-party mentions on authoritative sites. Given that AI is 6.5x more likely to cite external sources, a mention in an independent editorial or community forum is higher leverage than another post on your own blog. Third, keeping citation assets fresh. Content updated within the last two months earns 28% more citations than older content—making a regular refresh cadence as important as original production.

    The ROI case for getting this right is documented. Brands that have focused on answer engine optimization have seen 120% revenue growth from AI-driven traffic and 693% increases in AI-channel visits. AI-referred traffic also converts at 5.1x the rate of traditional organic search—so even a modest shift in citation frequency carries outsized pipeline impact.

    Conclusion

    The AI citation blind spot isn’t going to close on its own. As B2B buyers complete 61% of their purchase journey before ever contacting a vendor, the conversations that shape their shortlists are happening entirely inside AI interfaces—without any signal reaching your dashboard.

    Closing that gap starts with knowing where you stand. Run a baseline this week. Map your prompt matrix. Then decide whether manual checks can realistically keep up with a measurement environment where cited sources rotate monthly. For most teams, the answer is clear. Get started with Topify and turn AI citation tracking from a blind spot into a growth channel.

    FAQ

    Q: What is an AI citation tracker? 

    A: It’s a specialized tool that monitors how often and in what context your brand, content, or URLs are referenced in AI-generated responses from platforms like ChatGPT, Perplexity, and Gemini. Unlike brand monitoring tools that scan for name mentions, an AI citation tracker also monitors URL-level references, which often account for the majority of a brand’s AI presence.

    Q: How is AI citation different from traditional SEO ranking? 

    A: Traditional SEO focuses on ranking a URL in a list of results to drive a click. AI citation focuses on being the synthesized answer—or being the source the AI draws from to construct that answer—in a zero-click environment. The feedback loops, measurement tools, and optimization actions are fundamentally different.

    Q: Can I track brand citations across ChatGPT and Perplexity at the same time? 

    A: Yes. Modern platforms like Topify offer multi-model monitoring, allowing you to compare citation frequency, sentiment, and source attribution across different AI ecosystems from a single dashboard.

    Q: How often does AI citation data change? 

    A: AI visibility is more volatile than traditional search rankings. Research shows 40-60% of cited sources can rotate within a single month due to model updates and content freshness signals. Weekly tracking is the recommended minimum cadence to catch displacement events before they compound.

    Read More

  • AEO KPIs That Go Beyond Impressions

    AEO KPIs That Go Beyond Impressions

    Your SEO dashboard is lying to you, and it’s not even wrong.

    The rankings are stable. Impressions look healthy. But your brand doesn’t show up in a single ChatGPT response when someone asks which tool to use in your category. That’s not a ranking problem. That’s a measurement problem.

    Answer Engine Optimization (AEO) runs on entirely different logic than traditional search. AI platforms don’t show your brand a list of links; they render a conclusion. And if you’re still reporting on impressions and CTR to justify your AEO investment, you’re measuring the wrong thing entirely.

    Here’s what to measure instead.

    Your Old Metrics Can’t See What’s Actually Happening

    Traditional SEO tracked a clean linear path: keyword → impression → click → conversion. AI search breaks that chain at the first step.

    When a user asks ChatGPT “what’s the best project management tool for remote teams,” they don’t see a list of links ranked by domain authority. They get an answer. If your brand isn’t in that answer, you don’t exist for that user, regardless of what your Google Search Console says.

    Research shows organic CTR for queries that trigger an AI Overview has dropped 61% year-over-year. That number isn’t a warning. It’s already happened.

    The “visibility paradox” is now a standard failure mode: teams report to leadership with green dashboards while their brand quietly disappears from the conversations that shape purchase decisions.

    That’s the gap most brands still can’t see.

    The 7 KPIs That Actually Measure AEO Performance

    The following metrics don’t replace SEO reporting. They answer a different question: not “where do we rank,” but “what does AI say about us, and how often.”

    1. AI Visibility Rate

    This is the percentage of your target prompts that trigger a response that mentions your brand. Think of it as your “room presence” metric. If AI doesn’t mention you, nothing else matters downstream.

    For B2B SaaS teams, a visibility rate between 10-15% across category-level prompts is a reasonable baseline. Category leaders typically clear 30-40%. Getting above 0% is a meaningful signal for newer brands.

    Platforms like Topify track visibility rate across ChatGPT, Gemini, Perplexity, and other major AI platforms simultaneously, so you’re not making decisions based on a single engine’s output.

    2. Citation Share

    Being mentioned is awareness. Being cited is trust.

    Citation Share tracks how often AI responses reference your owned domains as a factual source, not just your brand name. Brands are 6.5 times more likely to be cited through external sources, like Reddit threads, G2 reviews, or industry publications, than through their own websites.

    That number forces an uncomfortable question: if AI trusts Reddit more than your homepage, where should your next content investment go?

    Topify’s Source Analysis surfaces exactly which domains AI is citing when describing your brand, so you can close those gaps strategically rather than guessing.

    3. Sentiment Score

    AI doesn’t just list brands. It characterizes them.

    A Sentiment Score measures whether the AI describes you favorably, neutrally, or with caveats. Scores typically range from 0 to 100. A positively framed AI summary increases purchase likelihood by 32%. Negative framing, on the other hand, causes what researchers call “silent churn,” users who form an opinion before they ever hit your site.

    High mentions plus low sentiment is often worse than being invisible. You’re being seen, but the framing is doing active damage.

    4. Answer Placement Score

    In a numbered list from an AI recommendation, position one carries a weight of 1.0. Position five carries a weight of 0.2. That’s a 5x difference in downstream conversion probability, for the same query.

    Answer Placement Score measures where your brand lands within AI responses when it does appear. Being in the “room” matters. Being first in the room matters more. Category leaders show up as the primary recommendation in 30% or more of relevant responses.

    If your visibility rate is high but your placement score is low, you’re being mentioned as an alternative, not a recommendation.

    5. Prompt Coverage

    Traditional SEO tracks a finite keyword list. AI search doesn’t work that way.

    The average AI query is 23 words long, compared to 4 words in traditional search. Users ask things like “what’s the most secure CRM for a 15-person remote startup that doesn’t need Salesforce-level complexity.” No keyword tool built this query.

    Prompt Coverage measures how many distinct user intents, across discovery, evaluation, and comparison stages, produce a response that mentions your brand. Enterprise teams typically track 100+ prompts per category cluster to get statistically meaningful data. Topify continuously surfaces new high-value prompts as AI behavior evolves, so your tracked set doesn’t go stale.

    6. AI Share of Voice

    If your brand appears in 10% of category recommendations and your top competitor appears in 40%, that’s a 30-point mention gap. That gap is your market opportunity, or your market risk, depending on which side you’re on.

    AI Share of Voice calculates your brand’s mentions as a percentage of total brand mentions across a query set. It’s the AEO equivalent of market share. And in an environment where AI satisfies roughly 60% of search queries, SOV is a direct proxy for future pipeline.AI SOV=Brand MentionsCompetitor Mentions×100AI SOV=∑Competitor MentionsBrand Mentions​×100

    This is also the metric executives actually understand. Topify’s Competitor Monitoring tracks SOV in real time, including emerging competitors who weren’t on your radar six months ago.

    7. Conversion Visibility Rate (CVR)

    AI traffic is often invisible in standard analytics setups. Assistants suppress referrers, strip UTM parameters, and don’t always show up cleanly in GA4. Actual AI influence is likely 2-3x what standard dashboards report.

    CVR works around this by tracking what happens after AI exposure. Users encounter your brand in a ChatGPT response, don’t click immediately, then search for you by name three days later. That branded search lift is measurable, and it’s the clearest signal that your AEO investment is generating demand. AI-referred traffic, when you can capture it, converts at 14.2%, compared to 2.8% for traditional organic search.

    The Metrics Brands Get Wrong First

    Getting the right KPIs is half the work. Using them correctly is the other half.

    Mistake 1: tracking mention count in isolation. A high mention count is a liability if sentiment is negative. Modern AI sentiment analysis distinguishes between being praised for your interface and criticized for your pricing in the same response. Averaging those together produces a number that means nothing.

    Mistake 2: treating AI referrals like organic traffic. If you’re measuring AEO performance purely in GA4, you’re undercounting by a significant margin. Include “AI Assistants” as a response option in post-conversion surveys. Check server logs for ChatGPT-User agents. The attribution gap is real and it’s currently making AEO look less effective than it is.

    Mistake 3: only tracking branded prompts. “What does [Your Brand] do?” will always give you flattering visibility numbers. The real test is unbranded category prompts: “best analytics tool for B2B SaaS.” If you only appear when someone already knows your name, you’ve failed at the top of the funnel entirely.

    How to Build Your AEO Reporting Framework in 3 Layers

    Organizing these 7 KPIs into a reporting structure turns raw data into decisions. The framework has three layers, each answering a different organizational question.

    Layer 1: The Visibility Layer Are we being retrieved at all?

    KPIs: AI Visibility Rate, Prompt Coverage, Platform Distribution.

    Report this weekly. Platform algorithm changes move fast. A week-over-week visibility delta tells you whether your optimization work is landing, or whether a competitor just pushed you out of a cluster of prompts.

    Layer 2: The Quality Layer How is AI describing us?

    KPIs: Sentiment Score, Answer Placement Score, Citation Source Share.

    Report this monthly. Narrative drift, where AI gradually shifts from describing you as a “leading solution” to a “viable option,” rarely happens overnight. Monthly audits catch it before it becomes structural.

    Layer 3: The Impact Layer Is AI presence driving demand?

    KPIs: AI Share of Voice, Branded Search Lift, Lead Quality Shift (conversion rate and deal size of AI-referred visitors vs. organic).

    Report this quarterly, alongside competitor benchmarking. This is the layer that justifies AEO spend to finance and leadership. Users arriving from AI recommendations convert at 14.2% and move through the pipeline 2-3x faster, because they’ve been pre-qualified by the AI’s recommendation.

    What a Good AEO Report Actually Looks Like

    C-suite audiences don’t want to reconstruct meaning from raw data. They want implication-first summaries that answer one question: “What does this mean for the business?”

    A solid executive AEO report fits in four slides:

    SlideExecutive FocusKey Data Point
    Executive SummaryRecommendation-first“We appear in 12% of category prompts. Competitor A appears in 38%.”
    Competitive SOVCurrent market standingAI Share of Voice vs. top 3 competitors
    Narrative ControlBrand reputation healthSentiment Score trend + top AI qualifiers used
    Impact / ROIPipeline connectionBranded Search Volume Lift + Lead Quality comparison

    The operational team needs the full 7-KPI breakdown. Leadership needs the business translation. Build both, from the same data set.

    Setting Benchmarks When There’s No Industry Standard Yet

    AEO is new enough that there’s no universal benchmark. The right target depends heavily on how often AI surfaces responses in your category at all.

    IndustryAI Overview Trigger RateTarget Visibility Rate (Leader)
    Healthcare88%40-50%
    B2B Tech / SaaS55%30-40%
    Finance21%15-20%
    E-commerce13%10-15%
    Real Estate4.4%5-10%

    A 10% visibility rate in real estate signals market leadership. In healthcare, that same number is a serious problem.

    Start by tracking 30-50 unbranded prompts and establishing your baseline over 30, 60, and 90 days. Trend stability matters more than single-point snapshots. Your 90-day moving average is a more reliable signal than any single week’s report.

    Conclusion

    AEO is a shift from the link economy to the citation economy. The click, which once was the primary unit of digital marketing value, is being replaced by something less visible but more powerful: the authoritative mention inside an AI-generated answer.

    The 7 KPIs in this framework don’t make AEO harder to report. They make it possible to report it honestly, with data that reflects what’s actually happening in the conversations shaping your buyers’ decisions.

    AI Visibility Rate is the baseline. Sentiment Score is the health check. Answer Placement tells you how loud your voice is when you’re in the room. SOV shows you the competitive gap. CVR connects it all to revenue.

    Start measuring what AI actually says about you. Then optimize from there.

    FAQ

    Q: What’s the main difference between AEO KPIs and traditional SEO KPIs? 

    SEO measures actions, clicks, traffic, and rankings. AEO measures influence and trust: citation frequency, sentiment framing, and presence within synthesized answers. One tracks what users do after seeing you. The other tracks whether AI includes you in the conversation at all.

    Q: How often should I report on AEO metrics? 

    Weekly for visibility and prompt coverage (tracks fast platform changes), monthly for sentiment and placement audits (catches narrative drift), and quarterly for Share of Voice and pipeline impact (executive-level benchmarking).

    Q: Which AEO KPI should I prioritize first? 

    AI Visibility Rate. You need to confirm you’re present in relevant AI responses before any other metric is worth optimizing. If your visibility rate is 0% for category-level prompts, that’s the only problem that matters right now.

    Q: Can AEO performance be tied directly to revenue? 

    Yes, through Branded Search Lift and Lead Quality Shift. Users arriving from AI recommendations convert at 14.2%, compared to 2.8% for traditional organic search, and move through the sales cycle 2-3x faster because AI pre-qualifies them during the research phase.

    Q: Why is sentiment analysis important in AEO? 

    Because AI doesn’t just list your brand name. It describes you. A high visibility rate combined with a low sentiment score means you’re being mentioned in ways that actively erode purchase intent. Sentiment is the difference between being recommended and being used as a cautionary example.

    Read More

  • AEO KPIs Most Brands Still Don’t Track

    AEO KPIs Most Brands Still Don’t Track

    A practical framework for measuring brand visibility across ChatGPT, Gemini, and Perplexity

    You run the weekly report. Rankings are stable. Organic traffic is up. The dashboard looks fine.

    Then a colleague casually mentions they found your main competitor recommended three times while researching options in ChatGPT. Your brand didn’t appear once. You have no metric to explain why, no way to know how long it’s been happening, and no clear path to fixing it.

    That’s the measurement gap most marketing teams haven’t closed yet.

    Traditional SEO metrics were built for a list-based world. KPIs for AEO — answer engine optimization — require an entirely different framework. When AI delivers one synthesized answer instead of ten blue links, “position 1” is no longer the goal. What matters is whether you’re in the answer at all, what the AI says about you, and whether your competitors are being named first.


    Your Old SEO Dashboard Is Measuring the Wrong Race

    The metrics you’ve relied on for years — keyword rankings, organic clicks, impressions — weren’t designed to capture what happens inside a generative response.

    Here’s the structural problem. AI Overviews and conversational interfaces act as a proxy for the user, synthesizing multiple sources and delivering a single answer. That process reduces the click-through rate for the top organic result by an average of 58% to 61%. That traffic doesn’t go to competitors in the traditional sense. It stays inside the AI interface.

    What’s more, standard analytics platforms like GA4 typically misclassify AI-driven brand exposure as “Direct” or “(not set)” traffic because AI assistants frequently strip referral headers and UTM parameters. You’re likely receiving more AI-driven interest than your current reports show.

    The deeper shift is about authority, not traffic. In traditional SEO, visibility was a function of position. In the generative era, it’s a function of “Information Gain” — whether your content provides unique, factual, structured data that AI finds indispensable for its response. That’s a different race. And it requires different metrics to run it.


    The 6 AEO KPIs That Actually Tell You Where You Stand

    AI Visibility Rate

    This is the foundational metric of AEO, and the closest successor to keyword rankings.

    AI Visibility Rate measures the percentage of queries within your tracked prompt set where your brand is mentioned, cited, or recommended by the AI. The formula: queries with brand mention divided by total tracked queries, multiplied by 100.

    What makes this metric meaningful is its scope. A brand may have strong visibility on branded queries but zero visibility on high-intent category comparisons — the exact queries where purchase decisions happen. Professional tracking typically starts with a “Master Prompt List” of 50 to 1,000 queries that reflect how real users search for solutions in your category.

    Visibility tiers help you read your position quickly: 0–10% means you’re largely absent from AI knowledge models; 10–20% signals occasional mentions with low authority; 20–40% puts you in the competitive range alongside recognized peers; above 40% signals category dominance.

    AI Sentiment Score

    Showing up in an AI response isn’t enough. How you show up matters just as much.

    AI Sentiment Score tracks the qualitative framing AI engines use when they describe your brand. LLMs don’t just list options — they characterize them. Describing your product as “feature-rich but expensive” or “great for beginners but lacks enterprise scaling” shapes user perception before a single click occurs.

    The Net Sentiment Score (NSS) categorizes mentions into five tiers: Endorsement (AI proactively recommends your brand as the primary solution), Neutral Mention (factual, no evaluative language), Cautious Mention (includes hedging or caveats), Negative Mention (highlights weaknesses or criticism), and Hallucination (AI generates incorrect information). Scores above +60 signal a defensible brand position in AI search. Scores below -20 indicate your digital footprint is actively working against your sales pipeline.

    That last scenario — negative AI sentiment — is particularly damaging because most brands don’t catch it until the pipeline impact is already visible.

    Share of Voice vs. Competitors

    In most generative responses, AI surfaces several vendors or solutions at once. AI Share of Voice tells you who’s dominating that recommendation window.

    The formula: your brand mentions divided by total tracked brand mentions across your competitive set, multiplied by 100. It’s a leading indicator of future market share. When AI satisfies up to 93% of informational search intent without a click, the brand appearing most consistently as the “consensus pick” across ChatGPT, Gemini, and Perplexity captures the cognitive awareness that drives branded searches and offline conversions later in the funnel.

    Position in AI Answers

    Not all mentions carry equal weight. The order matters.

    Being the first brand named in a generative response carries significantly more authority than appearing fourth in a trailing list. The Citation Placement Index (CPI) assigns weighted values based on position: a primary recommendation earns 10 points; top-3 placement earns 7; a lower list placement earns 4; a trailing or passing mention earns 2.

    Brands with higher CPI scores tend to benefit from what researchers call “Reinforced Visibility.” As AI generates follow-up responses within a conversation thread, it’s more likely to stay anchored to the entity it introduced first. First mention isn’t just an impression — it compounds.

    Source Citation Rate

    This KPI tends to surprise marketing teams the most.

    Roughly 85% of citations in AI responses come from third-party sources — Reddit, Wikipedia, G2, industry publications — rather than brand-owned domains. So Source Citation Rate doesn’t just track whether AI links to your website. It tracks which domains are actually shaping the AI’s narrative about your category.

    The citation landscape differs sharply by platform. ChatGPT leans on Wikipedia (47.9%) and news sources; Perplexity favors Reddit (46.7%) and industry blogs; Google AI Overviews draw from YouTube (23.3%) and Reddit (21%). If your brand isn’t present in these high-trust third-party ecosystems, you’re leaving the narrative to others — or to your competitors.

    Conversion Visibility Rate (CVR)

    This is where AEO connects directly to revenue.

    AI-referred visitors are among the most qualified traffic sources you can get. Users arriving from ChatGPT convert at approximately 15.9%, compared to 1.76% for traditional organic search. Perplexity referrals convert at around 10.5%. The reason is structural: by the time someone clicks through from an AI answer, the AI has already handled the research and comparison phase of the buyer journey. They arrive ready to engage.

    CVR estimates the revenue value of your AI visibility by applying that conversion premium to your tracked mention volume. It’s the metric that turns an AEO report from an awareness slide into a business case leadership actually cares about.


    One Number That Ties All Six Together

    Six metrics can complicate a stakeholder presentation. The Visibility Coefficient (Cv) simplifies it.

    It’s a composite index that normalizes mention frequency, sentiment, and position into a single score from 0 to 100. The formula: average brand mention frequency multiplied by a sentiment weight, divided by total category queries.

    Think of it as a leading indicator of brand equity in the machine-learning era. A high score means AI models — trained on billions of data points — consistently treat your brand as the category default. That reduces dependence on expensive paid terms. A declining score is an early warning system: sentiment drift, content gaps, or a competitor quietly gaining ground in the AI’s retrieval index.

    It’s also what you bring to a quarterly review when you need to show AEO momentum without a 20-slide breakdown.


    Most Teams Start Tracking After the First Traffic Drop. Here’s the Baseline You Need

    Waiting for a traffic anomaly before establishing AEO baselines is one of the most common mistakes marketing teams make. Without a “before” snapshot, there’s no way to validate whether your AEO efforts are working.

    A solid baseline starts with intent mapping: build a list of 500 to 1,000 queries spanning the full customer journey, from “what is [category]” through “[your brand] vs [competitor].” Then run those queries across ChatGPT, Gemini, and Perplexity. Cross-engine sampling is essential — a brand may have strong Perplexity visibility (which searches the live web) while being largely invisible on ChatGPT (which relies more on training data and the Bing index). Only about 11% of domains are cited by both platforms, which means the two ecosystems require separate strategies.

    Record brand position and sentiment for each response. Map which third-party domains the AI is citing when discussing your category. Run the same prompts for 3–5 competitors. That’s your Narrative Baseline. Every subsequent measurement gets compared to it.

    Context matters for target-setting. AI Overview triggers vary significantly by industry: Healthcare sees a 48.7% trigger rate, making high visibility close to table stakes. SaaS and B2B sit around 30%, where a >25% visibility target is a reasonable first benchmark. Real Estate triggers at just 4.4%, so a 10% visibility rate may actually signal leadership in that segment.


    When Your Numbers Look Bad: What to Do First

    Low visibility and poor sentiment have different root causes. They need different fixes.

    If your AI Visibility Rate is low, the most common cause is content structure. AI engines using Retrieval-Augmented Generation (RAG) prioritize content that can be extracted cleanly — direct, factual, structured summaries. Content with consistent H1-H2-H3 heading hierarchies is 40% more likely to be cited by LLMs. Adding 40–60 word “atomic answers” at the top of high-traffic pages significantly improves extractability. Embedding YouTube content on key topic pages also matters: YouTube signals correlate with AI citation at 0.735, the highest correlation of any measured signal.

    If visibility is adequate but sentiment is negative, the fix is third-party reputation work. AI uses multi-source corroboration to determine what it believes about a brand. A negative Reddit thread from 2022 or an outdated industry article can drive poor sentiment consistently across platforms. Actively seeking mentions in high-authority “trust neighborhoods” — Wikipedia, industry publications, review platforms like G2 — delivers more impact on sentiment than any on-page optimization.

    Data freshness also has a measurable effect. Refreshing content timestamps and updating product information can shift AI ranking positions by up to 95 places.


    How Topify Turns These 6 KPIs Into a Live Dashboard

    Manual tracking across ChatGPT, Gemini, and Perplexity is workable for an initial audit with a small prompt set. It doesn’t scale.

    For marketing teams managing AEO visibility across dozens of prompts, multiple platforms, and a shifting competitive set, Topify centralizes all six metrics into a single operating view. In practice, this means you can open a weekly report, see that your ChatGPT Visibility Rate dropped 14 points over the past month, trace it to a third-party source that stopped citing your brand, and identify which competitor captured that share — all within the same dashboard.

    The platform covers the full KPI stack: real-time AI Visibility Tracking across ChatGPT, Gemini, Perplexity, and other major engines; Sentiment Analysis with 0–100 scoring; Position Tracking and competitor Share of Voice monitoring; Source Analysis that reverse-engineers exactly which domains AI platforms are citing in your category; and CVR estimation to connect visibility data to revenue impact.

    Topify also flags hallucinations — cases where AI generates inaccurate information about your brand — before they compound into sustained negative sentiment. And it continuously surfaces high-value prompts your brand isn’t appearing for yet, so you’re optimizing toward opportunity, not just defending what you already have.

    For teams that want to move from insight to action, Topify’s One-Click Agent Execution identifies citation gaps and deploys optimized content directly, without manual workflows.


    Conclusion

    The shift from SEO to AEO isn’t incremental. It’s structural — a move from measuring clicks to measuring authority inside the AI’s answer.

    Your existing analytics stack isn’t broken. It’s just measuring the wrong thing. The six KPIs for AEO — Visibility Rate, Sentiment Score, Share of Voice, Position, Source Citation Rate, and CVR — give you a framework to understand where your brand actually stands when a potential customer asks an AI for a recommendation. Start with a 30-day baseline. Pick two or three metrics to track weekly. And don’t wait for a traffic anomaly to discover you’ve been invisible.


    FAQ

    Q: What’s the difference between AEO KPIs and GEO KPIs?

    A: AEO (Answer Engine Optimization) and GEO (Generative Engine Optimization) are often used interchangeably, and their core KPIs overlap significantly. In practice, GEO refers to the broader strategy of optimizing for generative AI platforms, while AEO emphasizes the answer layer specifically — how your brand appears within AI-synthesized responses. The six KPIs in this framework apply equally to both.

    Q: How often should I review these metrics?

    A: For real-time retrieval platforms like Perplexity, a weekly cadence is recommended for high-growth teams. Monthly trend analysis is the standard for board-level reporting on Share of Voice progress. At minimum, run a full cross-engine audit quarterly to catch shifts in citation sources and competitor positioning.

    Q: Can I track AEO KPIs without a paid tool?

    A: A manual baseline with 50–100 prompts is feasible, and it’s worth doing early. The practical limit is consistency. AI responses aren’t static — running the same prompt on the same platform on different days can produce different answers. At scale, that variability makes manual tracking unreliable. Dedicated platforms address this through browser-level crawling and statistical sampling across large prompt sets.

    Q: How do I explain AEO KPIs to leadership?

    A: Lead with CVR and the Visibility Coefficient. CVR connects AI visibility directly to conversion value, which makes the business case immediately legible. The Visibility Coefficient gives leadership a single trend number to track over time — similar to how NPS works for customer experience reporting. Avoid leading with raw Visibility Rate alone; without competitive context, a 22% rate has no obvious meaning.


    Read More

  • Keyword Rankings Are Dead. Meet Your New AEO KPIs

    Keyword Rankings Are Dead. Meet Your New AEO KPIs

    Your domain authority is 72. You’re ranking top-three for a dozen high-intent keywords. Then your CMO pulls out her phone, types your category into ChatGPT, and asks why your brand isn’t in the response. You don’t have an answer, because nothing in your current report was built to track that.

    Traditional keyword rankings measure a world that’s changing fast. The KPIs replacing them are already in use by GEO teams that figured this out the hard way.

    Your Keyword Report Doesn’t Know What AI Sees

    The premise of a “ranking” assumes a fixed list. For two decades, SEO worked because Google returned ten links in a deterministic order, and position one meant something concrete. Generative engines don’t work that way.

    AI platforms return a recommendation, not a list. A brand is either cited in the synthesized answer or it isn’t. That binary outcome has no equivalent in traditional rank tracking.

    The data behind this shift is hard to ignore. Gartner projects that traditional search engine volume will drop 25% by 2026 as users move toward AI-powered answer tools. When Google’s AI Overviews appear in results, organic click-through rates for the first traditional result drop by as much as 61%. In Google’s full AI Mode environment, the zero-click rate climbs to an estimated 93%.

    What’s more unsettling for SEO teams: the overlap between AI Overview citations and top-10 organic rankings has dropped from 76% to roughly 38%, with some analyses putting it as low as 17%. And 80% of LLM citations now come from pages that don’t rank in Google’s top 100 for the original query.

    That’s not a gap. That’s a different game entirely.

    What “Answer Share” Means (and Why It’s Now the Core AEO KPI)

    Answer Share is the percentage of relevant AI-generated responses that mention or cite your brand across a defined set of prompts. The formula is straightforward:

    Answer Share = (# of responses mentioning brand ÷ total prompts tested) × 100

    If you test 50 prompts relevant to your category and your brand appears in 18 of the AI responses, your Answer Share is 36%.

    Where Search Share of Voice tracked link appearances on a page, Answer Share tracks how often your brand is part of the actual “truth” the AI constructs for a user. When someone asks ChatGPT “What’s the best quiet cordless vacuum for a home with pets?”, the AI synthesizes a buyer’s guide. If your brand isn’t in that guide, it doesn’t exist for that buyer at that moment.

    The quality of traffic this generates is worth noting. AI search visitors are estimated to be 4.4 times more valuable than traditional organic visitors due to their high conversion intent. Separately, AI-referred traffic converts at a 31% higher rate than non-AI sources. These aren’t huge volumes yet, but the intent density is meaningfully higher.

    Answer Share is the new North Star metric. The other four KPIs exist to explain and improve it.

    The 5 KPIs for AEO That GEO Teams Are Actually Using in 2026

    KPIWhat It MeasuresWhy It Matters
    Answer Share% of relevant AI responses mentioning your brandPrimary visibility indicator
    Citation RateHow often the AI links to your domain vs. just naming youDistinguishes “known” from “trusted”
    Prompt Coverage# of distinct topic clusters where you have any visibilityMaps content gaps across the buyer journey
    Sentiment ScoreQualitative framing (positive / neutral / negative) of mentionsHigh visibility with bad framing is a liability
    Position in AnswerYour numerical order in multi-brand recommendation listsCaptures primacy bias — 1st position drives 32% higher purchase intent

    Answer Share: The Visibility Baseline

    This tells you whether the AI retrieves your brand at all. For new brands in competitive categories, any Answer Share above 0% in a contested niche is a meaningful starting point. Established brands typically target 20-40% share across their core prompt clusters.

    Citation Rate: The Trust Metric

    Being mentioned and being cited are different things. An AI might say “many users prefer Brand X” without linking anywhere. A citation happens when the AI explicitly references your domain as the source of a specific fact. High Citation Rates come from publishing original research and proprietary data — content that LLMs need to ground their answers. Studies show that including statistics and authoritative quotes can improve AI visibility by 30-40%.

    Prompt Coverage: The Journey Metric

    Traditional SEO focuses on head terms. Prompt Coverage looks at whether your brand is visible across the full arc of how users actually ask AI questions — which averages 23 words per query, compared to 4 for traditional search. You need coverage at the discovery phase (“What is…”), the evaluation phase (“Best for…”), and the comparison phase (“X vs Y”).

    Sentiment Score: The Qualitative Check

    AI synthesizes consensus from across the web. That means it can inherit negative sentiment from Reddit threads or review sites. A brand mentioned as “the most expensive but least reliable option” has high Answer Share and a disastrous Sentiment Score. Positively framed LLM summaries increase purchase likelihood by 32% — so visibility without sentiment monitoring is only half the picture.

    Position in Answer: The Prominence Signal

    Primacy bias is real in LLM interactions. The first brand mentioned in a multi-brand list carries 32% higher purchase intent than those listed later. Tracking whether you’re the primary recommendation or the afterthought in a list is the AEO equivalent of position 1 vs. position 7 in legacy SEO.

    Why Most Teams Only Track One of These Five

    The honest answer: manual tracking doesn’t scale.

    Testing 50 prompts across three platforms (ChatGPT, Perplexity, Gemini) in five markets equals 750 individual manual searches per month. Most teams run 10 prompts on ChatGPT once a month and call it “AI search monitoring.” That anecdotal approach produces directional guesses, not KPIs.

    There’s also a structural problem: each platform retrieves information differently. ChatGPT relies heavily on training data plus real-time search, with a strong bias toward Reddit for professional services. Perplexity is search-first and favors recency and source diversity, making it the platform of choice for high-intent shoppers close to a decision. Google Gemini correlates strongly with E-E-A-T signals and organic rankings. A brand might have 40% Answer Share on Perplexity and 5% on ChatGPT for the same query set — and without cross-platform tracking, the team has no idea.

    The other trap is the exposure-sentiment mismatch. A team successfully optimizes for Answer Share, watches their visibility climb, and misses the fact that the AI is describing their product in a neutral or negative tone. High visibility, wrong story.

    One more reason not to check monthly and move on: AI visibility is volatile. Research shows a brand’s AI visibility can decline by 36% in as little as five weeks without any change in traditional organic rankings. Regular monitoring isn’t optional — it’s the baseline for any credible AEO program.

    How to Set Your First AEO KPI Baselines

    The prerequisite for any AEO strategy is a structured prompt set and a clean initial measurement.

    Step 1: Build a Master Prompt List (30-50 prompts)

    Start with 30 to 50 intentionally unbranded prompts that reflect how your target audience actually asks AI questions. Mix informational queries (“What’s the best way to solve X?”), evaluation queries (“Top tools for Y use case”), and direct comparisons (“Brand A vs Brand B for Z”). Sources for these: your Google Search Console long-tail data, “People Also Ask” boxes, and your sales team, who hears the literal questions prospects ask.

    Enterprise teams managing multiple product lines typically track 100+ prompts per cluster. For context, Topify‘s Basic plan supports 100 prompts with 9,000 AI answer analyses per month across ChatGPT, Gemini, Perplexity, and other major platforms — enough to get statistically meaningful data at a $99/month entry point.

    Step 2: Test Across Platforms in Private Mode

    Run each prompt across your target platforms using private/ephemeral chat to avoid personalization bias. Record your Answer Share, note whether citations link to your domain, log your position in any multi-brand recommendation list, and flag the sentiment framing. This is your baseline.

    For global brands: AI visibility can vary by as much as 2.8x depending on geography, so testing across key markets is necessary for an accurate picture.

    Step 3: Track Monthly and Watch for Movement

    Baselines are only useful if you track against them. Monthly cadence is the industry standard for most brands. If your Answer Share drops while organic rankings hold steady, it’s a signal that the AI’s “consensus engine” has shifted toward a competitor’s content or a new third-party source. That’s an actionable content gap, not a mystery.

    This is where automated platforms like Topify move from nice-to-have to necessary. Manually checking 50 prompts across three platforms and five countries every month is a 750-search operation. Topify’s Visibility Tracking automates that cross-platform query process in real time, while its Position Tracking monitors where your brand sits in the recommendation order relative to competitors. The Gap Detection feature identifies the specific prompts where a competitor is winning citations and you’re invisible — turning a data problem into a direct content roadmap.

    Reporting These KPIs to a CMO Who Still Thinks in Rankings

    The final hurdle isn’t measurement. It’s translation.

    Most CMOs and executive stakeholders still think in terms of “Page 1 of Google.” The fastest way to reframe this: position Answer Share as digital market share. A 28% Answer Share in your core category means the AI recommends your brand in roughly 1 in 4 relevant conversations. That framing lands differently than “we tracked 50 prompts across three platforms.”

    A practical AEO dashboard for monthly executive reporting:

    • AI Visibility Index (Answer Share %): The primary metric. Show MoM trend, not just the number.
    • Sentiment Score Trend: Qualitative brand health signal. Is the AI describing you more or less favorably than 90 days ago?
    • Top Cited Sources: Which third-party domains (Reddit, G2, Forbes, niche publications) are driving AI citations. This justifies PR and community budget.
    • Competitive Answer Share: Your share vs. top 3 competitors, side by side. This “Share of Voice” view is often the most persuasive element for leadership.
    • CVR (Conversion Visibility Rate): The downstream impact estimate — how AI citations translate into predicted lead volume or revenue.

    For SaaS brands specifically, a well-run AEO program typically targets a 15-20% lift in AI Visibility Score within the first two quarters of active optimization. That’s a concrete, reportable number. Topify’s Competitor Monitoring surfaces the side-by-side benchmarking data needed to build that narrative — tracking Visibility, Sentiment, and Position relative to named competitors across all major AI platforms.

    Conclusion

    Keyword rankings aren’t going to zero. But their value as the primary performance signal is already compromised for any category where AI platforms are part of how buyers research decisions.

    The new KPI stack — Answer Share, Citation Rate, Prompt Coverage, Sentiment Score, and Position in Answer — isn’t a theoretical framework. It’s what GEO teams that report accurately to leadership are already using. The core shift is simple but consequential: stop measuring where you appear in a list, and start measuring how often you’re part of the answer.

    FAQ

    Is “Answer Share” the same as “Brand Mention Rate”? 

    Not quite. Brand Mention Rate is a raw count of how many times your name appears. Answer Share is a probabilistic percentage tied to a specific set of intent-based prompts. Answer Share tells you where and why you’re being mentioned — not just that you were.

    How many prompts do I need for reliable AEO KPIs? 

    30 to 50 prompts is the industry standard for a focused brand or product line. Enterprise teams managing multiple categories typically use 100+ prompts per cluster to ensure statistical confidence.

    Can I track AEO KPIs without a dedicated tool? 

    A one-time audit, yes. Ongoing performance monitoring, no. Account personalization in AI platforms introduces bias, and the volume required for accurate cross-platform tracking makes purely manual approaches unreliable at scale.

    How often should I report on AEO performance? 

    Monthly rollups for brand health. For high-competition categories, weekly monitoring of Share of Voice and Citation Gaps is recommended — AI visibility is volatile enough that monthly-only tracking can leave you 4 weeks behind a competitor shift.

    What’s a good Answer Share benchmark for a new brand? 

    For a new brand, any Answer Share above 5-10% in a niche category is a strong starting point. The first goal is “Entity Recognition” — getting the AI to reliably associate your brand with the relevant category at all.

    Read More

  • KPIs for AEO: What to Track When CTR Dies

    KPIs for AEO: What to Track When CTR Dies

    Your rankings are fine. Your traffic isn’t.

    Position one still shows your domain. Google Search Console confirms your impressions are stable. But organic sessions are down 30%, and the pipeline has gone quiet. The culprit isn’t a penalty or an algorithm update you missed. It’s the synthesized answer sitting above your blue link, answering the user’s question before they ever consider clicking.

    That gap between ranking and traffic is widening fast, and the KPIs you’re using can’t explain it.

    Organic CTR Is Down. Your Rankings Aren’t Broken.

    The numbers from mid-2025 are hard to argue with. For informational queries where an AI Overview is present, organic click-through rates have dropped from a baseline of 1.76% to 0.61%, a collapse of over 65%. Position one listings, which historically captured the most clicks, have seen a 34.5% drop in CTR when AI Overviews appear above them. Some studies put that number closer to 79% for the top organic result.

    The mechanism is partly visual. AI Overviews push traditional results down by an average of 1,562 to 1,630 pixels, moving them below the fold before a user even starts reading. But the bigger issue is cognitive: the answer is already there. Global zero-click rates have reached approximately 60%, with mobile searches ending without a click 77.2% of the time.

    Blaming this on bad content or weak rankings is the wrong diagnosis. It’s a structural shift in how search works.

    What AEO Actually Measures (and Why It’s Different)

    Legacy SEO treated the search engine as a librarian pointing users toward relevant pages. AEO exists because that model no longer describes what Google, ChatGPT, or Perplexity actually do. These systems function as analysts: they read the pages, synthesize an answer, and deliver it directly.

    The result is a broken funnel. Awareness and consideration are now happening inside the search interface, without an external click. A user asking “Which email tool is best for a 50-person SaaS team?” gets a synthesized recommendation, evaluates the options presented, and often makes a decision, all without visiting a single website.

    That’s what the research calls Retrieval-Augmented Generation (RAG): the AI retrieves content blocks and weighs them based on “information gain,” the degree to which a source provides structured, unique, factual data that others don’t. Your content either gets extracted to form the answer, or it doesn’t.

    The median enterprise B2B brand is cited in only 3% of the AI Overviews for which it is relevant. That’s the visibility gap most dashboards still can’t see.

    The 6 KPIs for AEO That Actually Matter

    These aren’t replacements for every traditional metric. They’re the indicators that tell you what’s happening in the layer of search where clicks are no longer the primary outcome.

    1. AI Visibility Rate

    This is the primary health indicator for AEO. It measures the percentage of relevant, high-intent prompts where your brand appears in the synthesized AI response. The formula is simple: divide the number of queries where your brand is mentioned by the total tested category prompts, then multiply by 100.

    A low visibility rate means the AI doesn’t associate your brand with the core problems your product solves. That’s a content and positioning issue, not an SEO technical issue.

    2. Brand Position Index

    Being mentioned isn’t enough if you’re buried in an “others to consider” footnote. The Brand Position Index measures where your brand appears within recommendation lists or comparisons. High-performing brands aim to be the first-named entity in 30% or more of relevant responses. The difference between being listed first and third in an AI answer is roughly equivalent to the difference between ranking first and fifth on a traditional SERP.

    3. Sentiment Score

    AI engines don’t just cite brands. They characterize them. The Sentiment Score quantifies the tone used to describe your brand, typically on a scale from -100 to +100. There’s a meaningful difference between “Brand X is a CRM provider” (neutral) and “Brand X is widely recommended for its onboarding and support” (positive). Tracking this also catches AI hallucinations early, before they influence thousands of users.

    4. Citation Source Share

    Here’s a number worth sitting with: 82 to 85% of AI citations currently come from third-party platforms, not brand-owned domains. Reddit threads, G2 reviews, and industry publications are often driving your AI presence more than your own content. Citation Source Share tracks which domains are influencing how AI describes your brand. That shapes where you invest in digital PR.

    5. Prompt Coverage and Semantic Breadth

    Most teams track 10 to 20 branded queries. That’s not enough. The majority of high-value discovery happens through unbranded, category-level prompts: “best security software for small businesses,” “which analytics tool works with Shopify,” “what CRM does a 20-person team need.”

    Prompt Coverage measures how many distinct user intents your brand appears in. A narrow prompt pool produces a flattering visibility rate and a misleading picture of actual reach. A meaningful AEO baseline requires 25 to 100 context-rich prompts, expanding to thousands for enterprise-level tracking across ChatGPT, Perplexity, and Gemini.

    6. Conversion Visibility Rate (CVR)

    Traditional AI referral traffic often shows up as “Direct” in GA4 because UTM parameters get stripped. The Conversion Visibility Rate estimates the probability that an AI response is driving user interaction. The underlying data point here is significant: AI-referred visitors convert at a rate 4.4 times higher than organic search visitors, because the AI has already handled the research phase of their journey.

    That means your AI visibility is generating pipeline you’re not measuring, and likely not attributing.

    The Prompts You’re Not Tracking Are Costing You Visibility

    This is where most AEO strategies fall short before they even start.

    Branded prompts (queries containing your brand name) behave like navigational searches. They tend to produce high sentiment scores, but they don’t reach new customers. The real entrance for net-new discovery is the unbranded, category-level prompt: someone who doesn’t know your brand yet, asking an AI for a solution to a problem you solve.

    There are three practical ways to expand your prompt pool. Semantic mapping builds a matrix crossing product features with user personas and funnel stages. Community intelligence mines Reddit, Quora, and industry forums for the natural language questions users ask before a purchase decision. Sales and support mining extracts recurring themes from discovery calls and support tickets, which are often the exact questions AI systems are answering for prospects who haven’t contacted you yet.

    Manual methods work up to a point. Topify’s High-Value Prompt Discovery automates this by continuously surfacing new high-volume prompts across ChatGPT, Gemini, and Perplexity as AI recommendation patterns shift. That matters because 70% of AI Overview content changes within 90 days. Static prompt pools go stale fast.

    How to Build Your AEO Reporting Dashboard

    The reporting structure needs to match the audience, not just the data.

    For execution teams tracking weekly, the focus is on week-over-week shifts in visibility rate, new competitor recommendations entering the AI results, and changes in citation source patterns. This cadence allows content teams to respond to emerging gaps before they compound.

    For marketing managers reviewing monthly, the relevant metrics are Sentiment Score trends, Position Index changes, and competitor share of voice in AI responses. This level answers whether campaigns are actually shifting how AI characterizes the brand.

    For CMOs and VPs reviewing quarterly, the focus shifts to category role (are you positioned as a leader, challenger, or afterthought in AI answers?), AI referral CVR, and the correlation between AI visibility and branded search volume. This is the layer that justifies AEO investment and informs budget allocation.

    Topify’s 7-metric framework integrates all of this into a unified dashboard: visibility rate, brand mentions, position index, sentiment quotient, source/citation rate, AI search volume, and intent/CVR. That’s relevant because fragmented tools force teams to manually reconcile data from five different sources, which slows down the iteration cycle that AEO requires.

    Short-Term: Run SEO and AEO KPIs in Parallel

    Don’t drop organic metrics cold. During the transition, the right approach is a dual-track system: continue monitoring organic search sessions alongside AI visibility and citation rate. This prevents a specific blind spot where stable rankings can mask a collapsing pipeline caused by AI displacement.

    The metrics to run in parallel:

    Traditional SEO KPIAEO Equivalent
    Organic CTRAI Visibility Rate
    Average PositionBrand Position Index
    Branded Search VolumeSentiment Score + Brand Mentions
    Backlink Domain CountCitation Source Share
    Keyword Ranking CoveragePrompt Coverage
    Organic ConversionsConversion Visibility Rate (CVR)

    The crossover point varies by category. In cybersecurity, where AI Overviews appear in roughly 60% of relevant queries, the AEO metrics are already more predictive. In real estate, where that figure is closer to 4.5%, traditional metrics still carry more weight.

    What Good Looks Like: AEO Benchmarks by Stage

    Performance in AEO is relative to your category and current maturity, not an absolute number.

    Foundation stage (visibility below 20%): The brand is largely absent from synthesized answers. The priority is “atomic answers”: adding 30 to 60 word direct summaries at the top of high-performing pages and implementing FAQ and structured schema. The goal is to become extractable before trying to become primary.

    Growth stage (visibility 20 to 50%): The brand is entering the conversation but typically ranked second or third. The shift here is toward “information gain”: adding proprietary data, original research, and expert quotes that AI models favor for primary citation. Third-party platforms like G2 and industry publications need active management because they’re likely driving more of your AI presence than your owned content.

    Leadership stage (visibility above 50%): The brand is the first-choice recommendation in its category. The focus becomes narrative defense: monitoring for sentiment drift and ensuring AI models don’t retrain on competitor content or outdated positioning.

    Industry variance matters here. Health and finance categories show the highest AI Overview prevalence (48.75% and 25.79% respectively), meaning those brands face the steepest zero-click challenge, but also the highest trust transfer when they earn a citation. B2B SaaS sits near 50% prevalence with a median of just 3% of brands receiving consistent citations, which represents both the problem and the opportunity.

    Conclusion

    Organic CTR isn’t dead. It still matters for transactional and deep-research queries where users need to verify complex decisions. But for informational and early-stage research queries, it’s become a lagging indicator that hides more than it reveals.

    The brands building durable positions in 2026 are the ones treating AI visibility as a measurable channel with its own KPI structure, not a side effect of SEO. Start with AI Visibility Rate and Conversion Visibility Rate. These two metrics are the easiest to establish a baseline on, and they’re the ones that will tell you whether your brand exists in the layer of search where your next customer is making decisions.

    FAQ

    What are KPIs for AEO? 

    Key Performance Indicators for Answer Engine Optimization include AI Visibility Rate (percentage of relevant prompts where the brand appears), Brand Position Index (rank within AI recommendation lists), Sentiment Score (tone of AI characterization), Citation Source Share (which domains drive AI mentions of your brand), Prompt Coverage (breadth of user intents captured), and Conversion Visibility Rate (estimated conversion probability per AI response).

    How is AEO different from SEO measurement? 

    SEO measurement centers on page-level rankings and the volume of clicks driven from a results page. AEO measurement focuses on entity-level inclusion within a synthesized answer, tracking the brand’s role in the response rather than the traffic it generates.

    Can I still use organic CTR as a KPI? 

    Yes, for transactional and lower-funnel queries. For informational and early-stage research queries, CTR has become a misleading indicator because zero-click rates now exceed 60% globally, with mobile at 77.2%. Use it in parallel with AEO metrics during the transition rather than as a standalone measure of search performance.

    How many prompts should I track for AEO? 

    A meaningful baseline requires 25 to 100 context-rich prompts representing your target personas and journey stages. Enterprise-level tracking typically expands to thousands of prompts to account for variation across ChatGPT, Perplexity, Gemini, and platform-specific behavior.

    What tools can help track AEO KPIs? 

    Specialized platforms like Topify are built specifically for this: tracking brand mentions, citations, sentiment, and position across major LLMs in a unified dashboard. Traditional SEO platforms like Ahrefs and SEMrush are beginning to integrate some of these metrics, but their AI visibility coverage remains limited compared to purpose-built AEO tools.

    Read More

  • KPIs for AEO: What to Track When AI Answers First

    KPIs for AEO: What to Track When AI Answers First

    Your Google rankings are holding. Your content is ranking on page one. But organic traffic is quietly falling — and no one can explain why.

    That’s not a mystery anymore. It’s a structural shift. Nearly 69% of all global searches now end without a single click, with users getting their answers directly from AI-generated summaries. The traffic didn’t disappear. It got intercepted.

    The problem isn’t your content. It’s your dashboard. The KPIs you’ve been reporting for years were built for a world where people clicked. That world is shrinking fast.

    Your Rankings Are Still Going Up. Your Traffic Isn’t.

    Traditional SEO metrics assume a simple chain: high rank → impression → click → visit. Break any link in that chain and the whole model falls apart.

    Statista and Similarweb data now shows 68.7% of global searches resolve entirely within the search ecosystem, never generating an outbound click. That’s roughly 14 billion daily search sessions that produce zero traffic for any external site. On mobile, the zero-click rate hits 77.2%.

    The data from Seer Interactive and Authoritas makes the CTR impact concrete: when an AI Overview is present, organic CTR drops 61% — from 1.76% down to 0.61%. Paid CTR fares worse, collapsing 68% from 19.7% to just 6.34%.

    Ranking #1 still matters. But it no longer guarantees visits the way it used to.

    SEO, AEO, and GEO Don’t Just Differ in Name

    Before rebuilding your KPI framework, it helps to be precise about what you’re actually optimizing for. These three disciplines have different mechanics, different targets, and different definitions of “winning.”

    DimensionSEOAEOGEO
    Core goalRank in blue-link resultsBe the direct answer (snippets, voice)Get cited and recommended by LLMs
    Primary targetGoogle SERPFeatured snippets, Alexa, SiriChatGPT, Gemini, Perplexity
    Success signalRank position, CTR, trafficInclusion rate in direct answersAI visibility, sentiment, position
    Key technical signalBacklinks, relevanceSchema markup, FAQ structureEntity authority, third-party mentions

    SEO handles the bottom of the funnel, where users still click to transact. AEO wins featured extractions for factual, question-based queries. GEO earns the brand a seat in synthesized, conversational responses.

    You need all three. But you can’t track all three with the same scorecard.

    The 3 SEO KPIs You Can’t Rely on Anymore

    This isn’t about abandoning what worked. It’s about knowing where the blind spots are.

    Organic CTR used to be a reliable proxy for content relevance. Now it measures something else entirely: how many of your indexed queries don’t trigger an AI answer. Pew Research and Semrush data shows only 1% of users click links embedded inside AI summaries. If your highest-traffic informational queries now trigger AI Overviews, CTR will drop even if your content is performing well.

    Rank position is still useful for commercial queries. But for informational queries, ranking #1 organic is now primarily a prerequisite for citation — not a traffic driver in its own right. It gets you in the room. It doesn’t guarantee the result.

    Bounce rate and time-on-page are losing meaning for informational content. When users increasingly resolve their question before reaching your site, the visitors who do arrive skew toward high-intent, late-funnel behavior. Your averages get distorted.

    These metrics didn’t stop working. They stopped telling the whole story.

    The KPI Framework Built for AEO and GEO

    Here’s what the new scorecard looks like in practice. These are the metrics that actually reflect how your brand performs in a world where AI answers first.

    AI Visibility Rate (Share of Model) This is the new Share of Voice. It measures how often your brand appears in AI-generated responses for high-intent category prompts. If you query ChatGPT with 100 variations of “best CRM for SaaS teams” and your brand appears in 48 of those responses, your Share of Model is 48%.

    Citation Frequency How often AI platforms cite your content or mention your brand name in a response. This is the AEO equivalent of backlink count — it’s an authority signal in generative results. Research from the Princeton GEO study confirms brand search volume carries a 0.334 correlation with model confidence, making it the single strongest predictor of AI recommendation.

    Sentiment Score AI doesn’t just list brands. It characterizes them. Being described as “reliable but expensive” or “good for small teams” shapes whether you appear in “best” or “affordable” category prompts. Sentiment Score measures the polarity of how AI engines describe your brand — and it directly filters which prompts you’re eligible to win.

    Position in AI Answer Not all mentions are equal. Being named first in a ChatGPT recommendation carries more weight than appearing fifth. Position tracking measures your relative rank within AI-generated responses compared to competitors.

    Recommendation Rate vs. Mention Rate There’s a critical gap between being listed and being recommended. A brand can appear in an AI response as a neutral option or as the explicit top pick. Recommendation Rate captures how often the AI actively steers users toward your brand, not just mentions it.

    These five metrics, tracked consistently, give you a diagnostic view of your AEO and GEO performance that rank tracking simply can’t provide.

    One Metric Most Brands Miss: Conversion Visibility Rate

    Most teams stop at visibility. That’s a mistake.

    High visibility with weak sentiment or poor positioning may generate brand impressions that never translate into intent. The gap between “being mentioned by ChatGPT” and “driving a user to search your brand name or visit your site” is where most AEO strategies leak.

    CVR — Conversion Visibility Rate — estimates the likelihood that an AI-generated mention is actually moving users toward a conversion action, even when no click is recorded. It bridges the technical visibility metrics and real business outcomes.

    The commercial case for closing that gap is real. Adobe’s 2026 analysis found AI-driven traffic to retail sites converts 42% better than traditional search traffic. In B2B SaaS, the gap is even wider: AI search visitors convert at 23x the rate of traditional organic visitors, because they’ve already completed a deep evaluation session inside the AI interface before ever clicking.

    Topify includes CVR as one of its seven core tracking metrics, alongside visibility, sentiment, position, volume, mentions, and intent. The combined view is what makes it possible to correlate AI surface performance with downstream revenue signal — instead of guessing.

    How to Start Tracking These KPIs Without Building from Scratch

    The practical challenge is setup. Most teams default to Google Search Console and GA4, which have real blind spots in generative environments.

    GSC’s new AI Mode filter tracks impressions and clicks, but it doesn’t capture pure citations — cases where a user saw your brand in an AI Overview and didn’t click anything. For queries with six or more words (the long-tail conversational format most likely to trigger AIOs), you’re essentially flying blind without a dedicated tracking layer.

    GA4 is more useful for measuring quality once traffic arrives. Teams are building custom “AI Search” channel groups using regex to capture referral traffic from sources like chatgpt.comperplexity.ai, and gemini.google.com. That data consistently shows AI traffic is a small slice of total volume (roughly 1% in 2026) but converts at a disproportionately high rate.

    For actual AI visibility tracking, the practical path is to:

    1. Define the 30-50 core prompts your category uses across different AI platforms
    2. Establish a baseline Share of Model for each platform separately
    3. Track weekly — AI recommendations shift faster than SERP rankings
    4. Monitor competitor positions in parallel, not separately

    Topify’s Basic Plan at $99/month handles this across ChatGPT, Gemini, Perplexity, and AI Overviews with 100 prompts out of the box. The seven-metric dashboard gives you visibility, sentiment, position, and CVR in a single view, so you’re not manually stitching together data from multiple tools.

    One thing to flag: don’t assume a strategy optimized for Google’s AI Overviews transfers directly to ChatGPT. Research shows only an 11% overlap between domains cited by ChatGPT and those cited by Perplexity. Platform-specific optimization is table stakes in 2026.

    Your Reporting Template Needs to Change, Too

    The metrics upgrade only matters if the reporting structure changes with it. A slide deck built around “organic traffic up 12% month-over-month” doesn’t capture whether your brand is gaining or losing ground in generative search.

    A practical AEO/GEO reporting template covers four layers:

    AI Visibility Score — Share of Model across your core prompt set, broken out by platform. This is your headline metric, equivalent to the old “rankings summary.”

    Competitor Gap — Where competitors appear in prompts where you don’t, and where you’ve closed or widened the gap month-over-month.

    Sentiment Trend — Whether AI characterizations of your brand are moving in a commercially favorable direction (more “recommended,” fewer “expensive,” etc.).

    CVR Estimate — Correlation between AI visibility changes and branded search volume or direct traffic, as a proxy for downstream commercial impact.

    The goal isn’t just to rank. It’s to be the brand AI recommends.

    That distinction shapes every decision downstream — what content you build, which third-party platforms you prioritize, how you brief your PR team. The 82-85% of AI citations that come from third-party sources (media coverage, Reddit threads, G2 reviews) means your off-site presence is now a direct AEO/GEO input, not just a brand exercise.

    Conclusion

    The KPI migration from SEO to AEO/GEO isn’t a future problem. For most brands, the gap between what their dashboard shows and what’s actually happening in AI search is already widening.

    The good news: the new framework isn’t complicated. Share of Model, Citation Frequency, Sentiment Score, Position, Recommendation Rate, and CVR replace the old rank-and-click model with metrics that map directly to how AI engines make recommendations.

    Start with a prompt baseline. Build the tracking layer. Then run SEO and AEO/GEO in parallel — they serve different funnel stages now, and collapsing them into one scorecard is how teams end up optimizing for the wrong signal.


    FAQ

    What’s the difference between AEO KPIs and GEO KPIs? 

    AEO KPIs focus on inclusion rate in direct-answer formats — featured snippets, voice search, factual extractions. GEO KPIs measure brand performance in synthesized, conversational AI responses from LLMs like ChatGPT or Gemini. In practice, you’ll want both: AEO metrics for structured content performance, GEO metrics for brand narrative and recommendation positioning.

    Can I use Google Search Console to track AEO performance? 

    Partially. GSC’s AI Mode filter captures clicks and impressions on generative features, but it doesn’t record citations where a user read your brand name in an AI Overview without clicking. For full AEO visibility, you’ll need a dedicated multi-engine tracking tool alongside GSC.

    How often should I review my AEO metrics? 

    Weekly at minimum. AI recommendations shift significantly faster than SERP rankings, and competitor positioning can change after a single news cycle or third-party content spike. Monthly review cycles that work for traditional SEO will miss meaningful movement in generative results.

    What’s a good AI visibility score benchmark? 

    This varies by category and competitive density, but a Share of Model above 30% for your core category prompts is generally considered a strong position. More important than the absolute number is the trend and the competitor gap — are you appearing in prompts where your top competitors appear? That comparison is typically more actionable than a standalone score.

    Do I need separate KPIs for different AI platforms like ChatGPT vs. Perplexity? 

    Yes. Research shows only an 11% overlap between domains cited by ChatGPT and those cited by Perplexity. A brand can rank well on one platform and be nearly invisible on another. Platform-specific tracking is essential, especially if your target audience is concentrated on particular AI interfaces.


    Read More

  • KPIs for AEO: What to Track If AI Is Citing You

    KPIs for AEO: What to Track If AI Is Citing You

    Your domain authority is solid. Your keyword rankings haven’t dropped. But someone on your team just searched for your product category in ChatGPT and your brand wasn’t mentioned once, while two direct competitors appeared in the top three recommendations. The problem isn’t your SEO. It’s that the metrics you’re using to measure success weren’t built to see AI search at all.

    Around 70.6% of traffic originating from AI platforms is misclassified as “Direct” in GA4. So the AEO and GEO work you’ve been doing? A chunk of its impact is already showing up in your reports, just buried under the wrong label.

    Here’s how to build a GEO dashboard around the KPIs that actually tell you what’s happening.

    Your Analytics Dashboard Can’t See AI Traffic

    Before covering which KPIs for AEO matter, it’s worth understanding why your current setup is blind to them.

    When a user asks ChatGPT for a software recommendation and then navigates directly to your site, they typically copy the URL into a new browser tab. No referrer header gets passed. GA4 logs the visit as “Direct.” This is what researchers call “Dark AI” traffic, and it’s a significant blind spot: that same traffic converts at a transactional rate of 10.21%, roughly 4.1 times higher than standard non-AI traffic.

    The scale of the underlying activity makes this more urgent. ChatGPT’s crawl-to-refer ratio sits at approximately 3,700:1, meaning for every visitor it sends to your site, it may have crawled and ingested your content 3,700 times. For Claude, that ratio expands to roughly 500,000:1. AI platforms are extracting value from your content at a rate that never shows up in referral data.

    This is compounded by the zero-click reality. About 60% of all searches end without a website visit, with user intent satisfied directly in the interface. When a Google AI Overview is triggered, that zero-click rate jumps to 83%, and the average CTR for the top organic result drops by 58%. A brand can be cited ten times daily across AI platforms and register zero sessions in Search Console.

    That’s the gap a GEO dashboard is designed to close.

    The 7 KPIs for AEO That Actually Matter

    These metrics shift the frame from “winning a click” to “winning a citation.” Each one maps to a specific question your team needs to answer.

    #1 AI Visibility Rate (Citation Rate)

    This is the baseline KPI: what percentage of your target prompts return a response that mentions your brand?

    The formula is straightforward. Divide the number of queries where your brand appears by the total number of tested queries, then multiply by 100. For B2B SaaS, 8-15% typically indicates minimal presence. Category leadership in most verticals starts around 40-50%. Run this across a defined prompt library covering purchase-intent, comparison, and informational queries, not just branded terms.

    #2 Answer Placement Score (APS)

    Being cited isn’t enough. The third recommendation in a conversational AI response carries a fraction of the value of the first.

    APS assigns weighted credit by position: the primary recommendation scores 1.0, the second approximately 0.6, and anything lower typically drops below 0.3, which is effectively irrelevant in a conversational context. A brand with a 25% Citation Rate but consistently low APS scores is being mentioned without being recommended. That’s a very different strategic problem.

    #3 Sentiment Polarity

    AI platforms don’t just list brands. They characterize them. “Ideal for enterprise security teams” and “a reasonable budget option” are both citations. Only one of them maps to your positioning.

    Sentiment Polarity uses NLP to assess how generative engines frame your brand. It also captures Recommendation Strength: whether the AI “soft” suggests your product (“you might consider…”) or hard-endorses it (“the most reliable option for…”). A Sentiment Score shift is often the first signal that something in your content strategy needs to change.

    #4 Feature Association Coverage

    This KPI measures whether AI models associate your brand with the right value propositions.

    If your company’s strategic goal is to be recognized for AI-native analytics, but generative models primarily describe you as a “legacy reporting tool,” there’s a positioning gap. Feature Association Coverage tracks the percentage of brand mentions that include your target thematic keywords. It’s how you validate whether your messaging has actually permeated the model’s retrieval context.

    #5 Branded Search Lift

    Successful AEO frequently drives zero-click awareness that surfaces later as a branded search.

    A user encounters your brand in a ChatGPT summary, doesn’t click through immediately, but searches for you by name later in the day. That shows up in Search Console as branded search volume, not as an AI referral. Tracking the correlation between rising AI visibility and rising branded search volume gives you a measurable proxy for AEO impact, even when direct attribution is impossible.

    #6 Source Citation Rate

    AI models are 6.5 times more likely to cite a brand through an external authoritative source than through its own website. This makes third-party mentions, Reddit threads, G2 reviews, and independent editorial coverage as strategically important as owned content.

    Source Citation Rate tracks which domains are “carrying” your brand’s visibility in AI retrieval. If AI models consistently surface your brand through a competitor comparison article on a third-party review site, that article is functioning as a citation asset, and you need to know about it.

    #7 Conversion Visibility Rate (CVR)

    The final KPI connects visibility to revenue intent. CVR estimates the probability that an AI response will lead a user toward a brand interaction, based on the query type, placement, sentiment, and response structure.

    This isn’t direct conversion tracking. It’s a predictive signal that helps prioritize which prompt clusters to invest in. High CVR prompts with low Citation Rates represent your clearest content gap opportunities.

    How to Structure Your GEO Dashboard

    A functional GEO dashboard isn’t a single view. It’s three layers, each answering a different question.

    The Monitoring Layer covers daily and weekly brand health. Citation Rate, Mention Frequency, and Share of Voice across the major AI platforms: ChatGPT, Perplexity, Gemini, and Google AI Overviews. Because generative outputs are non-deterministic, these scores should be based on rolling averages across a defined prompt library, not single-query snapshots. This layer answers: “Are we visible this week?”

    The Analysis Layer goes qualitative. Sentiment Polarity trends, Feature Association Coverage, and Source Citation Distribution live here. This layer answers: “Why is our visibility what it is?” It surfaces which third-party domains are influencing AI citations and where your brand’s framing is drifting from its intended positioning.

    The Action Layer converts data into work orders.

    That’s the layer most teams skip. It includes content decay alerts for URLs that have dropped in retrieval performance, competitive displacement notifications when a rival brand displaces yours for a high-value prompt cluster, and gap reports that identify subtopics your competitors own in AI responses but you have no content covering. Without this layer, a dashboard is a scoreboard with no scoreboard.

    Dashboard LayerCore MetricsReporting Cadence
    MonitoringCitation Rate, Visibility %, Mention FrequencyWeekly
    AnalysisSentiment, Feature Association, Source DistributionBi-weekly
    ActionContent Decay Alerts, Gap Reports, Competitor DisplacementContinuous

    Competitor Benchmarking Makes These KPIs Meaningful

    A 20% Citation Rate sounds decent until you learn your top competitor is at 62%.

    This is why absolute visibility scores need competitive context. The most useful framing is Share of Model (SoM): what percentage of AI citations in your category go to your brand versus all named competitors, across a representative set of 50-100 buyer-intent queries? SoM reveals not just where you stand, but which specific prompts competitors dominate.

    From that analysis, prompt clusters split into two categories.

    Defensive prompts are queries where you currently lead. These need continuous monitoring. A competitor publishing fresher data or better-structured content can displace you without any algorithmic update. The mechanism is retrieval-based: if their content provides a more complete, extractable answer, the model will prefer it.

    Offensive prompts are queries where competitors lead but you have no presence. These are your clearest content investment opportunities. Industry benchmarks for 2026 show the IT sector sees AI referral traffic around 2.8%, the highest across tracked verticals. For most B2B SaaS categories, the difference between a 15% and a 45% Share of Model typically comes down to prompt coverage and content freshness, not domain authority.

    One Platform That Tracks All 7 KPIs Natively

    Building a custom AEO dashboard means scraping multiple AI platforms, processing unstructured conversational text, running manual prompt tests on a regular cadence, and rebuilding the analysis every time a platform updates its behavior. Most teams that start down that path abandon it within 60 days.

    Topify tracks all seven core AEO KPIs natively across ChatGPT, Gemini, Perplexity, DeepSeek, and several other platforms. The platform covers Visibility Rate, APS, Sentiment Polarity, Feature Association, Branded Search correlation, Source Analysis, and CVR in a single dashboard, without requiring manual prompt submission.

    A few specific capabilities are worth noting. Topify’s Source Analysis and Gap Detection reveals which third-party domains are driving your AI citations, where your coverage is weak, and which competitors are benefiting from sources you haven’t prioritized. Its Competitor Monitoring runs continuously, so if a rival brand displaces yours as the primary recommendation for a high-value query cluster, you get an alert rather than discovering it a month later in a manual audit.

    The Basic plan starts at $99/month and covers 100 prompts with 9,000 AI answer analyses across four projects. For teams just getting started with GEO measurement, that’s enough prompt coverage to establish baseline Citation Rates and Share of Model across a primary product category. The Pro plan at $199/month expands to 250 prompts and 22,500 analyses, which supports multi-category tracking or competitive prompt libraries.

    Other platforms serve specific segments well. Profound focuses on enterprise compliance requirements and Fortune 500 technical audit needs. Frase works for content teams that need to optimize for Google rankings and AI citations simultaneously, noting that only 38% of AI citations come from the top 10 Google results, so organic authority alone doesn’t guarantee AI visibility. Each platform reflects a different set of trade-offs, but for teams that need native coverage of all seven AEO KPIs in one place, Topify is the practical starting point.

    The Measurement Mistakes Most AEO Teams Make

    A few patterns show up consistently across teams that invest in GEO measurement but don’t get traction.

    Tracking only one AI platform. ChatGPT has the largest public mindshare, but it isn’t where all AI-assisted discovery happens. A brand with a 45% Citation Rate on ChatGPT and a 9% rate on Perplexity has a real gap, especially if their audience skews toward technical or research-oriented users who tend to favor Perplexity for commercial queries.

    Ignoring Sentiment while optimizing for Visibility. A rising Citation Rate paired with a declining Sentiment Score is not progress. It means AI models are mentioning your brand more often in negative or misframed contexts. Teams that optimize purely for presence without monitoring how they’re being characterized can accelerate brand positioning problems rather than fix them.

    Prompt coverage that’s too narrow. Many teams start by tracking branded queries only, checking whether their brand appears when someone searches for them by name. That’s the wrong set. AEO value comes from showing up for category-level, comparison, and use-case prompts where the user has no brand preference yet. Those are the queries that drive discovery.

    Treating AEO as a one-time project. Research shows that 50% of content cited in AI answers is less than 13 weeks old. Content published and left static will see its citation rate decay as competitors publish fresher data and better-structured answers. Additionally, 44% of all AI citations come from the first third of a piece of text (Princeton GEO study, KDD 2024), so structural updates to where key answers are positioned in your content can have a faster impact than publishing new pages.

    Conclusion

    The brands that win AI search visibility aren’t necessarily the ones with the highest domain authority. They’re the ones that know what they’re measuring and act on it at the right cadence.

    Start with AI Visibility Rate and Answer Placement Score to establish a baseline. Add Sentiment Polarity to catch positioning drift early. Build toward Share of Model benchmarking once your prompt library is large enough to be representative. The seven KPIs for AEO outlined here aren’t a replacement for your existing analytics stack. They’re the layer that fills in what your current dashboard can’t see. Get started with Topify to run your first visibility audit across the AI platforms your audience is actually using.


    FAQ

    Q: What’s the difference between AEO KPIs and GEO KPIs?

    A: The terms are often used interchangeably, but there’s a useful distinction. AEO (Answer Engine Optimization) KPIs focus on visibility in direct answer interfaces, such as Citation Rate and Answer Placement Score. GEO (Generative Engine Optimization) KPIs extend that frame to include how AI models synthesize and characterize brands across longer conversational responses, covering Sentiment Polarity, Feature Association, and Source Citation patterns. In practice, an effective dashboard tracks both sets together.

    Q: How often should I check my GEO dashboard metrics?

    A: Citation Rate and Mention Frequency are worth reviewing weekly, since generative models update their retrieval behavior more frequently than traditional search algorithms. Sentiment trends and Source Distribution are better reviewed bi-weekly or monthly, as they shift more gradually. The action layer, specifically content decay alerts and competitor displacement notifications, should be monitored continuously if you’re running an active GEO strategy.

    Q: Can I track AEO KPIs for free without a dedicated tool?

    A: Manual tracking is possible but limited. You can run weekly prompt tests across ChatGPT and Perplexity and log whether your brand appears, roughly estimating Citation Rate. Sentiment analysis would need to be done by reading responses manually. Source tracking requires identifying which URLs AI responses reference and cross-checking them against your domain. At 50-100 prompts across 3-4 platforms, the manual workload becomes unsustainable for most teams within the first month.

    Q: What’s a realistic AI Visibility Rate target for a B2B SaaS brand?

    A: For most B2B SaaS categories, an 8-15% Citation Rate indicates minimal presence. Reaching 25-35% across a representative prompt library typically signals a content strategy that’s working. Category leadership, where your brand is the default first-mention in AI responses for your core use cases, generally requires a 40-50% or higher rate. The useful benchmark, though, is relative to your specific competitors in a Share of Model framework rather than an absolute percentage.


    Read More

  • AEO KPIs That Actually Matter When Clicks Disappear

    AEO KPIs That Actually Matter When Clicks Disappear

    Your analytics dashboard looks fine. Sessions are stable. Bounce rate is normal. Rankings haven’t moved.

    But somewhere right now, a potential customer is asking ChatGPT which tool to use in your category. And your brand isn’t in the answer.

    That’s the gap most teams still can’t see — because they’re measuring the wrong things. Traditional SEO metrics track what happens after a click. In 2025, the decision happens before one. If your KPI stack still starts with organic traffic, you’re not measuring AEO performance. You’re measuring something that no longer reflects how your buyers discover you.

    This article breaks down the seven KPIs that replace rankings in the AI search era, how to report them to stakeholders who still think in clicks, and the three measurement mistakes that quietly make your data useless.

    Your Analytics Look Fine. Your AI Presence Might Not.

    Search volume is actually up. Global daily search queries are projected to hit between 9.1 billion and 13.6 billion in 2025, driven by AI-integrated platforms. But those searches aren’t producing the same clicks they used to.

    About 60% of Google searches in 2025 end without a single click. On mobile, that number climbs to 77.2%. When AI Overviews appear, top-of-page click-through rates drop by 58%, and the cited sources inside those overviews earn only around 1% CTR. Information query CTR has fallen from a 15-19% range down to roughly 8%.

    The result: B2B sites are seeing baseline referral traffic decline by 34%, even as search volume increases.

    Here’s what this means for measurement. User discovery now happens before a click is ever made. Brand recognition forms inside the AI response itself. A user who read a ChatGPT answer recommending your product and went directly to your site won’t show up in organic search attribution. They’ll look like direct traffic, or dark social, or nothing at all.

    That’s not a traffic problem. It’s a visibility measurement problem.

    The 7 AEO KPIs That Replace Rankings

    These aren’t supplementary metrics. For any brand with meaningful exposure to AI-driven queries, these are the primary indicators of search performance.

    1. Visibility Rate

    Visibility Rate measures how often your brand appears in AI-generated answers across a defined set of target prompts. It’s calculated as the percentage of tracked queries where your brand shows up.

    This is the north-star metric for AEO. It doesn’t track where your page ranks. It tracks whether you’re present in the conversation at all.

    Strong B2B SaaS companies typically target 10-15% as an initial benchmark. Market leaders tend to hold above 30%. The right number is heavily industry-dependent: healthcare AI Overviews trigger at a 48.7% rate, making 30%+ visibility table stakes for category authority. Real estate AIO triggers only 4.4% of the time, so a 10% visibility rate there already signals market leadership.

    2. Position / Mention Rank

    Not all mentions are equal. Being named first in a ChatGPT response carries a fundamentally different weight than appearing in a closing “you might also consider” list.

    In Perplexity-style roundups, a first-position mention signals that AI systems have categorized your brand as the primary entity in that topic space. It shapes the context of everything that follows in the response. Second and third mentions carry real value, but the drop-off is significant.

    Track this as a distribution: what percentage of your brand appearances are first-mention, mid-response, or trailing? Watch how it moves relative to competitors.

    3. Sentiment Score

    Being mentioned and being recommended are not the same thing.

    Sentiment Score uses natural language processing to analyze the tone AI platforms use when describing your brand, typically on a 0-100 scale. If an AI response reads “Brand X has a strong feature set, though users frequently report slow support response times,” your visibility number looks fine. Your conversion potential doesn’t.

    This score evaluates literal language, surrounding context, and the credibility weight of the sources being synthesized. A brand with 25% visibility and a 78 sentiment score will consistently outperform a brand with 40% visibility and a 54 sentiment score.

    4. Share of Voice

    Share of Voice (SOV) measures your brand’s AI mention share relative to competitors across a relevant topic cluster. If an AI response lists five solutions in your category and your brand accounts for two of those slots, your SOV on that prompt is 40%.

    This is the metric that translates most cleanly for executives. In an environment where AI satisfies 60% of search queries, AI Share of Voice is a direct proxy for future market share. It’s the competitive scoreboard your leadership team already understands.

    5. Source / Citation Coverage

    This metric tracks which specific domains and pages AI platforms draw from when mentioning your brand. More importantly, it reveals AI’s “trust neighborhoods”: the third-party platforms (Reddit, Wikipedia, vertical media, industry analysts) that AI systems treat as authoritative sources about your category.

    Citation Coverage lets you reverse-engineer AI trust paths. If Perplexity is citing three competitor case studies from a niche industry forum you haven’t touched, that’s a specific content distribution gap, not a generic “create more content” problem.

    6. Prompt Coverage

    Traditional SEO tracks rankings for a finite keyword list. Prompt Coverage measures how many distinct query types, phrasings, and intents trigger your brand to appear.

    This includes “why” questions, “how to choose” comparisons, “Brand A vs.” queries, and long-form conversational prompts with subjective modifiers. High Prompt Coverage indicates broad semantic representation inside AI knowledge models, not just keyword matching. It’s the difference between a brand that shows up for “best CRM” and a brand that shows up for “what CRM works best for remote teams scaling past 50 people.”

    7. CVR: Conversion Visibility Rate

    The click volume is lower. The intent behind those clicks is significantly higher.

    AI-referred traffic converts at 4.4 times the rate of traditional organic search. In some documented cases, ChatGPT referral traffic converts at 16%, compared to Google organic’s average of 1.8%. CVR estimates the probability that an AI recommendation leads to a downstream commercial action: a signup, a demo request, a purchase.

    This is what closes the ROI argument for AEO investment.

    AEO vs GEO KPIs: Same Framework, Different Baselines

    These seven metrics apply to both Answer Engine Optimization and Generative Engine Optimization, but the execution context differs.

    DimensionAEOGEO
    Primary targetsGoogle AI Overviews, voice assistants, featured snippetsChatGPT, Gemini, Perplexity, Claude
    Content styleShort, extractable, answer-firstSemantically rich, comprehensive, data-heavy
    Visibility baselineAIO trigger rate by industryChat-based prompt response frequency
    Citation sourcesGoogle’s crawl indexTraining data + real-time retrieval (RAG)
    Key technical signalsFAQ/HowTo schema, conversational toneE-E-A-T signals, third-party authority, freshness
    Sentiment measurementSnippet toneSynthesized narrative tone

    The overlap is real: brands that rank well on AEO Visibility Rate tend to perform well on GEO Prompt Coverage. But a brand that’s dominated Google AI Overviews can still be invisible on ChatGPT. Platform-specific tracking is non-negotiable.

    How to Report AEO KPIs to People Who Still Think in Clicks

    The biggest internal obstacle to AEO strategy usually isn’t budget. It’s a CMO or CFO asking “where are the numbers I recognize.”

    Use translation, not terminology.

    Visibility Rate ≈ Qualified Impressions. Frame it as the number of AI-driven decision conversations where your brand was present. Unlike ad impressions, these are AI-endorsed placements at the top of the user’s decision funnel.

    Share of Voice = Competitive Market Position. This is language senior leaders already use. A 40% AI SOV in your category means you’re winning the AI recommendation market by a 2:1 margin over your nearest competitor.

    Report change, not absolutes. AI models update frequently. About 40-60% of AI Overview citation sources rotate monthly. What matters to leadership is trend direction: is your Visibility Rate climbing, holding, or losing ground? Establish a baseline and report variance, not a single data point.

    For the ROI case, NerdWallet is the clearest analogy available: a 20% decline in organic traffic, paired with a 35% revenue increase, driven by becoming a primary AI citation source. The clicks went down. The qualified intent traffic went up.

    3 Measurement Mistakes That Make Your AEO Data Useless

    Treating ChatGPT as the Entire AI Ecosystem

    Different AI platforms have up to 615 times variance in how they select sources. Google AI Overviews cite YouTube at a 25% rate. ChatGPT’s YouTube citation rate is under 1%. A brand with strong Google AIO presence can be nearly invisible on Perplexity. A brand dominating ChatGPT responses may not appear in AI Overviews at all.

    Single-platform tracking doesn’t give you a partial picture. It gives you a misleading one.

    Calling Mentions the Same as Positive Mentions

    A simple keyword monitoring tool tells you whether your brand appeared. It doesn’t tell you how it was described.

    In generative AI environments, LLMs synthesize patterns from thousands of sources, including user forums. If your brand has consistent negative patterns in Reddit threads, AI may surface those as recurring context in responses, and repeat that framing to every user asking a relevant question. A brand with 30% visibility and a sentiment problem is in worse shape than a brand with 15% visibility and a clean sentiment signal.

    Visibility without sentiment is an incomplete, and potentially dangerous, metric.

    Only Tracking Keywords You Already Know

    Most SEO teams monitor the queries in their existing keyword database. But AI users interact in long-form, highly specific, often subjective prompts: “which CRM is best for a team that does a lot of async work and doesn’t want to deal with complex onboarding.”

    These “dark queries” don’t appear in your keyword planner. Without prompt expansion techniques to surface how real users are phrasing AI conversations about your category, your Prompt Coverage will always look higher than it actually is, and you’ll miss the exact moments where purchase decisions are forming.

    Building Your AEO KPI Dashboard: What to Track and When

    AI visibility shifts faster than traditional search rankings. Monitoring frequency needs to match that pace.

    Weekly: Track Visibility Rate changes and competitor Share of Voice. Flag sudden drops and run prompt retests to check whether key pages have been de-indexed by AI crawlers or lost citation weight.

    Monthly: Review Sentiment Score trends, Source Coverage changes, and the stability of cited URLs. Audit AI trust sources and identify which third-party platforms are gaining citation weight in your category.

    Quarterly: Assess Entity Authority Score and Prompt Coverage expansion. Update structured data markup and adjust site content architecture to align with current AI extraction patterns.

    For teams that need this at scale, Topify structures all seven of these dimensions into a single monitoring matrix: Visibility, Sentiment, Position, Volume, Mentions, Intent, and CVR tracked across ChatGPT, Gemini, Perplexity, and other major AI platforms. In a B2B SaaS scenario, for example, Topify surfaces where a competitor has displaced your brand by publishing updated benchmark data or securing new third-party citations, and surfaces one-click optimization actions — like generating comparison tables formatted for AI extraction or identifying the specific content gaps driving the position shift.

    The dashboard architecture that works best layers four data levels: where your brand surfaces across AI platforms (surface), which content types AI preferentially cites (asset), which prompt intents you’re covering (prompt), and what downstream commercial behavior results (outcome). Most teams start with surface and skip straight to outcome. The asset and prompt layers are where the actual optimization signal lives.

    Conclusion

    The measurement gap in most marketing teams right now isn’t a data problem. It’s a framework problem.

    Traffic dashboards are optimized for a world where clicks were the primary signal of discovery. That world is eroding. When 60% of searches resolve without a click, and when the highest-intent traffic comes from AI referrals that look like direct visits, the old metrics don’t just underperform. They actively hide what’s happening.

    Visibility Rate, Share of Voice, Sentiment Score, Position Rank, Source Coverage, Prompt Coverage, and CVR — these aren’t additions to your KPI stack. For any brand with real exposure to AI-driven search, they’re the primary scorecard.

    The brands building measurement fluency in these areas now will have 12-18 months of competitive insight before the rest of the market catches up.

    FAQ

    Can I track AEO KPIs without a paid tool?

    Manual spot-checking is possible, but structurally misleading. Because LLM outputs are probabilistic, the same prompt can return different results across queries. Professional tools use large-scale repeated sampling to build statistical averages of brand performance across hundreds of thousands of potential user interactions. A manual audit of 20-30 queries typically takes 8-12 hours and captures a single moment in time. Automated tools cover thousands of variants in 2-4 hours and return a reliable mean performance score.

    How fast do AI visibility metrics change?

    Fast. Between 40-60% of AI Overview citation sources rotate every month. This isn’t traditional ranking drift. It reflects model updates, real-time retrieval (RAG) weight adjustments, and new data source integration. Continuous monitoring, not periodic auditing, is the right operational model.

    What’s a good Visibility Rate benchmark for my industry?

    It varies significantly. In healthcare, AI Overviews trigger on 48.7% of relevant queries, making 30%+ visibility necessary to maintain category authority. In real estate, AIO triggers only 4.4% of the time, so 10% visibility already represents market leadership. For most B2B SaaS categories, 10-15% is a healthy starting benchmark. Above 30% is market leader territory.

    Is zero-click actually hurting my brand, or is it neutral?

    For ad-revenue-dependent publishers, it’s damaging. For brand marketers, it’s a reallocation of where value gets created. The direct referral traffic that disappears tends to be lower-intent. What remains converts at 4-5x the historical rate. Plus, repeated brand mentions in AI responses build top-of-mind awareness even without a click, compounding into long-term brand equity in ways that don’t show up in session counts.

    Read More

  • AEO KPIs: What to Track When CTR Stops Making Sense

    AEO KPIs: What to Track When CTR Stops Making Sense

    Your domain authority is solid. Your top pages are ranking. But organic traffic dropped 61% for informational queries between mid-2024 and late 2025. The rankings didn’t move. The CTR did. And the reason isn’t a Google algorithm update—it’s that the answer to your customer’s question is now living inside a ChatGPT or Perplexity response, not on your site.

    Traditional KPIs can’t capture that. Here’s what to track instead.

    Why CTR Can’t Tell You What AI Search Is Doing to Your Brand

    CTR made sense when search was a list of blue links. Click a link, visit a page. Simple.

    That model is broken now.

    As of mid-2025, approximately 60% of all Google searches end without a single click to an external website. On mobile, that number hits 77.2%. When a Google AI Overview is present, the top organic result’s CTR can fall by roughly 79%. For paid search on queries that trigger AI Overviews, CTR dropped from 19.7% to 6.34% in just over a year.

    This creates what researchers call a “visibility gap.” Your analytics platform reports impressions. It reports sessions. But it can’t tell you whether an AI engine cited your brand, recommended your competitor, or described your product in terms that contradict your positioning entirely.

    That’s the gap your current KPI stack can’t see.

    The 5 Core AEO KPIs That Actually Matter

    Tracking AEO performance starts with shifting the measurement frame from “user actions on your site” to “brand influence inside AI responses.” These five metrics form the foundation.

    1. AI Visibility Rate: Is Your Brand Even in the Answer?

    AI Visibility Rate measures how often your brand appears in AI-generated responses for a set of target queries. It’s the AEO equivalent of organic ranking.

    The formula is straightforward: divide the number of queries where your brand appears by the total queries tested, then multiply by 100. The harder number is the benchmark. Average brand visibility in AI answers sits around 0.3%, while top performers in competitive categories reach 12% to 30%. If you’re tracking 100 prompts and appearing in fewer than 10, there’s a structural content problem worth diagnosing.

    2. AI Position: Where You Land in the Response

    Being mentioned in an AI answer isn’t the same as being the first recommendation. Position tracking captures where your brand appears within the response, since a first-place mention carries significantly more trust-building weight than being listed fourth.

    Because AI responses are probabilistic, brands often use a weighted Position Index. A first mention scores 1.0, second scores 0.5, and so on. This gives you a comparable, stable number across prompt sets, rather than a volatile “sometimes first, sometimes fifth” that’s hard to act on.

    3. Share of AI Voice: You vs. Everyone Else

    AI Share of Voice (AI SOV) measures what percentage of brand mentions your company captures relative to all brand mentions across a competitive query set.

    The most accurate method is the “open denominator” approach: identify every brand mentioned in a response set, not just the ones you pre-defined as competitors. This prevents metric inflation and forces an honest look at who else AI is recommending. Leading SaaS companies achieve AI SOV rates up to 59.4% in their categories, highlighting just how uneven the distribution can be.

    4. Citation Source Rate: Which Content Is AI Actually Pulling From?

    Citation Source Rate tracks the domains and URLs an AI model uses to construct its answers. This is the most diagnostic metric in the AEO toolkit because it tells you why your visibility is high or low.

    Research into 46 million citations shows AI models tend to favor a small cluster of high-authority domains. If AI Overviews for your category are pulling from Reddit threads or G2 reviews instead of your owned content, the strategy implication is clear: you need visibility on those third-party platforms, not just on your own site.

    5. AI Sentiment Score: What Tone Does AI Use About Your Brand?

    A brand can have 80% AI visibility and still be losing. If the AI consistently describes your product as “expensive and difficult to configure,” visibility becomes a liability.

    Sentiment scores typically run on a 0-100 scale, evaluating the overall tone of AI responses, how that tone shifts across topics (product features vs. pricing vs. customer support), and the sentiment of the underlying sources influencing the AI’s language. Tracking sentiment over time tells you whether your content strategy is shaping the AI’s narrative about your brand, or whether someone else’s content is.

    The Metric Most Teams Skip: Conversion Visibility Rate

    There’s a sixth metric that most AEO dashboards don’t include yet. It’s the one most directly tied to revenue.

    Conversion Visibility Rate (CVR) estimates the likelihood that an AI answer is driving users toward a brand interaction—even without a direct click. The logic: a user who arrives at your site via an AI citation has already been pre-qualified. They’ve compared options inside the AI interface and read about your value proposition before they ever hit your homepage.

    The data supports this. AI-referred search converts at 14.2% compared to 2.8% for traditional organic search. For SaaS companies specifically, lead conversion from ChatGPT referrals reaches 15.9%, versus 1.76% for standard organic. That’s an 803% variance. Traffic volume is down; traffic quality is up. CVR is the metric that captures this shift.

    Platforms like Topify track CVR as part of their seven-metric analytics framework—alongside Visibility, Sentiment, Position, Volume, Mentions, and Intent—to give marketing teams a full picture of downstream business impact from AI citations.

    How to Build a Simple AEO Reporting Dashboard

    The first thing to fix is your prompt library. Replace “keywords” with a prompt matrix: 25 to 100 conversational queries that simulate real buyer journeys. “Best project management tool for remote teams” instead of “project management software.”

    From there, the reporting structure is straightforward:

    DimensionWeekly MetricTarget
    VisibilityAI Visibility Rate>10% for category prompts
    AuthorityShare of AI VoiceTop 3 in competitive set
    TrustAI Sentiment Score>80/100
    ConversionConversion Visibility RateHigh-intent prompt correlation
    Branded LiftBranded Search VolumeMonth-over-month increase

    Weekly tracking catches model volatility and citation rotation. Monthly benchmarking gives you the competitor SOV comparison. Quarterly audits let you review the technical layer—structured data, schema markup, content extraction efficiency.

    Topify automates this by querying AI platforms directly in real time, so the data reflects what ChatGPT and Perplexity are actually saying about your brand today, not what a crawler estimated last week. The High-Value Prompt Discovery tool surfaces the exact questions your audience is asking AI, which feeds directly back into content gaps.

    The Platforms You Can’t Ignore in 2026

    A single “AI search” number is misleading. Citation logic varies significantly across platforms, and treating them as interchangeable leaves blind spots.

    PlatformRetrieval LogicCitation Behavior
    ChatGPTGPT training + Bing SearchAccounts for 87.4% of AI referral traffic
    PerplexityRetrieval-first (Sonar)Cites 6+ sources per answer; over-indexes on Reddit/Quora
    Google GeminiGoogle Knowledge GraphFavors Google properties (YouTube, Maps, Docs)
    Google AI OverviewsGoogle Search IndexHigh correlation with top 10 organic rankings

    Perplexity rewards “semantic concept density”—pages cited by Perplexity tend to have around 32% more explicit concepts than uncited content and benefit from a 60-day freshness loop. Google AI Overviews rotate their cited sources 40-60% month-over-month, which makes continuous monitoring non-negotiable rather than a nice-to-have. Brands that do appear in AI Overviews earn 35% higher organic CTR than those only ranking in the traditional results below.

    Optimizing for one platform without monitoring the others creates a false sense of coverage.

    Conclusion

    The shift from CTR to AI visibility metrics isn’t a trend to watch. It’s a structural change that’s already affecting revenue.

    CTR measures what happens after a user sees your result. AEO KPIs measure whether your brand is in the result at all—and what the AI says about you when it is. The brands building these measurement systems now are accumulating a compounding advantage: higher AI visibility leads to more branded searches, which reinforces organic authority, which feeds back into AI citations.

    Start with AI Visibility Rate and Share of Voice. Add Sentiment once you have baseline data. Build CVR tracking as the business case grows. The specific tools matter less than the habit of measuring what AI is actually saying about your brand, across all the platforms your customers are using.


    FAQ

    Q: How is AEO different from SEO when it comes to measurement?

    A: SEO measures user actions—clicks, sessions, rankings in a list. AEO measures brand influence: how often you’re cited, where you appear within AI responses, and how the AI describes you. SEO asks “How do I rank for this keyword?” AEO asks “How do I become the source of the answer?”

    Q: How often should I check my AEO KPIs for AEO?

    A: Track core prompt visibility weekly. AI models are non-deterministic and update their crawl caches frequently, so weekly checks catch citation drops before they compound. High-volatility platforms like Google AI Overviews may need even more frequent monitoring given their 40-60% monthly source rotation.

    Q: Can small brands realistically track KPIs for AEO without a big budget?

    A: Yes. AI engines prioritize clarity and structured data, not ad spend. A small brand can build a list of 20-30 core prompts, test them weekly across ChatGPT, Gemini, and Perplexity, and track results in a spreadsheet. Adding FAQ schema markup and a clear “source of truth” page costs nothing but improves AI extraction meaningfully.

    Q: What’s the most important AEO KPI for long-term brand authority?

    A: Share of AI Voice across a broad set of category-level prompts is the closest equivalent to market share in generative search. It captures not just whether you’re mentioned, but how your presence compares to every other brand the AI considers relevant to your category.


    Read More